USDT.D / Move downFor Tether , I expect a strong corrective movement in the next few days, which will pump Bitcoin and altcoins.
#btc
#usdt
Bircoin

$157,000 is where we headingBitcoin surely is in bull move. If a full fledged bull is played out, we may see bitcoin at 157,316 usd in mid 2024.

BTCUSDTShort-term scenario: selling in the area of 27,500 to a target of $25,000
Mid-term scenario: in case of formation of back confirmations, purchase order at the price of 25,000 to the target of 29,500

Ygg Breaks Descending Channel Descending Channel Breakout Has Already Confirmed Retesting In process Incase Of Successful Retest Expecting 45 to t0% Bullish Move

Bircoin, How I'm playing the next move.BTCUSD / 1D
A quick snap video on the current price action on Bitcoin and how I would like to go with it.
Tarde safely,
Tarder Leo.

Bitcoin weekly pattern repeats ?As you can see in the chart, it would seem that history is repeating itself a little on the PA
There have been many that look at the PA from 2013 and draw similarities but I've not seen this and so I will post it again
It Must be noted that there is a tolerance of 7 days to these numbers as a weekly chart has 7 days, but its near enough as you can see
Using the 50 EMA ( Red )
From the ATH in Dec 2013, PA remained above the 50 for 266 days till it dropped below - 84 days later, it came back up and touched, pushed through briefly before going back down for another 427 days before it came up, broke through and continued above the 50 for another 784 days to the new ATH
PA has repeated this almost ecactly since the High around April 2021 and we are right on the point where PA, if it wasn't being hit by fundamentals / FED . Fear etc, would be about to push through the 50, as can be seen on chart.
If PA manages to break through now and continues along this "pattern" it would reach an expected New ATH around April 2025, which amazingly has confluence with some other charts and ideas.
For this to work, Obviously, the fundamentals have to work in Bitcoins favour and one of those may well be the continuing fight with inflation in the USA
It has to be said, there is NEVER any certainty with Fractals and Time pattern repeats but there does seem to be a strong similarity, and I find that Fascinating.
I hope you do too

WAVE THEORY IN BITCOIN CYCLESit implies in bull cycle as 1-2-3-4-5 between this point at 1-2 drop(fear or pain)< 3-4 drop (fear or pain)
it implies in bear cycle as A-B-C

Bitcoin (BTC/USD) Daily Chart Analysis For Week of Nov 11, 2022Technical Analysis and Outlook:
Bitcoin has completed our designated Outer Coin Dip of $15,500, as shown since Bitcoin Daily Chart Analysis For June 17. As a result, a massive rally was staged, creating Mean Res $17,600 launching from Key Sup $15,850 for an upcoming upside move with an additional Outer Coin Rally marked at $19,100. The down-trend projects the next Outer Coin Dip of $12,400 in the foreseeable future.

BTCUSD not as bad as it looksThe price is sitting on the support.
RSI oversold on 4h timeframe.
We don´t have any divergences yet, however we may get them before breaking out.
Many people say that we will breakdown already now. We expect that bitcoin will surprise everyone and will give us a pump as a SHORT SQUEEZE. Many traders already entered short position. Late shorts will be punished.
Expect unexpected.

BTCUSD (14/07/2022)On this case we are giving a new structure on BTCUSD price liquidation top and bullish compresión around a triangle.
We are studying that 4h chart withe the same structure on the last month of May have a similar movement. At that time we are trying to understand if the institutianal programmed break-stoploss IA (smart money) will be trapping shorts out of the liquidity top of the triangle structure, with a fake breakout or simplly to strat a little bullish rally out of the top of this chart pattern.
We hope that could be appreciated by some of you guys!
Have a good dat and stay focused on your bigger and smaller ides!
;D

BTC OutlookBTC had a massive volume today at especially Binance exchange after March 2020's after which bear market ended. This staggeringly huge spike means the price bottom is here and bears you are weak to battle with me.

The best signal that shows return of the bulls!Hi, friends! The fell of BTC made a lot of pain for cryptohodlers but not for crypto traders. The market volatility (change of the price in % through the time) help the traders to make deals in both sides: short and long.
📊In the same time hodlers have to wait for the an uptrend almost for 6-12 month, sometimes years as it was after 2013 and 2017 crypto crash.
🚩What is the signal we have to wait? The main techical "indicator" and the bullish signal will be the change of bear trend to bull trend. You have just wait for the Higher Highs (HH) and Higher low (HL) series.
📊Bitcoin in 4 out of 5 cases made the consolidation atthe lows. During the consolidations the crypto investors get tired and sell their crypto beause of fear to lost all their moneys.
Of course, the whales can collect liquidity below the local lows at $17640 and price can fall to $15500-17000. Now the chace of this is almost 40-45%.
🚩What else can help you to identify reverse of the trend? The huge volume of the long traders liquidation. Mostly, because of such leveraged traders and hodlers the price fell so low by 70-80% from it`s ATH. This is a specific feature of crypto. If you see the local manipulation with target to make the collection of liquidity (false breakouts) always pay attention to volumes. If the volume bars growth it`s a best signal at the BTC bottom especially at higher timeframes.
🏁What you can add to this BTC chart? Have any idea when the trend will change (not about inflation and Fed rate pls)? Write your thoughts in the comment.
💻Friends, press the "like"👍 button, write comments and share with your friends - it will be the best THANK YOU.
P.S. Personally, I open an entry if the price shows it according to my strategy.
Always do your analysis before making a trade.

📈ADA: the support area hold the price! Where to open long?After the last idea of ADA only the trendline is changing. The price return to the support value area of $0.45-0.48 and volume isn`t grow as expected.
The volume growth should show to us the pressence of buyer but after the such massive dump maybe the whales don`t need additional liquidity and ready to the pump after the squeeze and trendline breakout.
As i mention before, the targets are in many ways depends on BTC growth. If BTC starts to pump ADA can reach all the value areas:
🔶 $0.51-0.52
🔶 $0.55-0.57
🔶 $0.62-0.64
Now we see how ADA almost copy BTC movements so to open a long keep an eye on the top-1 crypto. If BTC reach 23-25k at least 2 of 3 targets will be reached also.
💻Friends, press the "like"👍 button, write comments and share with your friends - it will be the best THANK YOU.
P.S. Personally, I open an entry if the price shows it according to my strategy.
Always do your analysis before making a trade.

Strong bearish momentum of bitcoinConsider the following in the weekly timeframe:
1- Bitcoin has created 8 consecutive red candlesticks for the first time in history.
2- The Bearish setup of TD sequential started before the end of the previous bearish countdown.
3- momentum indicator crosstown the zero line
4- The VI indicator has a descending crossover.
based on the first two, what we are facing seems to be a strong downtrend momentum.

Bitcoin, the most transparent chart I have ever seen.BTCUSD / 1W
Hello traders, welcome back to another market breakdown.
Bitcoin has been trading in a down-trend, the buyers are disappointed after breaking the 30k support level (the weekly bar is not closed yet). So, there might be another push up to test the 33k-37k levels.
Bulls are still buying the dips, where bears are looking at 2 target in vision:
1- bears target 18k-20k: Test for the Breakout Point.
2- bears target: Measured move as a second leg down.
Traders should be looking to sell short. Where investors should be looking to buy these levels following the dollar cost everage strategy.
What am I doing? I'm not trading Bitcoin , so I'm applying the dollar cost average strategy but I have a thesis inspired from Amazon's chart and the dot com bubble in 2000. So, I'll be buying more at 20k and heavily at 12k if we reach such levels. I'll publish the Amazon's chart soon.
Please note, this is not a financial advice. This is my opinion and I'll apply it.
Trader Leo,
Trade safe.

BITCOIN LONGS 📉📉📉BITCOIN - As usual price made a huge drop below sell side liquidity to take out retail stops, and closed bullish above on the D1 meaning there is a huge potential for the upside movement, fear/greed index is in extreme fear as well meaning there is a good buying opportunity.

BTC LONG 52000BTC will arrive to 52000 when it can break 49000 level and then need good support and it can be happen for the next5 days

Bitcoin - Will it 5, or will it C?Seeing the degree of complexity in some analysis posted here... I feel pretty bad submitting this simplistic approach.
However, after some basic fibs, I see one of two variants. the 5th bullish wave, or the C-ontinuation of the correction.

Hold some with patience#DEGO
In Daily timeframe, Consolidating in Massive Triangle Pattern..
In Case of Upside breakout we will see a big raise in price
Keep ur eye on it
Don't forget to support this idea by ur like and comment
Good luck💙

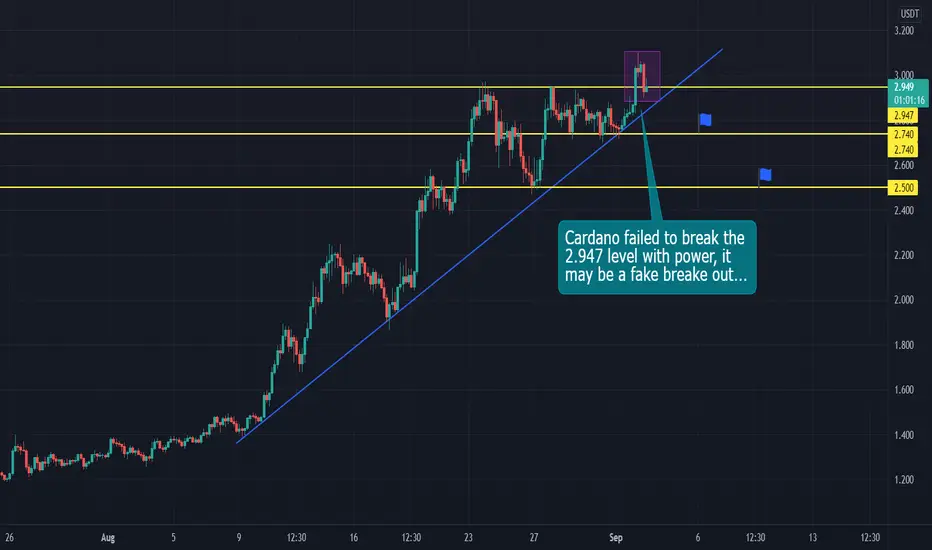
Cardano failed to stabilize above the price of 2,947Cardano failed to stabilize above the price of 2,947.
Given the strong downtrend shown in the figure, as well as the possible scenario for Bitcoin that I described in previous posts, Cardano may not be able to stabilize above $ 3.0.
In any case, Cardano buyers are better off looking for better trading opportunities.

Mid TermUnfortunately, our Altcoins analysis was failed due to the sharp down of Bitcoin.
Bitcoin can correct 0.5 or 0.618 of the last wave.
I will buy in 42,000 to 39,800.

BTC - Ascending Chanel - Be carefulNext neck line touch can already break. I'm in favor of the second one coming.
Ascending channels break very often on the down so let's all be careful.
