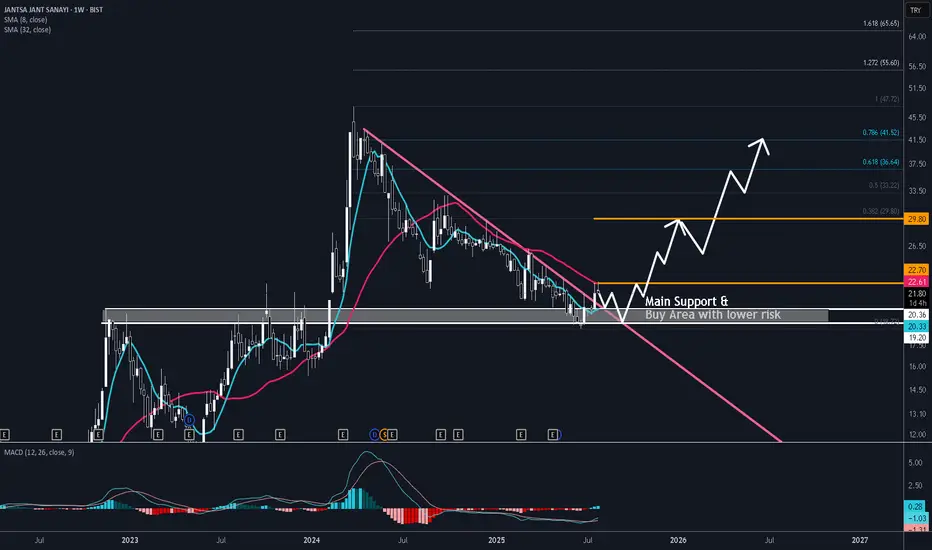
MID-TERM LONG OPPORTUNITY FOR JANTSAs the descending trend was broken out after 16 months, new bullish move is possible for JANTS. There may be ranging price for a while but 19 TL will be a strong support and the stop loss should be set to below 19 TL weekly closure. I believe every downward move to 19-20 TL will be a buy opportunity with lower risk. As this is mid term perspective, 10% loss in possible if the stop loss is triggered. Past performance and win ratio of weekly MACD in JANTS look supportive in this long trade.
BIST
BIST30 (USD) Monthly: Head & Shoulders Confirmed? Neckline RetesType: Bearish
The Turkish Stock Market (BIST30 or XU030), when viewed in US Dollar terms on the monthly chart, presents a textbook Head and Shoulders (H&S) topping pattern.
We can observe the Left Shoulder, a higher Head, and a lower Right Shoulder, indicating waning bullish momentum at the peak of what has been a significant rally.
The fact that this pattern is forming on the monthly timeframe underscores its long-term significance, suggesting a major structural shift rather than just a short-term correction.
The Neckline Break & Retest:
Crucially, the BIST30 (USD) has recently broken below its multi-month neckline, a key support level that connected the lows between the shoulders and the head. This breakdown served as the initial confirmation of the H&S pattern.
What we are witnessing now is the classic retest of this broken neckline. Price has rallied back towards this former support, which now acts as strong overhead resistance.
This retest often provides a 'last kiss goodbye' before the larger bearish move unfolds.
The market's reaction at this retest level will be paramount. A strong rejection from the neckline, potentially accompanied by increasing bearish volume or bearish candlestick formations on lower timeframes (e.g., weekly), would further validate the H&S breakdown and strengthen the bearish outlook.
Potential Price Target:
Based on the classic H&S methodology, we can project a potential price target. By measuring the vertical distance from the peak of the 'Head' to the neckline and projecting it downwards from the breakdown point, we derive a preliminary bearish target around 220 USD for BIST30 (XU030)

High Risk/reward Ratio for ODAS Long TradeI believe ODAS has not much time for breakout. Stop level should be weekly closure below 4.5 TL which is the testing area of double bottom. Take Profit should be set to fibonacci level 8TL.

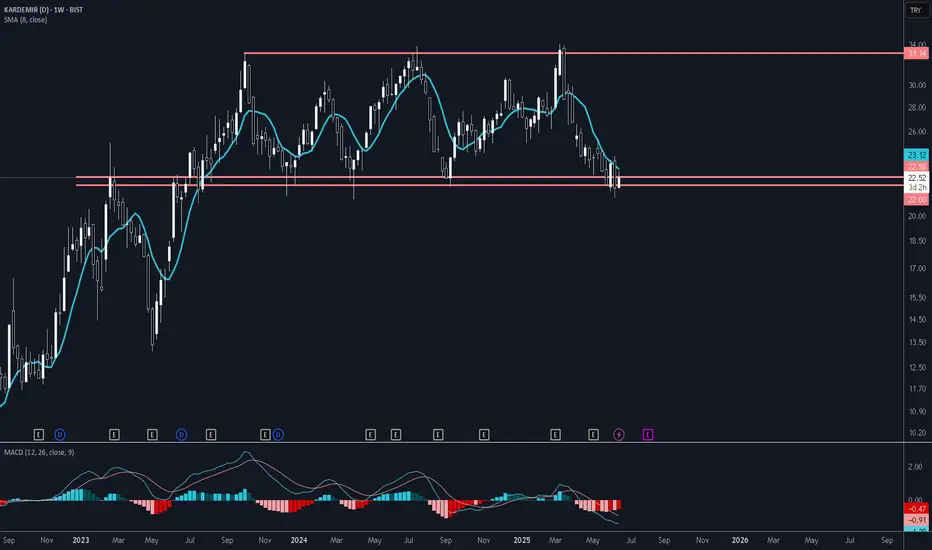
Low Risk for KRDMD Long TradeAs we are close to the bottom line of the horizontal band, long trade is my suggestion in KRDMD. As the stop level would be weekly closure below 22 TL, there is very high risk/reward ratio. I see 25-30% profit is possible if we set the TP as fibonacci 0.618.
Will BIST100 beat inflation?BIST100, which has been trending horizontally and falling for a long time, I think it can rise from here and the final rise phase will come. It is too early to say this before the new ATH comes, but I think the 10.9k region is the decision point. When it stays above it, after a move to the 11.8 region, the price should be watched carefully and be cautious. It will look like second BTC 69k ath. So in these times, I think it would be more logical to proceed with a shorter hit and run.

bobet is ready to fry #bobet is showing a promising pattern. Historically, the 200-day SMA has acted as strong dynamic support and resistance — and it's being respected again.
Recently, #bobet broke above the 200-day SMA. Before that, a clear double bottom formation appeared — a classic and powerful reversal pattern.
Now, only one major barrier remains: the confluence of key horizontal resistance and the top of the descending channel.
Watch trading volume — we've seen a noticeable spike in recent weeks, which adds weight to the move.
Everything seems set for a new bullish trend.
What we need now is a clean breakout above 25 TRY, a healthy general market, and a well-defined stop-loss. That’s it.

OBASE is BULLISH BIST:OBASE
Strong breakout to the upside from a key level on HTF (1D),
bullish flag on LTF (1–4h),
EMA 20–50 bullish crossover + SMA 200 breakout to the upside.
I'm seeing a 1:7 RRR.
2D ATR stop loss: 29.60 TL
Take profit: 55.30 TL

Technical Analysis of BIST100 Index: Examining Trends and PriceIn this technical analysis, we have examined the Istanbul Stock Exchange Index (BIST100) with a special focus on trend lines and price channels. By precisely drawing trend lines, price channels, and linear patterns, key support and resistance levels have been identified. This analysis, using a simple approach without complex tools, provides investors with a clear perspective on the potential future movement of the BIST100 index in the near future.

xu100XU100 is in contact with the upper resistance of the wedge it entered in December 10. I think it will decline to the lower support, but the target is to return to the 11,000 level with the wedge break.

Probable correction of bist100 ( Xu100 )#bist100 index has formed an " evening star " candle pattern and this is the probable signal of downtrend. I drew probable bounce zones on #xu100 ( #borsaistanbul ) chart. Blue way, the W bounce seems more probable for now. Not financial advice.

Short, target 104.3Following weekly chart.
It's under EMA13 and got a short confimmation.
There is a reversal cup & handle formation which can speed up short.
Following power indicators and they're weakening.
TP1 104.3 - around 5% gain
TP2 98.45 - Fibo level
SL - Not super RR but following 121 level.

#XU100 düşüş başlıyor mu?#XU100 1D grafik;
Bist100 grafiğinde ilk göze çarpan RSI tarafındaki uyumsuzluk
Yılbaşından beri 7 aylık bir yükseliş trend çizgisi üzerinde nizami hareketine devam ediyor ve yeniden destek bölgesinde
Bu desteğin bir kez daha çalışacağını düşünüyorum ancak bu kez zayıflatacaktır
Akabinde tekrar bu desteğe geri dönüp burayı kırdıktan sonra retest ile birlikte aşağı yönlü bir harekete başlaması sürpriz olmaz
Bu seviyeden yaklaşık %22 aşağısına kadar düşmesi ihtimaline karşılık harmonik bir yapı da mevcut. O seviyelere kadar düşer mi orasını göreceğiz.
#bist #bist100 #bist30

XU100.USDWhen I examine the investment plans of international companies in Turkey, I can see this graph more clearly, its wanting to return to the upward trend.

Ttrak (Türk Traktör) Flat CorrectionThis could be one of the strong possibilities out there...
Don't know what could be the factor or news but after comleting last up move to finish wave B of a flat we can expect strong impulsive C wave to complete Wave 4.


Turkish Stocks... Time to Short?/obviously yes/Simply get out from the Turkish stock market on the next up...
All of the stocks on the market will have min %50-%70 correction.
Don't fall into the trap of manipulators. Unempleyement will go up . Companies will have to pay their depts... 💩 news are loading. Buckle up.
I will update the idea as it hit the bottom.
This is not a financial advice do your research and take the risks accordingly...

#XU100 #bist100 figuring out something like this...300 dollars is an important physchological resistance. If BIST:XU100 does not able to break, i marked the retrace zone. The situation is bullish now.
NOT FINANCIAL ADVICE.

#AHGAZ seems to be bounced in short termBIST:AHGAZ 's bounce may give a buy opportunity in this zone.
NOT FINANCIAL ADVICE.


#ALFAS gotta continue mooning after a little breakAfter breaking out the bearish megaphone channel, BIST:ALFAS is now deserving the bull run. Some unimportant corrections are necessary this week , but after successful retest the owners will be greedy. NOT FINANCIAL ADVICE.

reedr teknoloji kısa vadeçok net kısa vade easy money, herşey çok açık görünüyor temel analizde de yükseliş olmasını beklemek yanlış olmaz bist önümüzdeki süreçte para kazandıracaktır reedr grafikte güzel eq seviyesine çekilirmi bilmiyorum ama ben daha önce almışltım eq gelirse bir okadar daha ekleme yapmayı düşünüyorum

#CIMSA chart looks tastyBIST:CIMSA weekly candle chart is accumulating for the next move. After the bounce , at least the previous ATH is expected in mid term.
NOT FINANCIAL ADVICE.
