BTCUSDTHello Crypto Lovers,
Mars Signals team wishes you high profits.
We are in a daily time frame with the Bitcoin analysis update.
As you see, the price has started to move upwards after the break of the resistance area and is fluctuating close to the resistance line.
At the moment, the daily candle can move towards the resistance ahead, and if the $ 50,000 resistance is broken, we can trade for the next resistance and higher targets.
It is also possible that the candle will move towards its support, then start moving upwards.
As long as Bitcoin fluctuates above the support line, the market is bullish, but if it drops below the support line, and stabilizes, we consider further decline, which has a low probability.
Warning: This is just a suggestion and we do not guarantee profits. We advise you analyze the chart before opening any position.
Wish you luck
Bitcion

Launch soonAmong my other ideas, this one is more or less relating to how long a correction may last. Back in January when we capitulated from 42k to 29k , it took roughly 24 days to start feeling a recovery. We were signalled a recovery when we found hidden bullish divergence on the Daily RSI as well as MFI holding steady during the dip. It's been 22 days so far for us and have dropped roughly 13k. It feels kind of similar to January in that regard.
So, what I'm waiting for before becoming all-to-bullish is daily (hidden or not) bullish divergence pretty soon here.
I'm still convinced we're in a bull-market (see related ideas '259k Bullmarket Top & How' & 'This time is no diferent'), but the only thing that'll worry me is sideways action through the end of October... Only then will I become bearish (see '1 for the bears' idea)

BTC weeklyA weekly BTC chart I'm posting for my own self-reference.
A continued down-trend with bottom near 19k but wicks going as low as 13k. Lasting through the end of the year.
When RSI on the weekly drops below 40 it marks a huge buying/accumulation opportunity.

SUSHIUSDT Looking BullishSushi Looks Bullish And Forming H&S on 4h
Also Pattern Fail if BTC fall-down
T1 : 14.66
T2 : 16.689
SL : 12.895
not financial advice it's your choice to get in

BTC Breakout and RetestIf BTC can close hourly above 50k, we could see a retest at any of the blue, red, or black levels. We are in a good position to continue the move upward
tawtis

Inverse chart perspective: Broadening wedge pattern** BTC Inverse chart perspective
From inverse chart perspective looks like we're creating a broadening wedge to the downside.


Bitcoin Longs 80K is coming! Bitcoin price action that takes us to 80k December 2021 or 2022 Happy Xmas everyone !

1H Chart. BTC Squeeze, Explosive Move Incoming ? Hello friends, latest update on the last analysis which was exactly as visualized.
1 . There is ongoing squeeze for $BTC, one-hour chart. Massive battle at the $46k region between the bulls and bears. Pressure is building either way.
2 . I had to use a Channel for clarity. You can see on the chart, back and forth Push-n-Pull forces acting on Bitcoin at this range .
3 . If Bulls win, we breakout upwards this channel , and EXPLOSIVE price shoot will happen.
4 . If Bears win, breakdown will happen , a significant drop will happen. Strong support will hold only for the time .
5 . Key candle for upward confirmation must begin at $46,500-503 $BTC price . Watch out
If all else remains constant and NO government FUD … this analysis will remain valid.
Follow 🚶
Like 👍
Share your thoughts

Bitcoin (BTCUSD) near term high likely inA series of Fibonacci extensions show a cluster of key 161.8% and 61.8% levels all converging around the 54k to 55k value area. Consider that the Gann Death cycle of 49 bars is right where the next weekly candle opens as well as this time period being an anniversary period of important highs and lows found for Bitcoin, we should anticipate a likely top here for Bitcoin with a likely retracement to the 28k value area over the next 45-90 days.

Whats NEXT For Bitcoin Now That AMAZON Has Denied Crypto ReportsMartyBoots here. I have been trading for 14 - 15 years and I am here to share my ideas with you to help the Crypto space.
Bitcoin & ALT Coins are Setting up for a HUGE bounce and we in CryptoCheck intend to make lifechanging money
------------------------------------------------------------------------------------------------------------------------------------------------------------
If you want help trading Bitcoin or any other ALT coins hit me up , We will improve your trading . Have a look at the link below
------------------------------------------------------------------------------------------------------------------------------------------------------------

BITCOIN WILL BREAK AND GOES DOWN IN 24 HOURSwe can see the power of bearish on 4h canndel . easily will go down on 24k support . it will be that sharp that maybe we can see 18k price.
not a good time for holders and good news for sellers

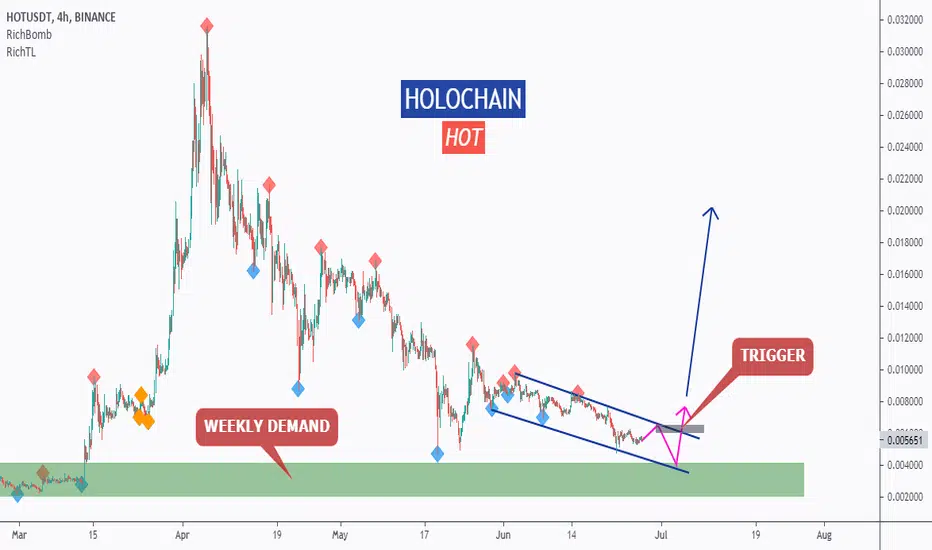
HOT - Potential Bullish Reversal!Hello everyone, if you like the idea, do not forget to support with a like and follow.
HOT is sitting around a strong weekly demand zone in green so we will be looking for buy setups.
Before we buy, we want the buyers to prove that they are taking over again.
You don't want to buy a bearish market right?
on H4: HOT is forming a channel in blue but our upper trendline is not valid yet, so we are waiting for a new swing high to form around it to consider it our trigger swing. (projection in purple)
Trigger => Waiting for that swing to form and then buy after a momentum candle close above it (gray zone)
Meanwhile, until the buy is activated, HOT would be overall bearish can still trade lower.
Good luck!
All Strategies Are Good; If Managed Properly!
~Rich
Witness the Perfection of Levels published earlier in BitcoinWitness the Perfection of Levels in Bitcoin published on 10th june

IS ETC READY FOR BLAST OFF? #BLESSEDPIPS CRYPTOS HAVE BEEN VERY SILENT LATELY, WITH GOLD AND SILVER NOW BULLISH. WILL THE METALS LEAD THE WAY FOR THE CRYPTOS LIKE THE FIRST BULL RUN WE HAD THIS YEAR. VERY EXCITED TO SEE WHATS NEXT.
#BLESSEDPIPS


BTC heading below 30kCould we see this pattern forming for BTC?
Larger Bullish Butterfly pattern forming over the past 14 days.
Completion of the pattern would take us to 1.272 (29k) or 1.618 (26k) Fib Levels. We may still go sideways for a bit before it reaches bottom.
Looking at the RSI it also broke bearish and slope is down.
Selling pressure is high. Again a break below 30k would probably set off a cascade of sell offs, so 26k isn't out of the realm of possibility. Would also align with the break out predicted by the bear pennant.
I expect at least some rally to follow. Still a strong down trend so go long at your own risk.
Let me know what you think.

BTC hoping to find support at 34k.Depending on how you draw your trend lines it appears as if BTC either broke back within this pennant or has broken below the pennant. To me it looks like it broke down.
RSI is dropping and volumes are dropping.
BTC has found support at 34k several times already and will likely find at least temporary support there again.
I expect it to break below this level though and for us to head down and test 30k.
A measured move from here from the top of the pennant to the bottom would have us going down 30% near 25k.
Could get very bloody over the next week. I'm not convinced 25k is the bottom either.
The daily charts look much the same.
Let me know if you agree or share your opinions.

Alt Market Cap Analysis - upcoming opportunitiesHello buddies, how are you?
No need to explain about Alts for what happening over the past couple of days. We had seen huge red candles on the overall market. But most of us did not even imagine that the market will fall that much. So presenting you my thought on the current Alt market cap is what am seeing right now.
- In the chart, you can spot Pitchfork which I drew from the recent top. It was presenting index can be in short term or maybe long term downtrend.
- You can closely look into the pattern, every resistance and support line was working well, price action in this pattern was so much accurate.
For now....
- In the chart, you can see one dotted trendline which was the retest point of the index before moving upward and one red trendline named 'trigger line', yes the index broke this red trendline and the current price action is above this trendline. And what is that means is the price(index) has broken its downward momentum. Technically we may see an index at the green line soon which will be the C point of a pitchfork. If the index followed this pattern as it did in the past then there's a high possibility of relief in the alt market cap. As always we trade on possibilities so make sure you keep in mind every factor of the market and trade accordingly.


BTC Major Resistance!Hello Community!
BTC /USDT is currently attempting to move above the major S/R zone (white line) shown on the chart. We need to close above this line on the 4hr or Daily TF for this bullish momentum to continue. If entering a trade don't forget to use a stop loss. Don't trade with what you're not willing to lose.
Love it or hate it, hit that thumbs up and comment. It'll be greatly appreciated!
This is not financial advice.
Safe Trading Calculate Your Risk/Reward & Collect!
Simplicity Wins


