BITCOIN There is no turning back from this.Bitcoin (BTCUSD) has started the 5th Bullish Wave of the current Bull Cycle, following the consolidation of the past 2 months. Since the November 2022 bottom we have had 4 such waves with consolidations ranging from 1 month to 6 months (blue Channel of April 10 - October 10 2023). The current wave can technically take Bitcoin up to $100k alone.
What is even more bullish than that though is the fact that the whole (ellipse) structure since the October 2023 Low, resembles the sequences of April 2020 - March 2021 and May - December 2017. As you can see, both were Bullish Legs of the 7-year Channel Up. Symmetrically, it appears that we are past its 2nd consolidation (blue circle) and starting the final rally to the Top of the Channel Up.
That means that the Cycle Top can even be marginally higher than $200k until the 1W MA50 (blue trend-line) is breached again (note that we are past a 1W Bullish Cross also) which can make us start considering a Bull Cycle again.
But what do you think? Is this rise just the start of a wave that will take BTC to 100000 even 200000 if history repeats itself? Feel free to let us know in the comments section below!
-------------------------------------------------------------------------------
** Please LIKE 👍, FOLLOW ✅, SHARE 🙌 and COMMENT ✍ if you enjoy this idea! Also share your ideas and charts in the comments section below! This is best way to keep it relevant, support us, keep the content here free and allow the idea to reach as many people as possible. **
-------------------------------------------------------------------------------
💸💸💸💸💸💸
👇 👇 👇 👇 👇 👇
Bitcoin-btcusd-btc

Bitcoin: 64K To 66K Retrace.Bitcoin pushed into the 70K resistance area over the previous week and retraced. Those who read my articles and watch my streams should not be surprised. My Trade Scanner Pro take profit price is at 72,632 which was missed by a few hundred points (entry was 62,907 on 5/2). As I continue to remind my followers, CONTEXT is key to navigating this consolidation and it can be summarized by two components: Trend, Support/Resistance. To gauge risk, profit potential and probabilities on shorter time horizons, this is ALL you need to know.
Before I get into more of an explanation, here is my scenario for the coming week. There was a new buy signal off 69K (inside bar see arrow). While a higher low typically should lead to a higher high, the 70K resistance area is still intact and appears to be in play. IF the current candle closes weak and the next candle takes out its low, a test of 66K to 64K becomes more likely (see illustration). This is just ONE scenario of countless that I anticipate based on the price structure and support/resistance on this time frame (CONTEXT).
To be clear, this analysis is meant for those who day trade or swing trade Bitcoin. IF you are only interested in longer time horizons, there is no shortage of 'experts' who will be happy to keep you entertained. So you know, the broader the time horizon, the more RANDOM the outcome.
More is NOT better in this game. I estimate that 99% of the information available to the retail trader/investor is nothing more than misinformation or entertainment. Consuming more of it only leads to confusion and random outcomes. This is why I aim to SIMPLIFY by focusing ONLY on information that provides some ACTIONABLE VALUE.
This is where TREND and SUPPORT/RESISTANCE come into play. Markets TREND, that fact alone is why we can argue that markets are not 100% random. For the retail trader, this is one of the few areas of the market that can provide some kind of advantage even if temporary.
Trend provides a basic gauge of probability. This piece of CONTEXT helps to support/resistance levels into perspective and gives a reference point to better shape expectations. For example, for Bitcoin on this time frame, the broader trend is CLEARLY bullish while the shorter time horizon (going back3 months) is range bound. Recognizing this helps me form reasonable expectations about particular price levels in the future (60K, 64K, 70K, 73K etc).
Support/Resistance levels are inflection points where a particular behavior occurred and MAY occur again in the future. While the levels can be broken randomly, knowing trend helps me anticipate which is likely to hold, and which is likely to break. IF the market chooses to compromise a level unexpectedly (it happens) then I ADJUST to the market NOT get stuck on an opinion. For example, in the context of a broader bullish trend, the 70K resistance on Bitcoin should break, and continues to be vulnerable even though a significant break has yet to occur.
Context helps to shape expectations in line with MARKET generated information. As NEW information reaches the market, price adjusts, and we must also adjust. This phenomenon is rooted in the Efficient Markets Hypothesis. This is why those who think they can forecast the future from looking at a bunch of lines on a chart are fooling themselves and you. As a retail trader/investor it serves us best to evaluate BOTH sides of the market and assign a probability to each side. From there at least we can gauge risk and profit potential as per a chosen time frame more effectively and not be misinformed by others (too much internet).
Thank you for considering my analysis and perspective.

BTCUSD - Top IdeaAn idea considering Bitcoin and the current bull run
Using previous tops tops to show how the structure is changing over time
This is better shown with a curve and normally shown that way but this another example.
I think bitcoin will peak before the rest of altcoins and then a massive alt rally will ensue.

BITCOIN Strong Breakout! Buy!
Hello,Traders!
BITCOIN is trading in an
Uptrend and the coin broke
The key horizontal level
Of 67,2k$ which is now a
Support and the breakout
Is confirmed so I think
That the price will
Go further up
Buy!
Like, comment and subscribe to help us grow!
Check out other forecasts below too!

Bitcoin: 64K Test For New Longs.Bitcoin has followed my anticipated scenario nicely over the recent two weeks (it doesn't always agree). As I have written in my previous two articles, the 64K and 68K resistance areas are potential take profit zones, NOT locations to put on more risk. Price action appears to be confirming that and is attempting to retrace off the 66K area minor resistance (See upper arrow). While this price action appears to be bearish it must be considered in light of the broader structure.
Since the March peak, Bitcoin has been in consolidation mode (upon completion of 5 waves). This structure represents a broader HIGHER LOW with 56K established as the bottom of the range. This implies that the broader trend continues to be BULLISH even though recent price action has yet to push major resistances. This is a key piece of context because it helps to shape risk and profit potential for the near future.
How you navigate this will depend on your risk tolerance and trade style but no matter how you look at it, current prices are unattractive for longs on most time horizons in my opinion. The scenario I anticipate this week (see illustration) is a minor retrace to 64K (old resistance/new support) followed by a momentum continuation into the 70K resistance. If a long confirmation appears (Trade Scanner Pro), this can play out well for traders on shorter time horizons.
While I am optimistic in this regard, I also consider that price CAN break 64K and test 60K again. There is NO way to forecast how the market will behave, ESPECIALLY the longer the time horizon.
Managing risk and capitalizing on movements EFFECTIVELY requires knowing how to evaluate market structure in order to stack probabilities. Based on this context if I can determine the trend is bullish for example, I can estimate that supports have a greater than 50% chance of staying intact. I can also expect long signals to have greater than 50% chance of generating some amount of profit, but there is no way to anticipate how much exactly (markets are MOSTLY RANDOM).
Adjusting to price action and looking for signal conflicts or using a trailing stop helps to improve decision making in such an environment. If you get stuck on ideas, cling to hope or consume too much internet, you will soon learn how ineffective this is. The market is a great teacher but the lessons are often VERY EXPENSIVE.
Thank you for considering my analysis and perspective.

#Bitcoin [ Inverted Head And Shoulders - Short Squeeze Combo ] BTCUSD has printed an allbeit slanted yet very nice inverted head and shoulders that has retested and played out perfectly so far. The measured move coincides with multiple high time frame short liquidation levels (Not marked on this chart) with the biggest level being a 6 MONTH high volume liquidation level at $74,045. This strong of a #shortsqueeze could easily amplify the measured move, which I have extended, using the 150%-161.8% fib levels. The extension also lines right up with where all short liquidation levels end on the Coinglass heat map.

BITCOIN starting a mega rally. See when alts will follow.Bitcoin (BTCUSD) just completed the final consolidation phase (red Rectangle) that as per the price action of past Cycles, is the final stage before the 1-year rally to the new Top. As you can see alt coin market (black trend-line) tends to bottom after Bitcoin's rally has already started and when it turns sideways again for a few weeks.
Technically alts make that 2nd major Higher Low on their Cycle and rebound when BTC investors take some profits and direct a certain portion of capital to the riskier but more generous in terms of returns, altcoin market.
So if you're wondering what to do next, be bullish on BTC and as the new rally extends, start taking profits towards August and make sure you're invested in alts. The lower their dominance is by then, the better.
Do you agree with this approach? Feel free to let us know in the comments section below!
-------------------------------------------------------------------------------
** Please LIKE 👍, FOLLOW ✅, SHARE 🙌 and COMMENT ✍ if you enjoy this idea! Also share your ideas and charts in the comments section below! This is best way to keep it relevant, support us, keep the content here free and allow the idea to reach as many people as possible. **
-------------------------------------------------------------------------------
💸💸💸💸💸💸
👇 👇 👇 👇 👇 👇

Bitcoin: New Buy Signal Off 60K.Bitcoin has found overall support just off the 56K level (on my chart) and has rallied back to the 64K resistance only to retest the 60K level (see illustration on chart). This is the scenario I described in my previous article and price is now in an ideal location for a swing trade long on this time frame. Interestingly enough, my Trade Scanner Pro system generated a long signal upon the close in the 64K area which I warned people against taking. Now is the time to be using the system to look for longs on smaller time frames such as the 1 hour. When using this system (or ANY system) CONTEXT is key.
Context comes in many forms, but when it comes to my trend following momentum reversal system, it is all about trend relative to support/resistance levels. These two components are ALL you need to identify higher probability signals vs. more random signals or noise. It is best to think of the signals as a form of confirmation. For example, the 60K area for Bitcoin is CLEARLY a major support level. While there is no guarantee long signals will produce an positive outcome from that level, there is a GREATER probability since price has reacted in this way MULTIPLE times over the previous few months. With or without a system, it is better to be looking for buying opportunities at such a level.
The more important question is how much to risk? Typically on this time frame you are looking at about 1500 pts. based on the recent candle stick pattern. The Trade Scanner is showing even greater risk, but also a greater potential reward (TP is near 72K). Again,CONTEXT carries more weight in these situations. While 72K is a possibility since the broader trend is still bullish, it is better to expect less in a consolidating environment. Using the 64K, and 68 to 70K resistance areas would be better choices in my opinion which puts reward/risk between 2.5:1 to greater than 4:1. Expecting LESS means IF price reaches the first resistance, TAKE something off the table.
It is very important to understand that markets are MOSTLY RANDOM (I repeat this A LOT). This means NO system or analyst can accurately forecast where price will be in the future consistently. Price is determined by the perception of the active market participants, which can be retail traders, institutions, algos, etc. And all of these participants buy and sell for numerous reasons. What drives prices one way or the other are when there are large imbalances in the order flow. This is why a piece of unexpected news can come out of nowhere and completely change the participants perception of the future. Just two months ago, Bitcoin was going to be at 100K by now based on what the internet gurus were forecasting. No one was calling for a test of 56K when price was pushing 73K.
This game is about probability and risk, NOT about how "early investors will make billions". There is a misconception that investors outperform traders and if you comparing the average investor to the average trader this statement may hold true. The part they don't mention though is that investors ASSUME MORE RISK since they are always in the market. People who happen to buy at LOW prices will outperform, but what about the people who buy near the top? This is when the average investor typically buys because the market looks its greatest (and the internet hype is the loudest). To outperform the typical investor or trader, you still need to have a way to gauge context: how low is low? how high is too high? And these questions are ALL a function of how much RISK you are willing to take.
Profitability comes from good RISK management which is rooted in gauging opportunities that carry a greater potential relative to the associated risk. And this can be accomplished by knowing how to evaluate CONTEXT.
Thank you for considering my analysis and perspective.

BITCOIN Another 1D MA50 rejection. More bleeding ahead?Bitcoin (BTCUSD) broke again below the 1D MA100 (green trend-line) after the 3rd rejection on the 1D MA50 (blue trend-line) in almost 1 month (since the April 13 bearish break-out). If it stays unbroken, it is a far from ideal development as the 1-year price action has shown us that such a pattern risks making a Lower Low.
The technical structure since April 08 is a Channel Down nonetheless, so such feat is certainly possible on the short-term. As you can see from past 1D MA50 bearish break-outs, BTC tends to get more than 2 rejections and excluding January 2024, it has stayed below the 1D MA100 for longer.
What's interesting is that if that Lower Low is made, it wouldn't just make a 1D MA200 (orange trend-line) test, but would also almost complete a -30% decline from the recent All Time High. Something that during Bull Cycle rallies is perfectly natural for Bitcoin.
SO do you think the market will go for it?? Feel free to let us know in the comments section below!
-------------------------------------------------------------------------------
** Please LIKE 👍, FOLLOW ✅, SHARE 🙌 and COMMENT ✍ if you enjoy this idea! Also share your ideas and charts in the comments section below! This is best way to keep it relevant, support us, keep the content here free and allow the idea to reach as many people as possible. **
-------------------------------------------------------------------------------
💸💸💸💸💸💸
👇 👇 👇 👇 👇 👇

BITCOIN Nothing to stop this Channel reaching 100k.Bitcoin (BTCUSD) is trading within the Rally Channel (green) with the price having already reached its bottom, making the 2nd Higher Low of the pattern. This is the very same pattern that emerged in the previous Cycle after the Growth Channel Up and took BTC to its new All Time High (ATH) at the time.
Both Growth Channels had a crash event below them, the previous Cycle even had a bubble event above it (Libra euphoria). But once the 1W MA50 (blue trend-line) turned into a Support after the Halving, the Bitcoin rally never looked back.
The 1W STOCH indicator, which is very similar to the past Cycle as well, shows that we might even be much earlier in the Cycle symmetrically than we think of. In any case the next two Higher Highs for the Rally Channel are $100k and $140k.
But what do you think? Are those Targets even plausible, let alone achievable by the end of Summer? Feel free to let us know in the comments section below!
-------------------------------------------------------------------------------
** Please LIKE 👍, FOLLOW ✅, SHARE 🙌 and COMMENT ✍ if you enjoy this idea! Also share your ideas and charts in the comments section below! This is best way to keep it relevant, support us, keep the content here free and allow the idea to reach as many people as possible. **
-------------------------------------------------------------------------------
💸💸💸💸💸💸
👇 👇 👇 👇 👇 👇

USDT Dominance just failed and doing BTC a huge favor!On this chart we see a major development on the USDT Dominance (USDT.D). It formed its first ever Death Cross on the 5D time-frame, with the MA200 (orange trend-line) turning into Resistance since the start of February.
That has never happened in its history and as you can see, when USDT.D declines, Bitcoin (black trend-line) rallies, which has been doing so aggressively since early October 2023.
This is a sign that the current rally on BTCUSD might be far from over and if anything can even be much more aggressively than we initially thought.
-------------------------------------------------------------------------------
** Please LIKE 👍, FOLLOW ✅, SHARE 🙌 and COMMENT ✍ if you enjoy this idea! Also share your ideas and charts in the comments section below! This is best way to keep it relevant, support us, keep the content here free and allow the idea to reach as many people as possible. **
-------------------------------------------------------------------------------
💸💸💸💸💸💸
👇 👇 👇 👇 👇 👇

XRPUSDT → Ripple prepares for 70% growth ↑BINANCE:XRPUSDT is forming a technical false break of support, in the long term consolidation above the zone should be formed with the purpose of continuation of growth, the potential of which can be opened by 50-70%
The price on W1 is squeezed within the triangle. Another attempt to retest the resistance zone is being formed. At the moment, the market is restrained from strong growth by the proceedings between the SEC and XRP. Ripple recently announced that they are willing to pay a $10 million fine instead of $2 billion, while two strong lawyers are resigning from the SEC. The upside potential will be a price consolidation above the 0.500 area and on a breakout of 0.73.
Support levels: 0.5000, 0.4226
Resistance levels: 0.6431, 0.7325, 0.8547
If the legal nuances are closed soon, a new bullish time will come for XRP and Ripple will start to conquer new peaks.
Regards R. Linda!

Bitcoin: Watch For Pullback 60K.Bitcoin has retraced off the 56,400 area support (level has been on this chart for months), straight back to 64K. The arrows on the chart point to the consecutive lows that characterize a failed low pattern. This brings price to a tricky area for new swing trades. The 64K area is a resistance and NOT an ideal spot for new longs on this time frame. In this scenario I am waiting for the retrace (see illustration) back to 60K support to look for swing trade long signals.
In fact my system (Trade Scanner Pro) is showing a long at the current price on this time frame, but the risk is enormous (like 7K points). This is where having a good grasp of context can help to filter out such low probability signals. Identifying RELEVANT support/resistance levels in advance provides a way to ANTICIPATE price behavior and offers an effective reference point to expect signals. Not to mention the boost of confidence that comes from the preparedness when the signals appears.
It is also important to understand that when using conventional methods to evaluate ANY market, the random nature will most likely lead to a 50% probability of being right. Most traders (especially beginners) place heavy emphasis on being right (high win rate) and do not realize that is the equivalent of expecting a high win rate from a slot machine. Slot machines are 100% random (in theory anyway) while the market is not because markets trend. This means there is a chance to beat the market BUT it requires strong knowledge of inefficiencies and typical trader behavioral patterns (not common tools like RSI).
I mention this because the illustrations on my chart that represent the scenario that I am anticipating for the coming week are not always right and nor do I expect them to be. These are not forecasts, these are ideal patterns that I would like to see in order to confirm some kind of action or decision. It is basically a big IF. I have no clue where the markets are going, instead I come up with an estimate based on recent history and then ADJUST to what the market actually chooses to do from there. ADJUSTING is KEY.
The sooner you accept this idea, the sooner you will begin to appreciate high value market information vs. the 99% of nonsense that most traders consume (too much internet!). Less is MORE in this game simply because most of what is publicly available does NOT improve your chances of positive outcome over time.
Thank you for considering my analysis and perspective.

BITCOIN Falling Resistance Ahead! Sell!
Hello,Traders!
BITCOIN is going up now
But a falling resistance
Is ahead so after the retest
A local bearish correction
Is to be expected
Sell!
Like, comment and subscribe to help us grow!
Check out other forecasts below too!

✅BITCOIN WILL GO DOWN|SHORT🔥
✅BITCOIN broke the key
Horizontal level of 61k$
So we are bearish biased
Now and as the pair is
Making a bullish correction
We will be waiting for the
Retest of the broken level
Which is a resistance now
From where we will be
Expecting a further
Move down
SHORT🔥
✅Like and subscribe to never miss a new idea!✅

Update on BitcoinThis is an update to my previous Bitcoin short idea. Price reached above 50% of the range which means it has reached the minimum premium for shorts being viable. I will monitor price action in the current Daily Order Block and see if we move lower from here. There is a resistance trendline with Buyside liquidity so we may still reach higher into the zone from my previous analysis and sweep buyside before moving lower. Only time will tell.

BITCOIN Bottom of the 6-month Megaphone. Will it hold?Bitcoin (BTCUSD) almost tested the Higher Lows trend-line that started on the October 12 2023 Low, which is technically the bottom of the 6-month Bullish Megaphone pattern. Having a notable Resistance on the 1D MA50 (red trend-line), which is where BTC last failed to make its bullish break-out, if this level holds, then we can expect a strong Bullish Leg such as those of February - March 2024 and October - December 2023 (blue ellipses).
As you can see, each Higher High on the Megaphone pattern has been proportionally higher, the first hit the 2.0 Fibonacci extension, the second hit the 2.618 Fibonacci extension, which is natural for Megaphones. As a result, if the pattern continues, reaching the all important psychological target of $100000 seems more than plausible as it sits just above the 2.0 Fib extension, where based on the pattern it can even reach the 3.0 Fib (127k).
But what do you think? Will the Megaphone's bottom hold and push BTC to 100k? Feel free to let us know in the comments section below!
-------------------------------------------------------------------------------
** Please LIKE 👍, FOLLOW ✅, SHARE 🙌 and COMMENT ✍ if you enjoy this idea! Also share your ideas and charts in the comments section below! This is best way to keep it relevant, support us, keep the content here free and allow the idea to reach as many people as possible. **
-------------------------------------------------------------------------------
💸💸💸💸💸💸
👇 👇 👇 👇 👇 👇

Bitcoin Bearish BreakdownThe recent analysis of Bitcoin's price dynamics on the Binance exchange, captured on a 4-hour chart, indicates a significant bearish trend. The price has notably broken below a dynamic support within a descending channel, punctuating a swift decline in market value. This descent is further emphasized by a failure to hold above the support around the 51K area, which was a previous gap level, suggesting a robust bearish sentiment in the market.
Bollinger Bands show the price nearing the lower band, typically a marker of an oversold condition which could either predict a continuation of the current trend or signal a potential reversal if the market perceives it as too severe a drop.
Trading Volume at 18.4K BTC highlights active participation, giving weight to the price movement. High volume accompanying a price drop usually confirms the market's commitment to the current downward trend.
Simple Moving Average (SMA) positioned at 60480, with the price trading below this level, suggests a bearish outlook as it indicates that current prices are less than recent averages, pointing to declining market momentum.
Stochastic Oscillator values (%K at 15.44 and %D at 13.24) below 20 indicate an oversold market condition, which might lead to a temporary rebound or continued selling if the bearish pressure persists.
Relative Strength Index (RSI) at 28 also signals that Bitcoin is currently oversold, providing a potential for price stabilization or a minor recovery, depending on broader market sentiment.
MACD further validates the downward momentum, with both the MACD line and the signal line deep in negative territory, emphasizing the strong bearish momentum in the market.
This analysis underscores a phase of strong selling pressure characterized by the breakdown of key support levels amid significant trading volume and bearish indicators from both RSI and MACD. The current market scenario suggests cautiousness among traders and investors, with potential opportunities for those looking to capitalize on lower prices, should a reversal occur.
However, the prevailing market sentiment remains heavily bearished, advising vigilance and readiness for possible continued downward movements.

BITCOIN Sellers seem fully confident again. TIME TO BUY?Bitcoin (BTCUSD) hit and broke yesterday below the 1D MA100 (red trend-line) for the first time in more than 3 months (since January 23 2024). This is progressively turning the majority of news and traders across the market bearish and in full confidence of shorting to even lower prices. Should long-term investors panic?
The answer appears to be 'No' and in fact if anything, this is the time to add more quarterly buy positions. The reason is shown on this 1W chart. Compared to the 2014/ 2017 Cycle, Bitcoin has formed the exact Bull Flag that is currently in 5 times until its eventual top. Each time the Flag bottomed after breaking the 1D MA100 but never touched the 1W MA50 (blue trend-line) until the end of the Bull Cycle. Of course the (green) Ichimoku Cloud also supported below all the way to the top.
It is interesting to also notice the 1W RSI sequence between the two Cycles. Both started with a Channel Up, which in the case of 2014/ 2017 it evolved into a Rectangle for the 2nd part of the Bull Cycle, with the price ranging from ovebrought (85.00 - 90.00) to borderline neutral (55.00). Currently the RSI is attempting to breach the Channel Up, thus flashing resemblances with the March 13-20 2017.
But what do you think? Is this the time to buy BTC again on a Bull Cycle basis or the narrative will be broken and it will test the 1W MA50? Feel free to let us know in the comments section below!
-------------------------------------------------------------------------------
** Please LIKE 👍, FOLLOW ✅, SHARE 🙌 and COMMENT ✍ if you enjoy this idea! Also share your ideas and charts in the comments section below! This is best way to keep it relevant, support us, keep the content here free and allow the idea to reach as many people as possible. **
-------------------------------------------------------------------------------
💸💸💸💸💸💸
👇 👇 👇 👇 👇 👇

✅BITCOIN LONG FROM SUPPORT🚀
✅BITCOIN is going down now
But a strong support level is ahead at 60k$
Thus I am expecting a rebound
And a move up towards the target at 64.2k$
LONG🚀
✅Like and subscribe to never miss a new idea!✅

BITCOIN Bollinger Squeeze attracting Bulls for 100k and above!Bitcoin (BTCUSD) is about to test the bottom of the Bollinger Bands (BB) on the 3D time-frame for the first time in 3 months (since January 25). Right now the squeeze between the BB basis (blue line) and the bottom (green line) is extremely tight and since the start of 2023 this has been fairly accurate bottom call.
The trend since the November 2022 bottom has been parabolic (green parabola) and thus is most efficiently displayed by the use of the Fibonacci Channel extension levels. After breaking above the 1.0 Fib on the February 12 2024 candle, the recent All Time High (ATH) in mid March 2024 broke even above the 1.5 Fib. Technically on the new Bullish Leg that is about to start after the current squeeze attracts as many buyers as possible, we should reach at least (most likely even break it) the 2.0 Fib.
$110000 is a very realistic target under these conditions and we shouldn't neglect to mention also the BB Width (BBW) consolidating on its bottom, which again is related to high bullish activity and accumulation when performed on the BB green line.
But what do you think? Is this squeeze about to make bulls accumulate and break aggressively to the upside? Feel free to let us know in the comments section below!
-------------------------------------------------------------------------------
** Please LIKE 👍, FOLLOW ✅, SHARE 🙌 and COMMENT ✍ if you enjoy this idea! Also share your ideas and charts in the comments section below! This is best way to keep it relevant, support us, keep the content here free and allow the idea to reach as many people as possible. **
-------------------------------------------------------------------------------
💸💸💸💸💸💸
👇 👇 👇 👇 👇 👇

Bitcoin: 60K Test Or Higher Low?Bitcoin has retraced but not back to the 60K major support which I wrote about in my previous article. Instead, it is in the process of establishing a higher low along with a bullish pin bar (see arrow). The current candle has taken out the high of the pin bar which can be interpreted as a signal for a swing trade long. IF momentum takes hold, it is within reason for price to test the 69K area resistance in the coming week (see illustration on chart). The key to capturing such a move is to WAIT for the current candle to close to effectively measure risk.
What IF the current candle does not follow through? That scenario can be interpreted as a continuation of the corrective structure means the 60K support test is still possible. As I regularly remind my followers, this is NOT a game of forecasting the future, it is about identifying possibilities and WAITING for the market to confirm which path IT wants to take. Markets are HIGHLY random which means scenarios on both sides of the market should always be considered.
In terms of the bigger picture, as long as price stays above 60K, it maintains a broader bullish consolidation. This price structure serves as a higher low which means there is a greater probability of a higher high to follow in the coming months (break of 73K?). A greater chance does NOT equate to a guarantee or a high degree of certainty. This is why RISK must always be measured carefully.
How do we define risk? Using the current bullish setup as an example, one way to measure risk is to consider the pin bar low at 62,405. IF price takes this out and closes below it, the swing trade long idea is cancelled out. IF you are long from the 63,905 entry (pin bar high) then you are looking at approximately 1500 points of risk. You then have to consider this amount relative to your account size. For example if you have a 10K account, and you buy the equivalent of 1 coin, you are looking at 15% risk which is TOO HIGH for one trade. Typical risk should be around 2% per trade which means you should be risking ONLY $200 on 10K. You have to adjust your position size so that if you get stopped out at 1500 points, you only lose $200. Which for this example would be something like .125 of a coin.
Risk can be gauged on many magnitudes and another thing to keep in mind is the risk on the monthly time frame. IF the 60K range low breaks some time next month for example that can signal a broader correction is likely to follow. Such a move can lead to a test of the low 50Ks which would be more attractive levels for investing. Again this is NOT something to "think" is going to happen, the market NEEDS to prove itself one way or the other. This time frame expresses a TON of risk for those who are investing heavily at current levels.
When we first enter this game, we usually come with a lot of preconceived notions, "logic" and warped expectations as a result of consuming too much internet propaganda. When your emotions mix with this misinformation it is a recipe for the herd mentality. When you react to everything you see and hear, you are being motivated by greed and fear which means your outcomes will be no better than random. To start on the right path, tune out everything else and focus on learning how to assess RISK using technical analysis. If anything you will at least improve your ability to preserve your capital for when better opportunities appear.
Thank you for considering my analysis and perspective.

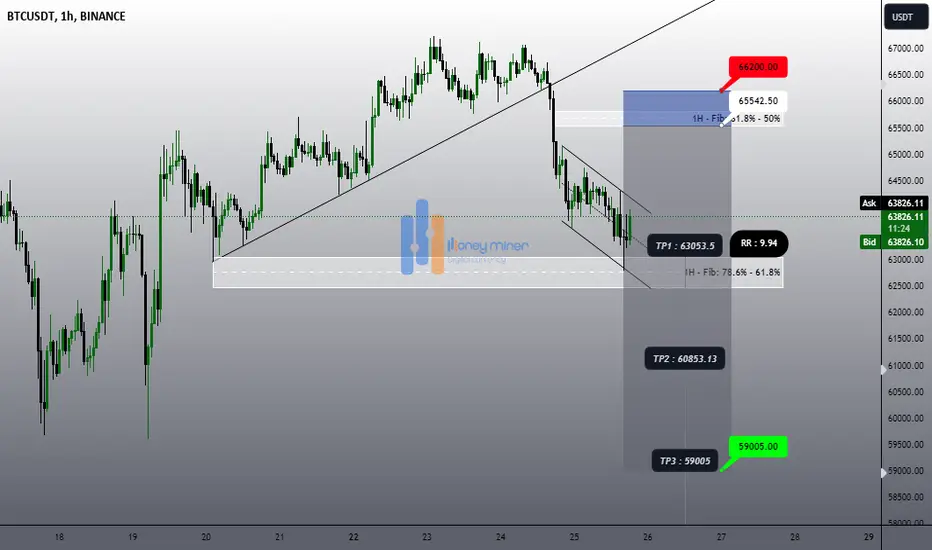
BTCUSDTBitcoin analysis in 1 hour time frame
Based on the analysis, Bitcoin can be expected to pull back to the breakout zone and continue to fall.