BITCOIN hit 70k! Can a 60k pull-back deliver 100k in 3 months?Bitcoin (BTCUSD) broke the $70000 psychological barrier today, smashing yet again a benchmark level during this Bull Cycle and on a momentum basis, it does not give any signs of stopping. However based on the 2020 post-COVID crash fractal, which started after the 1D MA50 (blue trend-line) crossed above the 1W MA50 (red trend-line), and that BTC has been following on an almost identical trade for the past 1 year (since March 2020), the price may experience a short-term pull-back at this stage.
If the fractal continues to play out, then a $60000 correction towards the end of the month, may come as a technical necessity is Bitcoin is to see a new High as we get closer to April's Halving. As you can see, even the 1D RSI sequences between the two fractals are quite similar. Based on that fractal we may even see Bitcoin at $100000 as early as June!
Do you agree with that? Feel free to let us know in the comments section below!
-------------------------------------------------------------------------------
** Please LIKE 👍, FOLLOW ✅, SHARE 🙌 and COMMENT ✍ if you enjoy this idea! Also share your ideas and charts in the comments section below! This is best way to keep it relevant, support us, keep the content here free and allow the idea to reach as many people as possible. **
-------------------------------------------------------------------------------
💸💸💸💸💸💸
👇 👇 👇 👇 👇 👇
Bitcoin-btcusd-btc

Bitcoin in accumulation phase since last channel cross⭐️🚨🚨🚨Bitcoin in accumulation phase since last channel cross⭐️🚨🚨🚨
We stay in this phase until BTC closes above the channel and the pre-bull run begins
Like & Follow if you are accumulating dear Crypto Nation🤗
Let me know your thoughts in the comments🤗
⬇️⬇️⬇️
Disclaimer:
Not financial advice
Do your own research before investing
The content shared is for educational purposes only and is my personal opinion

BITCOIN What is next narrative it will break?Since th 2021 Bear Cycle started, Bitcoin (BTCUSD) entered a phase that few could have predicted. You can very easily even call it the 'Cycle of Narrative Destruction' as since the June 13 2022 break below the previous All Time High (ATH), Bitcoin started breaking narratives that have been well established throughout its history and few thought could break.
** Five major narrative breaks so far **
Starting from the very first narrative destruction on the week of June 13 2022 (we are viewing this chart on the 1W time-frame), Bitcoin managed to break below the previous ATH (19350) for the first every in its history. Then a few months later in November 2022 in the aftermath of the FTX crash, it broke below the 1W MA300 (red trend-line) also for the first time ever. This resulted into the first ever 1W Death Cross around February 2023 and following the recovery during 2023, it naturally formed the first ever 1W Golden Cross around the last week of December first week of January 2024. The most recent narrative that BTC has destroyed was this week as it made a new ATH marginally above $69000, which was the first time it did so before the Cycle's Halving (which is due in mid April 2024).
** Which narrative is next to break? **
As you can see, those are 5 major narrative breaks in the span of 18 months. So what narrative will BTC break next? The first that comes to our mind as the market is rising that fast this high, is the Theory of Diminishing Returns (TODR). This theory implies (and has been correct so far) that each Cycle delivers lower returns than the previous. As you see on the charts, the first Cycle gave +531681% returns, the next one +62325%, then +11808% and the most recent +2051%.
** So 330k is realistic?? **
If this narrative is to break, it means that BTC would need to make a little over +2051% during the current Cycle. That suggests that we can be looking at a Cycle peak above $330000! Of course if that happens, it would mean that Bitcoin will also break above its historic Parabolic Growth Channel, which can be considered another narrative destruction.
But what do you think? Can the Theory of Diminishing Returns be the next narrative to break and if not, which one do you think it will be? Feel free to let us know in the comments section below!
-------------------------------------------------------------------------------
** Please LIKE 👍, FOLLOW ✅, SHARE 🙌 and COMMENT ✍ if you enjoy this idea! Also share your ideas and charts in the comments section below! This is best way to keep it relevant, support us, keep the content here free and allow the idea to reach as many people as possible. **
-------------------------------------------------------------------------------
💸💸💸💸💸💸
👇 👇 👇 👇 👇 👇

BITCOIN Perfect symmetry shows $170k!This chart on the 1W time-frame shows how symmetric Bitcoin's price action has been before and after the March 2020 COVID crash with the price action has been before and after the November 2022 FTX crash.
Both within the long-term structure of a Channel Up, the bottomed below the 1W MA200 (orange trend-line), turned a Resistance into Support when the rally really took off, while the 1W RSI was ascending on a Channel Up.
Within this nearly 7 year Channel Up, BTC made its two Higher Highs peaks after a +1000% rally, which indicates that is the standard for the pattern. A repeat of a +1000% rise from the November 2022 bottom gives us a projected peak around $170000!
How realistic do you think that is? Do you agree with that model? Feel free to let us know in the comments section below!
-------------------------------------------------------------------------------
** Please LIKE 👍, FOLLOW ✅, SHARE 🙌 and COMMENT ✍ if you enjoy this idea! Also share your ideas and charts in the comments section below! This is best way to keep it relevant, support us, keep the content here free and allow the idea to reach as many people as possible. **
-------------------------------------------------------------------------------
💸💸💸💸💸💸
👇 👇 👇 👇 👇 👇

Bitcoin: 5th Wave Completion?Bitcoin has rallied over 10K points from the 52K break out level that I wrote about in my previous article and refuses to deliver a meaningful pullback. In situations like this, you must not give in the the hype and fear of missing out. I see talk of 100K, etc. and all the video titles popping up on my feeds. What you should be focused on is how to best participate in this while acknowledging the magnitude of risk that comes along with it (no one talks about the risk).
My chart now shows the label Wave 5?. Clearly 5 waves can be counted which makes this the 5th of a 5th wave. Within this 5th wave, there appears to be 4 subwaves which implies one more leg higher (see higher low consolidation between 60,300 and 63,500). This next bullish leg can test the 64,500 resistance or even the 69K all time high. This is also where MOST retail traders will think this market looks the greatest, and has the most potential, especially when the herd mentality hype machine pushes this idea. In reality, the opposite is true.
What most traders do not realize is that corrective structures tend to follow 5th waves. In this case, it would be a broader corrective move that points to the potential scenario of price testing the 50K or even 40K level. This is NOT a forecast, this is the potential RISK that no one it talking about. Such a bearish scenario can take weeks or months to unfold so it is no something to expect tomorrow.
Many traders are frustrated because they missed the home run, and they are not sure how to go about participating in this. Here is my suggestion: day trades only, long side only. Look for a pullback or break out on smaller time frames like 30 minute. For example, right now, the 63,500 range high is the next break out resistance. If price pushes through, that can qualify as an aggressive long day trade with the expectations of testing the 64K area. Expecting more puts you at greater risk of getting caught in a broader retrace.
The ones who will get caught in this are the ones who believe whatever they are told. While anything is possible, it is the potential risk that will eventually be realized. All those who bought at 50K now "feel good" because the market has reinforced this high risk behavior. When the broader correction unfolds, it is these same people who get stuck because they are caught between greed and the fear of missing out. Broader corrective moves begin OUT OF NOWHERE. Usually coincides with some unexpected news. Do you remember what turned this market around the first time at 69K?
Markets tend to move in cycles NOT in straight lines. Growth is followed by corrections, but there is no way to know how long or how far each cycle will persist. What we can measure is the potential risk, and that is what the basis of your judgement should be, NOT "100K is next!" because Bozo the Youtuber said so. In these situations it is more effective to take profits at highs, trade smaller and on lower time frames and expect LESS. Things always look the greatest at the top.
Thank you for considering my analysis and perspective.

Bitcoin vs M1SL 1Week ChartThis chart compares the Bitcoin chart to the St Louis Fred. A very different view of what Bitcoin could do next if this neckline breaks. Will be watching these fib extension levels overhead and add more cycles as I see fit.

BITCOIN Today's monthly closing can start a rally to $81000!Bitcoin (BTCUSD) is closing the monthly (1M) candle today and to the surprise of most, it is near the November 2021 All Time High (ATH). In fact it is exactly at the level where the ATH monthly candle (Nov 2021) made its closing. As a result if the month of February closes today above it, we will have a new ATH monthly closing!
** The importance of the monthly closing **
Why is that so important? Because every time in history BTC closed a 1M candle above the closing of the previous ATH candle closing, it started the Parabolic Rally Phase of the Bull Cycle and never looked back until the Cycle top. This is a key level as there were 2 times it got tested but as the 1M candle didn't close above the previous ATH candle closing (August 2012 and June 2019), the price got rejected and took numerous more months before the next test and eventual break-out.
** The 1M RSI and Fib bands **
It is important to highlight that on the tests that were successful and made a new 1M candle close above the previous ATH candle closing, the 1M RSI was overbought above 70.00 (blue circle and arrow), while the 2 times it failed, the RSI was below 70.00. Also during those successful tests, the 1M candle was recently detached from the Fib MA Multiple 3 (blue trend-line) and in reached Multiple 5 (yellow trend-line) within the next 2 months maximum.
** What's next if successful? **
This indicates that if today's monthly candle closes above our critical level, we should see $81000 by April! And if you want to make a rough estimate of the top of the Cycle, it should be at or marginally below Multiple 7 (red trend-line) with a fair projection being $150000. You should also consider to start profit taking once the 1M RSI approaches its historic Lower Highs trend-line, which has timed the pricings of all Cycle tops. And with the exception of the last one, that was on a Double Top on the Lower Highs.
But what do you think? Will Bitcoin makes a closing above the ATH 1M candle closing today and if so, will it hit 81k by April? Feel free to let us know in the comments section below!
-------------------------------------------------------------------------------
** Please LIKE 👍, FOLLOW ✅, SHARE 🙌 and COMMENT ✍ if you enjoy this idea! Also share your ideas and charts in the comments section below! This is best way to keep it relevant, support us, keep the content here free and allow the idea to reach as many people as possible. **
-------------------------------------------------------------------------------
💸💸💸💸💸💸
👇 👇 👇 👇 👇 👇

Bullish Sign For Bitcoin!Bitcoin technical analysis update (Weekly Chart)
Bitcoin's weekly RSI falling from the last 2 years, In December 2020 weekly RSI touched 95 overbought levels, at the time BTC was trading at $42000 after that RSI started falling.
In the above chart, you can see Bitcoin 2 year-long Weekly RSI breakout above its trend resistance line, this is a good bullish sign for bitcoin.
Thanks
Hexa

BITCOIN, Massive Broadening Wedge, Targets Active + ETF Volume.Hello There!
Welcome to my new analysis of BITCOIN in the daily timeframe perspective. The current bull run is still holding on and BITCOIN does not back off and is printing one hew high after the other. This uptrend is backed by real events that support the bullish case such as the Bitcoin ETFs release which is the preliminary fundament of new and fresh volume moving into the whole cryptocurrency market.
When considering the developing dynamics in my technical chart perspective now it has to be pointed out that BITCOIN since it bounced several times within the 50-EMA established the ability to form this gigantic broadening wedge formation. Recently BITCOIN formed the crucial breakout above the upper boundary of the formation above which it is now developing a main bullish triangle continuation formation.
There is also a major wave count ongoing which is supporting the broadening wedge development as the major waves A and B already formed the fundament of the broadening wedge BITCOIN is now continuing to form the wave C simultaneously with the bullish expansion wave. What is also an important factor that is stabilizing the bullish trend here is the horizontal support marked in orange.
Taking all these factors into consideration the most meaningful insight here is that BITCOIN now activated the main target zones with the initial target zone to be reached once the bullish continuation triangle has completed with the continued extensive bullish breakouts. Once the initial target zone has been reached and the bullish BTC ETF volume is holding on together with bullish technicals the final target zone will be reached.
Thank you everybody for watching my idea about BITCOIN! Support is greatly appreciated.
VP

BITCOIN Is it about to 'Ride the Bollinger Wave'?Bitcoin (BTCUSD) is on the 3rd straight month that the 1M candle has touched the top of the Bollinger Bands (BB). At the same time the Bollinger Bands Width (BBW) is on the rise while the 1M MACD is well past its Bullish Cross.
When all those three catalysts took place together in the past, BTC has extended the rally on top of the BB, which is something we historically call 'Riding the Bollinger Wave'. Technically this should give at most a 2-month pull-back, which would of course be a buy opportunity, until the Cycle tops.
Will you continue buying every pull-back without fear? Feel free to let us know in the comments section below!
-------------------------------------------------------------------------------
** Please LIKE 👍, FOLLOW ✅, SHARE 🙌 and COMMENT ✍ if you enjoy this idea! Also share your ideas and charts in the comments section below! This is best way to keep it relevant, support us, keep the content here free and allow the idea to reach as many people as possible. **
-------------------------------------------------------------------------------
💸💸💸💸💸💸
👇 👇 👇 👇 👇 👇

Bitcoin: 52K Break Out Starts Wave 5?Bitcoin continues to find support around the 50,500 area. This is particularly important for intraday strategies. The consolidation that Bitcoin is within is still part of what looks like a Wave 4 configuration. This wave can expand to 48K and even lower and still maintain the integrity of the broader bullish impulse structure. The idea here is to look for trade signals that align with this structure, can capture at least of portion of the next leg higher which can potentially test the 56K area.
Not much has changed on the bigger picture. The 48K area is still the next major support in play. The ideal swing trade scenario would be a test of 48K over the coming week followed by a bullish reversal pattern (see line illustration on chart). I have been describing this scenario for some weeks now and the market simply does not deliver this opportunity.
Keep in mind there is no guarantee the market will present this pull back scenario, AND it is also possible for 48K to break while still maintaining a broader bullish structure. As long as Wave 4 does not overlap Wave 1, it would be reasonable to consider longs on the bigger picture.
It is important to WAIT for the setup, especially when it comes to a swing trade. What if 48K is never touched and 50K holds? Then the event to watch for is the bullish break out of 52K. Such a move can lead to a test of the 56K area or higher IF momentum persists. This is what I am considering to be the Wave 5. As I have pointed out many times, once this wave completes, a broader corrective wave is likely to follow and risk on the long side increases dramatically.
All you need to make adequate decisions are just a few essential elements that paint a realistic picture based on price. Trend, support/resistance, candlestick and price patterns draw from recent price history and provide a routine way to gauge potential movements in the near future. These elements can be evaluated on any time frame, and can serve investors as well as day traders alike.
Over complicating analysis is a common mistake which is often part of a larger problem: most traders/investors are unable to think beyond the limitations of their own human nature. This is precisely why the herd mentality exists and offers opportunities to those who recognize it in themselves and others.
Thank you for considering my analysis and perspective.

Pi Cycle Indicates The Bottom of Bitcoin.Pi cycle indicator has shown a bottom signal in July month, that’s the third time in the history of bitcoin.
This indicator accurately predicted the 2015 and 2018 bitcoin bottom.
If this indicator works for the third time then we are at the bottom of the bitcoin bear cycle.
Thanks
Hexa

BITCOIN just made the most important 1W closing of this Cycle!Bitcoin (BTCUSD) made last week a closing that is going under the radar by the market. The closing of the last 1W candle was made above the 0.786 Fibonacci retracement level from the November 2021 All Time High (ATH). But why is that of such a significant value? Because every time in BTC's history it closed a 1W candle above the 0.786 Fib of the ATH, the price never closed below it again.
In fact we can claim that for every past Cycle, such a 1W closing is the final confirmation for the start of the Parabolic Rally. It has to be noted that after such closing, Bitcoin made new ATH in maximum 2 months! That suggests we could see a new Historic High at the time of the Halving! Are just starting the new rally?
Feel free to let us know in the comments section below!
-------------------------------------------------------------------------------
** Please LIKE 👍, FOLLOW ✅, SHARE 🙌 and COMMENT ✍ if you enjoy this idea! Also share your ideas and charts in the comments section below! This is best way to keep it relevant, support us, keep the content here free and allow the idea to reach as many people as possible. **
-------------------------------------------------------------------------------
💸💸💸💸💸💸
👇 👇 👇 👇 👇 👇

Bitcoin: 52K High New Wave Count.Bitcoin has pushed the 50K resistance area and peaked in the 52Ks. The recent bearish pin bar has signaled a swing trade short which is not following through (no surprise there). Over the coming week it is within reason to see a retest of the 48K area support. This is the price location where a high probability swing trade long setup can appear and where I am preparing for a signal.
In my previous articles, you will notice that I had a "B?" in the 46 to 48K resistance area. That was what I was waiting for the market to confirm, but the market never confirmed. We got a resistance break and run to 52K instead. A move like this calls for a new wave count which you can see on my chart now.
This illustrates an important point: you cannot get married to wave counts because the market does whatever IT wants to do. One drawback to wave counts is you have to relabel after the fact. They only serve as a basic guide that the market will either confirm or NOT.
The new wave count presents an impulse wave with 3 legs complete, with a potential 4th wave developing. This implies there is one more wave higher which can lead price into the 55K or 60K areas over the next few weeks (IF it follows through). This impulse would actually be the 5th wave (which I thought was completed at the previous test of 50K). This also means once 5 waves are complete, the probability of a broader corrective wave to follow becomes greater.
At this point, the plan is simple: WAIT for retrace to 48K area support and look for buy signal on larger time frames. IF this opportunity unfolds I will point it out to my members along with the other parameters such as stop and take profit prices.
The broader Wave C (monthly) that I have been pointing out in recent articles is also a LOW probability scenario unless or until the 40K support is broken. Again the key to this game is knowing how to adjust to new information, NOT getting stuck on opinions. The market changes and we must change our expectations with it if you want to be aligned with the probabilities.
Thank you for considering my analysis and perspective.

BITCOIN $BTCUSD - Nov. 20th, 2023BUY/LONG ZONE (GREEN): $35550 - $49240
DO NOT TRADE/DNT ZONE (WHITE): $30320 - $35550
No sell/short zone shown.
The market has a clear bullish sentiment and I would not look to enter shorts here. I've drawn the levels and zones (from the daily and weekly frames) that I would look towards when entering. Price reaction to these areas would be significant in determining the trend. Recently BTC has shown strong bullish momentum in respect to the most recent level/zone break. The current test on the next level is the third one in less than two weeks. Although there is resistance to the level, there have been no large structural breakdowns and entering into the third test we see support on the 4H level combined with an ascending triangle.
This is what I would personally look at before entering trades, everything is subject to change on a daily basis and as I analyze different timeframes and ideas.
ENTERTAINMENT PURPOSES ONLY, NOT FINANCIAL ADVICE!

Update: BTC near Golden Crosses & ResistanceBitcoin is very near golden crosses of its 50/200 MA (dotted lines) and EMA (solid). It is also just below resistance.
If it is going to get a re-test near wedge top, where it broke out (green wedge), or near the 50 MA or EMA, it'll happen soon.
It could just run to ~26 and ~30k, get those golden crosses, get above resistance and head towards double-top targets, but a re=test near top of wedge could lead to an inverted head/shoulders formation that would give us higher targets above resistance, near ~33-37k and provide a new buying opportunity that takes us closer to next halving and lead to a higher high, possibly even a new ATH.
Inverted HS might look something like this:
Related chart ideas linked below.

BITCOIN to 40k or 69k?Bitcoin (BTCUSD) has been trading within a long-term Channel Up pattern since the November 21 2022 market bottom. The price broke today above the psychological level of $50000 and is about to touch that very top (Higher Highs trend-line) of the Channel Up.
As the 1D RSI broke above its 4-month Lower Highs trend-line and is largely overbought near 80.00, this technically resembles the same break-out of June 23 2023. As a result, as long as the 1D candles close within the Channel Up, BTC could pull-back to a 'fair' value near $40000 and the 1D MA200 (orange trend-line) above the 0.382 Fibonacci retracement level. Time-wise it would be ideal to reach that level before April's Halving and start attracting long-term buying interest then.
If however a 1D or even better, a 1W candle closes above the Channel Up, we will turn again largely bullish on the medium-term break-out as we can see an price action resembling the short-term Channel Up that started on October 24 2023 that paved the way for the December 08 2023 High. That High was on a +79.77% rise from the September 11 2023 Low, the last technical Higher Low of the Channel Up. A new +79.77% run from the recent January 23 2024 Low would peak marginally above $69000, which in that case will be our Target.
Which scenario do you think is more likely to prevail now? 40k or 69k? Feel free to let us know in the comments section below!
-------------------------------------------------------------------------------
** Please LIKE 👍, FOLLOW ✅, SHARE 🙌 and COMMENT ✍ if you enjoy this idea! Also share your ideas and charts in the comments section below! This is best way to keep it relevant, support us, keep the content here free and allow the idea to reach as many people as possible. **
-------------------------------------------------------------------------------
💸💸💸💸💸💸
👇 👇 👇 👇 👇 👇

Bitcoin: Elevated Risk For Longs.Bitcoin is now pushing into the 50K AREA resistance zone while presenting a potential momentum continuation pattern (inside bar). A break of the inside bar high can lead to a test of 50K and possibly higher. The zone between 50 and 51K (blue rectangle on chart) is a high probability bearish reversal zone which means unattractive place for new longs, especially for larger time frame investors.
Strategies that make the most sense in terms of risk right now are day and swing trades with low expectations on the long side. Stop placing so much weight on what you can SEE, think more about what you CAN'T SEE which is the potential RISK. The further price stretches into the reversal zone, the greater the risk of reversal.
The blue line illustration on the chart is the scenario that I anticipate over the coming week or two. Again it is important to understand that markets are highly random and that there is NO way to know the future. The market can present us numerous scenarios and we want to be prepared for a narrow range of scenarios that are more likely to appear. The key to acting on this is CONFIRMATION from the price action.
Right now, all we have is an inside bar developing that is often a momentum continuation pattern. If the high is taken out, that is a signal to go long, BUT if the low is taken out, that could be the beginning of a broader retrace back to the 44, 45K area.
Also I wanted to mention that B waves (which this still might be), can produce a higher high while confusing many into thinking the market is breaking out. WATCH carefully for the fake out in this situation. It often looks like a bearish pin bar (judge only on the close).
My goal here is NOT to scare people out of participating, it is to make you AWARE of the risk. It is usually at these points where people can no longer handle the fear of missing out and buy the top. While there is never a "bad" time to invest, you can control the risk you take by knowing how to effectively categorize price points. I will cover this topic more during my Monday stream.
Thank you for considering my analysis and perspective.

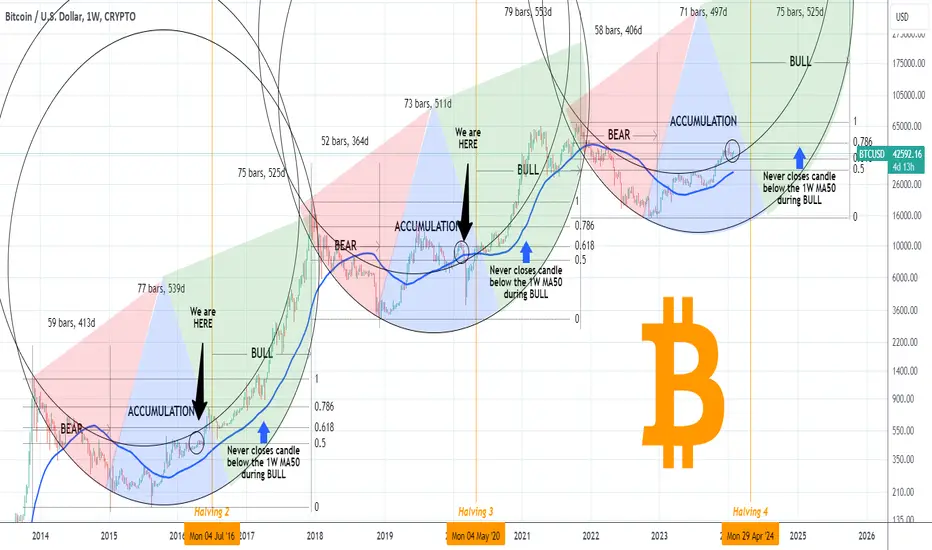
BITCOIN Cycle Phases like you've never seen them before!On today's post we are basically upgrading our previous analysis (see chart below) with the addition of actual circle shapes on Bitcoin's (BTCUSD) Cycles and pies on their phases:
As you can see this reveals a groundbreaking illustration of the historic Cycles. We don't want to get you in the technical details of the trend, you can find everything by clicking on our previous publication.
But as you can see, on top of the tradition measuring of the Cycle phases (Bear, Accumulation, Bull), we have place Wedges/ Pies that fit into the actual Circles. Those Circles (as well as the pies naturally) are all the same size/ symmetry, which just goes to show you how similar BTC's Cycles are despite the different news and fundamentals that take place during each Cycle.
We use a Double Circle pattern to demonstrate more vividly the Cycles. Most of BTC's price action tends to be within that Zone that is made, even the 2018 - 2021 Cycle, despite the notable divergencies during the Accumulation (Libra euphoria) and Bull (Musk, Tesla adoption) phases, it eventually fell back within the Channel.
The presentation also reveals Bitcoin's current position relative to the previous Cycles (black "We are HERE" arrow). That's near the end of the Accumulation Phase, only a few weeks before the Halving, above the 1W MA50 (blue trend-line) and within the 0.618 - 0.5 Fibonacci Zone. The upside is enormous and since the price is above the Circles Channel as during February 2020, who is to say we won't see another outperformance, especially if positive fundamentals hit the market (ETF approvals already, potential Rate Cuts, more news of adoption every day etc).
But what do you think? Is this Cycle presentation accurate and if so are you expecting a massive rally as we approach the Halving? Feel free to let us know in the comments section below!
-------------------------------------------------------------------------------
** Please LIKE 👍, FOLLOW ✅, SHARE 🙌 and COMMENT ✍ if you enjoy this idea! Also share your ideas and charts in the comments section below! This is best way to keep it relevant, support us, keep the content here free and allow the idea to reach as many people as possible. **
-------------------------------------------------------------------------------
💸💸💸💸💸💸
👇 👇 👇 👇 👇 👇
BTCUSD - More Bull?Suggesting a large continuation of the current up trend
I expect the market to perform well in the coming months/year with Bitcoin possibly going over 100K.
Very bullish from me.

Bitcoin: 40K In Play For Bounce.Bitcoin failed attempt to break 40K means the broader support area is still in play. While the broader resistance is 45K, the minor resistance is 42.5 which appears to be affecting price now. IF a bearish pin bar appears at this location, it increases the chances of a bearish retrace back into the 40.5K area. THIS is the scenario I am looking for in order to justify risk for a new swing trade long.
Upon a retest of 40K, if there is no confirmation, then I stand aside to see if there is a retest of 38.5 again. IF 38.5 breaks, then I stand aside because the broader trend at that point goes into question. As of now, the broader trend can still be argued as bullish. It is important to keep in mind that markets do not necessarily go from bullish to bearish, they can consolidate. As the market provides new information, arguments and expectations can be adjusted.
Assessing a market effectively requires evaluating smaller time frame information in light of larger time frame information. I am not trying to forecast the future (this is a typical retail mistake). I am gathering clues from recent price action in an attempt to narrow the range of possibilities that the market can present over the next week or two. From there it is up to the market to confirm or not which justifies if I can take risk or not. This is the passive mindset, which facilitates an open mind in contrast to jumping to conclusions or thinking in absolutes.
I also wanted to mention, do not lose sight of the monthly time frame. A break of 38.5 will add more weight to the monthly C Wave scenario that I have been describing for weeks. Realize that IF the market chooses this route, price will NOT move in a straight line. It will takes months to unfold and there will be many conflicting situations (bullish reversals) along the way. This is why it is essential to constantly gauge the levels in play and what to expect relative to the trend structure.
IF price manages to retrace back to 45K, I would not expect much more than that. This level is ideal to take profits. From there the market will have to continue to prove strength.
Traders and investors have many obstacles to deal with which they aren't even aware of. One such obstacle is the value of the information. Understand that if you consume the same information as everyone else, you have NO advantage which means your outcomes will most likely be random. Information is NOT just news reports, etc. Price itself offers much more value in the absence of inside information because it paints a picture of reality. You just have to learn how to interpret it.
Thank you for considering my analysis and perspective.

BITCOIN Every monthly pull-back is a BUY opportunity from now onOn this 1W analysis we see Bitcoin's (BTCUSD) amazing symmetry through its historic Cycles. A symmetry which upto this date, is holding and we will explain why right away.
Before we begin, note that the current study can be used in combination with our legendary Golden 51%-49% Ratio publications shown below:
** Three Cycle Phases **
Now as to the cyclical symmetry. The chart classifies each grand Cycle into three phases:
a) The Bear Phase (red), which starts at the top of the previous Cycle and ends on its bottom. The price breaks below the 1W MA50 during that phase.
b) The Accumulation Phase (blue), which continues where Bear left off and is when investors buy for the long-term following the market bottom. The price breaks above the 1W MA50 during that phase.
c) The Bull Phase (green), which starts after the Halving event (orange vertical line) and ends on the new Cycle top. The price never closes a 1W candle below the 1W MA50 during that phase.
** The Symmetry **
As you can realize just on first glance, the Phases along the Cycles are on an amazing symmetry. The Bear Phases has so far been 59 weeks (413 days), 52 weeks (364 days) and the most recent 58 weeks (406 days) respectively. The Accumulation Phases have been 77 weeks (539 days) and 73 weeks (511 days) respectively. The Bull Phases have been 75 weeks (525 days) and 79 weeks (553 days) respectively.
The current Accumulation Phase will be 71 weeks (497 days) by the time of the Halving, which is remarkably along the lines of the previous 2. As for the new Bull Phase after the Halving, we could assume a minimum duration of 75 weeks (525 days) as in 2016 - 2017.
** Fibonacci role on the Halving date **
The key at the moment as we approach the upcoming Halving in April, are the Fibonacci retracement levels. During the previous two Halvings, BTC had already reached the 0.786 Fib once and at the time of the Halving was around the 0.618 Fib, which is basically the current price levels within 39000-40000. The 1W MA50 is about to touch the 0.5 Fib level which is around 33000 and technically, based on this model, is as low as the correction can extend to.
Technically we should be expecting price levels around 40k as we enter April, which of course doesn't dismiss the possibility of another run to 50k earlier. In conclusion, assuming the 1W MA50 is the new long-term Support from now on, every monthly correction, should technically be a buy opportunity as we head into the Bull Phase.
But what do you think about this Cycle mapping? Do you expect history to continue to repeat itself? Feel free to let us know in the comments section below!
-------------------------------------------------------------------------------
** Please LIKE 👍, FOLLOW ✅, SHARE 🙌 and COMMENT ✍ if you enjoy this idea! Also share your ideas and charts in the comments section below! This is best way to keep it relevant, support us, keep the content here free and allow the idea to reach as many people as possible. **
-------------------------------------------------------------------------------
💸💸💸💸💸💸
👇 👇 👇 👇 👇 👇

BITCOIN Bearish Breakout! Sell!
Hello,Traders!
BITCOIN was trading along
The rising support line
But now we are seeing
A bearish breakout and
The breakout is confirmed
So I will be expecting
A further move down
Sell!
Like, comment and subscribe to help us grow!
Check out other forecasts below too!
