BITCOIN MACD bottom pattern shows when to Buy and when to Sell !Over the years we have discovered many historic patterns applicable to Bitcoin's (BTCUSD) Cycles. With a relative degree of volatility every time, since each Cycle has it's own distinct characteristics and fundamental events that shape it, those patterns can help traders/ investors construct strategies for buying and selling on a long-term scale.
This time we have come across a very unique pattern on the 1M time-frame, which can identify where to Buy and where to Sell, near the Tops and Bottoms respectively, on a Cyclical scale.
Starting from the November 2011 bottom onwards, each Cycle is measured at either 3.58 or 3.83 years to the point where the 1M MACD bottoms. The last MACD bottom and start of reversal was on February 2023, while BTC was trading around 23k on average. Still not as appealing as the November 2022 16000 but low enough to provide an excellent (and confirmed) long-term dip buy entry compared to the previous $69000 All Time High.
At the moment the price is on the 0.236 Fibonacci level of the current Cycle and as you can see on the chart, this is the level where BTC makes a 1-2 month pull-back. The Tops are priced either on the 0.5 or 0.618 Fibonacci levels. This means that long-term investors could take their profits either on January 2025 or July 2025, if the current Cycle lasts again 3.58 years. And as for the next bottom based on the model, it is expected on December 2026, where we can take a (relatively) confirmed buy position again for the long-term.
But what do you think about that MACD bottom model? Are you also expecting a new Cycle Top within January - July 2025? Feel free to let us know in the comments section below!
-------------------------------------------------------------------------------
** Please LIKE 👍, FOLLOW ✅, SHARE 🙌 and COMMENT ✍ if you enjoy this idea! Also share your ideas and charts in the comments section below! This is best way to keep it relevant, support us, keep the content here free and allow the idea to reach as many people as possible. **
-------------------------------------------------------------------------------
💸💸💸💸💸💸
👇 👇 👇 👇 👇 👇
Bitcoin-btcusd-btc

BITCOIN Will Go UP! Buy!
Hello,Traders!
BITCOIN is trading along
The rising support line
From where I think
There is a good chance
For us to see a bullish rebound
Buy!
Like, comment and subscribe to help us grow!
Check out other forecasts below too!

Bitcoin Bullish Continuation to 50kCRYPTOCAP:BTC price has been consolidating at highs as we await the imminent ETF approval announcement. At this point a bullish pennant pattern has formed and the daily bollinger bands have tightened, signalling that we will soon see volatility that triggers a breakout.
In terms of targets, the fib extension of the chart pattern says 47.3k to 49k. I am keeping in mind however that Bitcoin has never exceeded the 61.8% retracement of the previous drawdown pre-halving. Although the ETF approval announcement could make things different this time. If we exceed 50k, buckle up lads.

Is 2024 Set to Be the Toughest Year for the Crypto Market ?Technical Analysis:
Right now, the market's showing signs that might point to a 'cup and handle' pattern in the price charts. For those who aren't familiar, a cup and handle pattern looks a bit like a "U" with a slight dip at the end. Not to get too bogged down in details, but interestingly, in early January 2024, Bitcoin's price hit a ceiling around the same high it did back in March 2022, which was about $48,000.
From what I can see, it looks like Bitcoin might be on a bit of a downward trajectory in the short term. I'm thinking we might see the price retract to around the $30K-$34K area in the next few weeks, which could be a point where more buyers jump in. However, this is something we need to watch closely because that range might just turn out to be a support level.
If the price falls through that $30K-$34K range I mentioned, then I'm expecting it could drop even further, maybe hitting a new low (we could be talking as low as zero or around $10K).
News:
Switching gears to the news, there's something intriguing about the BRICS nations considering backing their currency with gold. My first reaction is, "Wow," because it's pretty common to want a currency backed by something as solid as gold. But the big question is how this move will affect the relationship between their currency and cryptocurrencies. If this really takes off, it could be a very tough year for the crypto market.
Summary:
For now, I'm just keeping an eye on the market's pulse and price movements. I haven't jumped into the market yet, but I'm patiently waiting for the right moment and Brics news.

Bitcoin: 40K Break Trend Change?Bitcoin rejects the 50K resistance area and goes from 49K to 41,500 over a two day period. If you have been following my analysis on here you should NOT be surprised. I have been highlighting the extreme risks above 46K in my articles AND my streams since the beginning of the month. Is this an adequate pullback to buy into? I will address that now.
The first question that we must consider is: has anything changed in terms of trend? From a technical perspective, NOT YET. The 40K support is still intact, and until this level is clearly compromised, it is still within reason to anticipate the overall support to hold. One thing to keep in mind though, there is a large red candle coming off a major resistance level and this means momentum is bearish. IF this momentum continues, 40K can break at which point a change in trend would be in play.
For this reason, BEFORE considering any swing trades on the long side, I will WAIT for a complex reversal pattern (see illustration on chart). This can appear in the form of a classic double bottom or failed low in the 40K AREA. A couple of green inside bars is NOT enough in this situation because of the recent surge in momentum. Typically inside bars in this configuration are often momentum continuation patterns which at the moment favors the bears.
In previous reports and streams I have specifically mentioned the relevance of the monthly time frame and potential of a bearish C wave developing. IF 40K breaks, this further confirms that argument. A bearish C wave can potentially lead to a test of 15K (this can take months to play out). It is important to be cognizant of this scenario particularly for investors who plan to dollar cost average into the next pullback. Don't make the mistake to getting too big too soon.
There is no way to know if 15K will be tested, maybe the bottom of C turns out to be 30K, or maybe Wave C never unfolds at all, and 40K holds. The point is, don't get married to any opinions bullish OR bearish. Avoid getting swept up into the nonsense machine (the internet). You only need a few components of information to make reasonable decisions. Start with having a repetitive way to identify trend and changes of trend, and second the same for KEY support and resistance levels. These two components alone can improve decision making because they help you align with market intent.
This game is NOT about "thinking" and being right. It is about ADJUSTING as the market processes new information. Unless you are ahead of the information curve, you have to accept that the market is ALWAYS right. It can do whatever IT wants, WHENEVER it wants for ANY REASON. Charts help to isolate a probable range of scenarios which you can reference to better quantify risk. The more you over think it, the greater the chance that you lose.
Thank you for considering my analysis and perspective.

BITCOIN The path to All Time Highs is scripted.It has been 14 months (November 14 2022) since we published our first (and to this date most important) Bitcoin (BTCUSD) Cycle comparison between 2022/ 2023 and 2014/ 2015:
www.tradingview.com
As you can see the main driver behind this comparison was the FTX crash in November 2022 and the Bitfinex crash in August 2015, which both acted as catalysts for the bottom. Following the FTX crash/ bottom, the price action has so far followed quite closely the 2015/ 2016 recovery.
On today's analysis, also on the 1W time-frame, we focus on the Rising Wedge that funneled the price action from the Cycle bottom to the bullish recovery. The similarities between the two Cycles are remarkable:
1. Bounce on the Lower Highs and 1W MA50 (blue trend-line) break-out, which basically confirmed the transition into the Bull Cycle.
2. Immediate Channel Down after the 1W MA50 break-out on the Rising Wedge's first Higher High.
3. 1W MA50 supporting since the break-out.
Right now we are in the stage where the price has broken above the Rising Wedge. In June 2016 this caused a short-term correction back inside the Wedge towards the 1W MA50, which as mentioned held. If BTC continues to replicate that Cycle, does it mean that such a technical correction is due? The 1W MA50 is currently above 30000 and rising aggressively.
But what do you think? Are you expecting a 1 - 1.5 month pull-back from here and then a new All Time High after April's Halving? Feel free to let us know in the comments section below!
-------------------------------------------------------------------------------
** Please LIKE 👍, FOLLOW ✅, SHARE 🙌 and COMMENT ✍ if you enjoy this idea! Also share your ideas and charts in the comments section below! This is best way to keep it relevant, support us, keep the content here free and allow the idea to reach as many people as possible. **
-------------------------------------------------------------------------------
💸💸💸💸💸💸
👇 👇 👇 👇 👇 👇

BITCOIN ETF APPROVED!! Aggressive rally to $120k possible?Exactly a year ago (January 18 2023) we posted our last Fibonacci MAs study and called for a calculated rally while the rice was still at 20k:
It is now time to expand on our original idea and update it using the Mayer Multiple Bands. Basically, as you can see on the chart below, the Mayer MA helped us on June 17 2022 identify the Bottom Phase on the 1W MA300:
On the current analysis the 1W MA300 is portrayed by the blue trend-line but our focus has shifted to the black trend-line (Mayer Multiple Mean), which just broke emphatically this week. As you can see, when BTC has broken above this level since November 2015 (green circles), it starts aggressive rallies (lowest of those 3 has been the April - June 2019 of +180%).
The dashed curve represents the Bull Cycle Rally phases and if the +180% mininum black trend-line rise is repeated, expect at least $120000 as the current Cycle High. It might be less aggressive than the previous ones (Theory of Diminishing Returns and Cycle lengthening) but it should hit at least the orange trend-line (2nd upper SD) as it has always done in the past.
But what do you think? Are we going to see such a strong rally now that the Mayer Multiple Mean has been broken? Feel free to let us know in the comments section below!
-------------------------------------------------------------------------------
** Please LIKE 👍, FOLLOW ✅, SHARE 🙌 and COMMENT ✍ if you enjoy this idea! Also share your ideas and charts in the comments section below! This is best way to keep it relevant, support us, keep the content here free and allow the idea to reach as many people as possible. **
-------------------------------------------------------------------------------
💸💸💸💸💸💸
👇 👇 👇 👇 👇 👇

BTC Bitcoin Strong Bullish Will Rise to 37000,46000 and 71000USDBTC Bulls to Retarget $31,500
BTC could be in for a choppy session as investors consider the chances of SEC approvals for the ETFs and US inflation in focus.
the crypto news wires provided much-needed support. News of Fidelity filing for a spot Bitcoin Exchange-Traded Fund (ETF) was the key to the bullish session.
This morning, BTC was down 0.03% to $30,524. A bearish start to the day saw BTC fall from an early high of $30,534 to a low of $30,507.
Looking at the EMAs and the 4-hourly candlestick chart (below), the EMAs sent bullish signals. BTC sat above the 50-day EMA ($30,032). The 50-day EMA pulled further away from the 100-day EMA, with the 100-day EMA widening from the 200-day EMA, sending bullish signals.
A hold above S1 ($30,158) and the 50-day EMA ($30,032) would support a move through R1 ($30,882) to give the bulls a run at R2 ($31,232). However, a fall through S1 ($30,158) and the 50-day EMA ($30,032) would bring S2 ($29,784) into view. A fall through the 50-day EMA would send a bearish signal.
Resistance & Support Levels
R1 – $ 30,882 S1 – $ 30,158
R2 – $ 31,232 S2 – $ 29,784
R3 – $ 31,956 S3 – $ 29,060
Strategy Bullish
3Lots
2 Lots will be excecuted at Profit Target Zones
1Lot will follow the Trend
It will be only!!! excecuted ,if Bullish Trend changes
The stops will be delivered as soon as possible to break even,better some pips above the Buyinh price
I have marked my profit targets
Psychology:
1:The price is always right
2The Market is alwas right
3 The Chart is always right
4 IGNORE THE NEWS; Plan your trades and trade your plan.
5Drawdowns are partof the game
6 Risk management and money mangement is King!
7 wHATEVER HAPPENS;sTICK TO YOUR PLAN!
8 In a bear market no price is weak enough
9 In a bull market no price is strong enough
10 Patience !Wait for confirmation: Control emotions and tensions.

BITCOIN Is a potential ETF approval already priced in?It has been almost 3 months since Cointelegraph's fake ETF approval tweet (October 16 2023), which was basically the start of a medium-term mid-Cycle parabolic rally for Bitcoin (BTCUSD) that saw it grow by +69.10% this week. Yesterday we got the first serious signs of exhaustion as the 1D candle made contact with the 1D MA50 (blue trend-line) for the first time since October 12 2023. That was also at the bottom (Higher Lows trend-line) of the long-term Channel Up pattern. Both (1D MA50 and Channel Up) held, which keeps the trend bullish for now.
** Is the ETF priced in ahead of SEC? **
Only days before the Securities and Exchange Commission's (SEC) deadline regarding its decision, the real question is, has a potential Bitcoin ETF approval already priced in on this enormous mid-Cycle rally?
** Buy the rumor, sell the news? **
Indeed that was a significant move, especially considering the fact that it took place months before the next Halving (number 4, expected this April), which is the fundamentals event that provides a supply shock in the market. Nobody knows for sure how the market will react to a potential ETF approval next week but we have seen the old 'Buy the rumor, sell the news' approach one too many times happening in situations like this.
** Next Halving is the benchmark **
It wouldn't be surprising to see a correction towards April's Halving and then accumulation towards the Bull Cycle's 1 year rally. Purely from a technical point of view, which is the only hard data we have at hand to work with, a 1D MA50/ Channel Down break downwards can start a technical correction towards the lower Fibonacci retracement levels and the long-term Moving Averages.
** Fibonacci targets and the 1W MA50 **
The first level to test would be the 0.382 Fibonacci around 37500 and then the 0.5 Fib around 35350. If the correction takes place gradually in a controlled manner and not aggressively, we can see a 1D MA200 (orange trend-line) contact by then. A more aggressive possibility can see BTC test the 0.618 Fib and the 1W MA50 (red trend-line) a little lower, which is the natural long-term Support during Bull Cycles and is currently intact (the 1W MA50) since March 13 2023.
** Bearish Divergence **
In addition to the above technical realities, we shouldn't ignore the 1D RSI, which has been on Lower Highs since October 25 2023, i.e. peaked 9 days after Cointelegraph's fake ETF tweet, trading within a Falling Wedge pattern, which with regards to the price's Channel Up, is a Bearish Divergence.
But what do you think? Is a potential ETF approval already priced in, and if yes how low do you expect the price to fall? Feel free to let us know in the comments section below!
-------------------------------------------------------------------------------
** Please LIKE 👍, FOLLOW ✅, SHARE 🙌 and COMMENT ✍ if you enjoy this idea! Also share your ideas and charts in the comments section below! This is best way to keep it relevant, support us, keep the content here free and allow the idea to reach as many people as possible. **
-------------------------------------------------------------------------------
💸💸💸💸💸💸
👇 👇 👇 👇 👇 👇

Happy New Year with BITCOIN breaking 45k!First and foremost allow me to wish everyone here in the TradingView community a Happy New Year and a prosperous 2024!
What a better way to start the year than Bitcoin (BTCUSD) breaking above 45000 mark, a level it last visited on April 06 2022. Every Cycle can be seen trading within a Megaphone pattern with the parabolic rally illustrated by the dotted curves. Note that every time the price breaks above the 1W MA50 (blue trend-line), it holds it as Support (exception of course was the COVID crash). The 1W MA50 is now 30000, which means that technically any pull-back/ correction that takes place until the peak of this Cycle, shouldn't break below this level and practically dip buyers have a benchmark to work with.
But what do you think? Are we about to witness an even more aggressive part of this new rally? Feel free to let us know in the comments section below!
-------------------------------------------------------------------------------
** Please LIKE 👍, FOLLOW ✅, SHARE 🙌 and COMMENT ✍ if you enjoy this idea! Also share your ideas and charts in the comments section below! This is best way to keep it relevant, support us, keep the content here free and allow the idea to reach as many people as possible. **
-------------------------------------------------------------------------------
💸💸💸💸💸💸
👇 👇 👇 👇 👇 👇

BITCOIN The Ultimate Pitchfan Cycle AnalysisBitcoin (BTCUSD) has seen a significant mid-Cycle growth in the past 2 months, approaching the pivotal 50k level. Technically a break above the 48.5k Resistance, constitutes the beginning of the Parabolic Phase of the Bull Cycle.
There isn't a better way to illustrate this transition than the use of the Pitchfan tool. Rarely used on BTC analysis and even more so on the long-term Cyclical patterns, it displays as you can see a very accurate illustration of the Cycles and specifically the stage we are currently at.
Every Resistance break-out usually takes place around the Halving event, which is the fundamental that typically signals the start of the rally to a new All Time High (ATH). The market is only 4 months away from this event and based on this every pull-back to the 1D MA50 is a buy opportunity to Dollar Cost Average (DCA).
So what do you think? Do you expect a Bullish Break-out into the new Parabolic Rally soon? Feel free to let us know in the comments section below!
-------------------------------------------------------------------------------
** Please LIKE 👍, FOLLOW ✅, SHARE 🙌 and COMMENT ✍ if you enjoy this idea! Also share your ideas and charts in the comments section below! This is best way to keep it relevant, support us, keep the content here free and allow the idea to reach as many people as possible. **
-------------------------------------------------------------------------------
💸💸💸💸💸💸
👇 👇 👇 👇 👇 👇

BTCUSD - Expected Similar Runs ComingThe 2016 to 2018 bullrun is very similar to what we are about to experience bullishly through this channel.
Price label is shown as the top of the run.
Early stages of a long bull market.

BITCOIN Will it hit 48k before the New Year?Bitcoin (BTCUSD) is currently testing the 1-month Higher Lows trend-line that has been supporting the price action since the November 22 Low. Even though the 4H MA50 (blue trend-line) has been acting as a Pivot, the 4H MA200 (orange trend-line) has been intact and supporting since October 15 and is right below that Higher Lows trend-line.
Technically, the price action from December 08 until now is similar to that between November 09 - November 27. What followed after the (d) wave bottomed on the Higher Lows trend-line was a +21% rally.
If the final sequence is repeated as well, we can expect the 48300 March 2022 High to get tested.
But what do you think? Will that be the case and if so, do you expect 48k to get hit before January 01 2024? Feel free to let us know in the comments section below!
-------------------------------------------------------------------------------
** Please LIKE 👍, FOLLOW ✅, SHARE 🙌 and COMMENT ✍ if you enjoy this idea! Also share your ideas and charts in the comments section below! This is best way to keep it relevant, support us, keep the content here free and allow the idea to reach as many people as possible. **
-------------------------------------------------------------------------------
💸💸💸💸💸💸
👇 👇 👇 👇 👇 👇

Bitcoin: 42,850 Swing Trade Setup.Bitcoin consolidation within a Wave 4 which is poised for one more leg higher (Wave 5) IF the 40K support holds over the coming week. At this time, a break above 42,850 will signal a swing trade long in anticipation of a test of the 45K high. IF price breaks lower instead, I will be watching for a test and reversal confirmation around the 40K level support (See blue square on chart).
The next two weeks are likely to be filled with optimism, positive news, etc which is typical this time of year. Volume is also likely to get lighter which can make for lack of follow through OR slow grinds which are especially tricky (and costly) for counter trend strategies.
The outcome of Wednesday's FOMC meeting set the tone. The S&P, Nasdaq, Russell 2000, Ten Year Note have gone vertical pricing in a dovish future. PLEASE keep in mind, just because the market is pricing this in does NOT mean something unexpected can't come along in Q1 or Q2 of next year. It is easy to get caught in the hype and think "its strong, its safe" and usually this is when risk is the GREATEST (see S&P in December of 2021).
In my opinion the best way to control risk and avoid getting caught is by keeping expectations LOW on BOTH sides of the market. Don't fight the momentum, while at the same time, it is not wise to expect that higher highs will just relentlessly continue. Day trade strategies are best OR just stay out and WAIT for a broader retrace. It may take a month.
This is why I cannot emphasize enough the importance of sticking to a well defined system that identifies particular setups in your chosen market. My Trade Scanner is a testament to this because while it does not produce a 100% win rate (nothing does), it has identified over a dozen winning trades over the previous 2 weeks across 3 asset classes (see results page).
It really pays to understand what you are up against as a retail trader before you can appreciate the value of automation. To use a poker reference: imagine the advantage you would have over your opponents IF you could see their cards. THAT is the advantage that exchanges, market makers, dealers and other counter parties have over all of US. THINK about that the next time you are wondering why you can never seem to make consistent money in this game.
Thank you for considering my analysis and perspective.

Bitcoin - BTC pair signal🟢just occurred🚨🚨🚨Bitcoin
HUNT HISTORICAL BITCOIN VOLATILITY PLOT
The pair signal🟢just occurred 🚨🚨🚨
Not always but often seen‼️
Imagine these were your BTC entry points over the years😉
What will the smart money do❓
Let me know your thoughts in the comments🤗
⬇️⬇️⬇️
Likes and Follow for updates appreciated🤗
Disclaimer:
Not financial advice
Do your own research before investing
The content shared is for educational purposes only and is my personal opinion

BTC I expect down correction Bitcoin I expect a correction. I am waiting for a position to be opened. And as I know the BTC market, it will now move up to take the stop loss to short positions and then we will move down.

Bitcoin: Overlooking The Wave Count?Bitcoin appears to be in a smaller magnitude Wave 4 (see chart) which implies one more push higher to complete the impulse structure. such a move can see price into the mid to high 46Ks over the next couple of weeks. While this is good news for those who have been or are looking to go long, there is one technical problem that is likely being overlooked by most.
I am using the general wave count idea to illustrate the smaller magnitude impulse structure at hand. I am not accounting for where Bitcoin is on the broader magnitude. If you go out to a monthly time frame (not illustrated here) the risk is much more obvious. The completion of the current impulse appears to be a Wave C of a large magnitude B (I will review this further in my stream tomorrow).
This is important because IF this structure turns out to be true, then the coming corrective wave is likely to be a broader C Wave. This can take price back to levels completely unexpected or foreseen at this time. An extreme instance can be a test of the structure low at 15K. Keep in mind, a wave of this magnitude can take MONTHS or even a year to play out.
While this is NOT meant to be a precise forecast, it does highlight important RISKS, particularly for investors. Current levels are NOT attractive because there is a greater chance these are cycle highs. It should be no surprise that the faketuber thumbnail titles are once again coming out with "it's just getting started" and "early investors will make millions".
Markets are mostly random and do not operate on logic. There is no way to know if this bearish scenario will play out or not it is a function of perception. The third leg of this rally was initiated by EFT news and halving anticipation. Realize that bearish perception of the same magnitude can also come of out no where.
For these reasons, I control risk by having LOW expectations of further potential at current levels. Risk is controlled by your category of strategy. Day trades and swing trades are the best way to navigate current levels for the coming month at least. The idea being not getting caught with longs at cycle highs and assuming the MOST risk while letting others out for a nice profit.
Thank you for considering my analysis and perspective.

BTCUSD: Amazing similarity with 2020. Will the 1D MA50 hold?Bitcoin has so far remarkably followed the fractal that followed the March 2020 COVID crash. Of course that was a pattern on the second phase of that Bull Cycle, whilst now (chart on the left) was the first rebound of the Bull Cycle. Nevertheless, the similarities are striking. Especially on the RSI's part. The 1D technical outlook is bullish (RSI = 60.001, MACD = 1547.200, ADX 26.937) and as long as the 1D MA50 holds, there is reason not to expect a bullish extension. Fractal-wise we are in a situation similar to the November 26th 2020 pullback, which gave way to a short term consolidation.
Do you think the 1D MA50 and initiate a new bullish wave?
## If you like our free content follow our profile to get more daily ideas. ##
## Comments and likes are greatly appreciated. ##

BITCOIN FULL REVIEWthis would be a little long idea, I'm sincerely asking you to read until the end with all the comments to understand my idea completely.
I'm gonna analyze the bitcoin chart from weekly to hourly time frame and using some kind of different indicators to see as much reaction and knots as we can to find the proper behavior of price since the last dump.
generally, I have 2 kinds of view for this idea: 1- bullish and. 2- correctional. I believe there is no falling or another dumping view for this chart anymore ( at least until there is no global financial crisis ).
we start from weekly :
as I see from the start of the bullish movement in march 2020 we reach the ATH of almost $65k which was the 0.68 point of FIBO extension, then we had a retrace to 0 points of it.
As can be seen from the past chart. The price will not grow evenly, so we need retracements along the way.
And given the location and collisions of the candlesticks with the specified levels, the price may be currently in a place that needs a retracement.
From the beginning of the last uptrend on July 19, 2021, until now, we have started a perfect bullish movement, and now it is possible to retrace it by reaching the first target, which is the range of 0.38 Fibo and median fork.
considered the target :
Given that the static channel front range (indicate in purple) with a green line ( representing the 50% range of the fork) can indicate a good level for the target of the corrective movement.

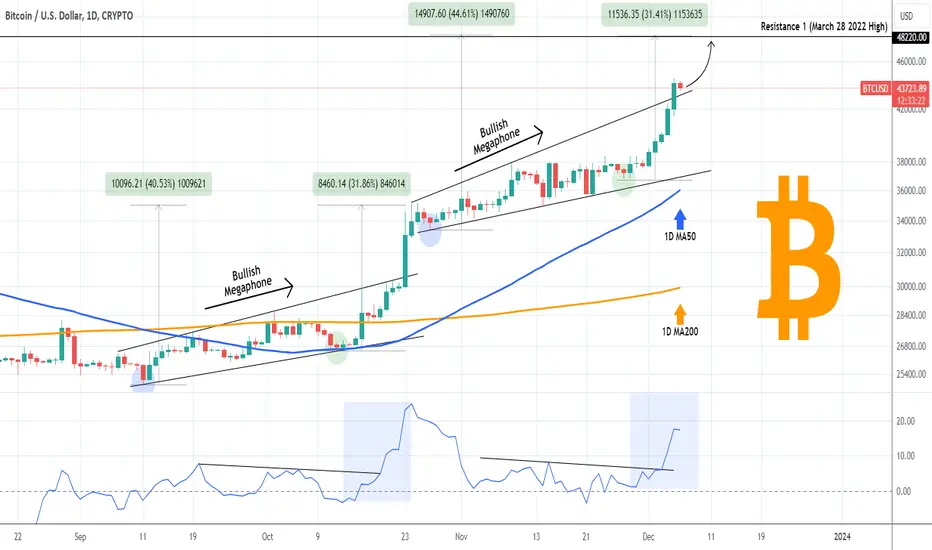
BITCOIN Megaphone breached! How high can the price go?Bitcoin (BTCUSD) broke yesterday above the Bullish Megaphone pattern that kept it at bay since the October 24 High. The previous Bullish Megaphone of September - October technically served as a consolidation belt before the price broke upwards to deliver a +31.86% peak from the Megaphone's last Higher Low and +40.50% from its first Low.
The ROC shows a similar behavioral structure between the two patterns. If it continues this way, then a new +31.50% leg will make a perfect contact on 48220, which is the March 28 2022 High, essentially the Bear Cycle's first Lower High and a key Resistance level of the current Bull Cycle. Technically, as long as the 1D MA50 (blue trend-line) holds (has been doing so since Sep 28), that is a realistic end target for this bullish wave.
But what do you think? Do you agree that this is a likely extension for this rally before the price pulls back or you expect a pull back now? Feel free to let us know in the comments section below!
-------------------------------------------------------------------------------
** Please LIKE 👍, FOLLOW ✅, SHARE 🙌 and COMMENT ✍ if you enjoy this idea! Also share your ideas and charts in the comments section below! This is best way to keep it relevant, support us, keep the content here free and allow the idea to reach as many people as possible. **
-------------------------------------------------------------------------------
💸💸💸💸💸💸
👇 👇 👇 👇 👇 👇
Dollar (DXY) moving up soon? The Dollar (DXY) had a big rally from July until October and then a correction back down to the VWAP (volume-weighted average price) moving average line. It is currently above and looking like it will make it's next leg up as we close the year.

BITCOIN Hello April 2022! 40k cleared!Bitcoin (BTCUSD) broke above the psychological 40000 mark, trading now even above 41k. Those are levels that we haven't seen since the week of April 18 2022! And we don't know yet where this euphoric (on Fed, ETF anticipation) candle will stop.
Technically, the next Resistance level is the 48220 High that was the first Lower High made after the November 2021 All Time High, on the week of March 28 2022. With the current trend structure it is not unrealistic to hit this zone as the pattern remains a Channel Up since the November 2022 market bottom. The current bullish leg resembles that of March 2023 and the price action now is on a course to price the new Higher High near the 48220 Resistance.
Beyond that it is high speculation but if it continues to repeat the waves of the Channel Up and the sequence after the April 10 2023 High, we could see a Falling Wedge bottoming close to Halving 4 (expected in April 2024) and as you are all aware of, the supply shock that the Halving causes to BTC, should gradually set in motion the Parabolic Rally of the Bull Cycle.
In addition to the above, BTC is about to complete in the next 2-3 weeks the first ever Golden Cross on the 1W time-frame, which is when the 1W MA50 (blue trend-line) crosses above the 1W MA200 (orange trend-line). It will be really interesting to see how the market will react for the first time to such a bullish technical pattern.
But what do you think? Do you think that Channel Up is too scripted to be true? If not, can Bitcoin test 48k next straight away or a pull-back to test the middle/ bottom of the Demand Zone would be more realistic? Feel free to let us know in the comments section below!
-------------------------------------------------------------------------------
** Please LIKE 👍, FOLLOW ✅, SHARE 🙌 and COMMENT ✍ if you enjoy this idea! Also share your ideas and charts in the comments section below! This is best way to keep it relevant, support us, keep the content here free and allow the idea to reach as many people as possible. **
-------------------------------------------------------------------------------
💸💸💸💸💸💸
👇 👇 👇 👇 👇 👇

Bitcoin: Break To 45K Or 35K?Bitcoin has broken the 38K minor resistance and has tested the 40K whole number. The entire range between 38 and 40K is a resistance zone. Based on my thought framework, I place more emphasis on the probability of a short term bearish outcome from this level. This means risk for new longs is even HIGHER than it was at the 38K minor resistance. Based on this idea, I anticipate a retrace back to the 37 to 38K area (now a minor support) over the coming week (see chart illustration).
These situations are particularly hard for shorts. In a recent weekly update video I made, I pointed out that the price lingering around 38K could be interpreted as a sign of strength. I come to such a conclusion because price usually REJECTS resistance levels quickly, which it tried to do previously. This lures more shorts, particularly on smaller time frames, traders who do not have the perspective or experience to recognize the hidden strength.
This is precisely why in my previous article, I described a short day trade example, specifically mentioned to NOT expect much more than a move of 200 or so points. Counter trend setups are usually plentiful in these situations, but their potential is LOW.
While at the same time, price continues to flirt with a location that is not attractive for longs on the swing trade time frame. When risks are high on both sides of the market (bullish trend, but lingering at resistance) I have found it is most effective to either keep expectations very small on both sides (day trades only) OR just stay out completely until a higher probability scenario develops (test of support in bullish trend).
One more observation I want to point out is the weekly wave count (not illustrated here). If you go back to December of 2022, and begin the count there, the current wave appears to be a 5 of 3. If that's true, it points to the increased possibility of a Wave 4 corrective structure back to the 35K area support over the coming months. If a 5th wave appears after that, it implies a a test of the 45K area (this can take months). This is NOT to be meant as a forecast, but instead a point of reference to gauge risk.
Being in holiday mode, all of the markets are at risky levels. Take a look at S&P, bonds are also at a resistance level, etc. Don't get sucked into the hype that comes with this. Pay attention to LEVELS relative to their structure and constantly gauge and adjust RISK otherwise you will be fleeced. This game is NOT for your benefit that is why in my opinion the BEST DEFENSE wins.
Thank you for considering my analysis and perspective.
