Bitcoin and the $16,500 mark👀Bitcoin and the $16,500 mark👀
Not only an important price level on my current short-term charts I share with you
Look at the BTC reaction 2 YEARS ago👀🚨
A daily close above the yellow wick limit line would excite me - you to dear Crypto Nation❓
Let me know your thoughts in the comments🤗
⬇️⬇️⬇️
Likes and Follow for updates appreciated🤗
Disclaimer:
Not financial advice
Do your own research before investing
The content shared is for educational purposes only and is my personal opinion
Bitcoin-btcusd-btc

Bitcoin shorting opportunity This is a BTC shorting opportunity with target at 6700/6800.
Reasons that I follow:
1) 3M macd negative crossover and stochastic negative crossover heading is pointing towards a large range sideways move.
2) 1M macd negative is below signal line and below xero line. Stochastics in oversold zone.
3) 1w macd in negative territory does not reap any bullish signs of buying sentiment.
4) prices is below all averages on D,w.
5) many FUD news on the block.

Bitcoin short-term view - watch $16,530 volume support‼️👀Bitcoin short-term update
(a) BTC with perfect touch of mentioned $16,530 volume support‼️👀
(b) further bearish break target at $15,800 - $15,460
(c) first bullish signal would be breaking $16,960 again
Have a great day dear Crypto Nation😎
Let me know your thoughts in the comments🤗
⬇️⬇️⬇️
Likes and Follow for updates appreciated🤗
Disclaimer:
Not financial advice
Do your own research before investing
The content shared is for educational purposes only and is my personal opinion

BITCOIN 50% of stocks above 1D MA200 = RallyThis is Bitcoin (BTCUSD) on the 1W time-frame compared to the S&P500 index (SPX) illustrated by the blue trend-line. The indicator below (black trend-line) shows that historically when 50% of the S&P500 stocks break above their 1D MA200, both Bitcoin and the S&P500 start a rally soon.
Initially a few weeks of volatility takes place but the process already kicks in. Bitcoin's RSI is displayed in orange to give a better perspective of where we could be historically compared to prior bottoms. As you see, it tends to lag behind the stocks' indicator when it breaks above 50% .
Do you think the pattern will be repeated again? Feel free to let me know in the comments section below!
-------------------------------------------------------------------------------
** Please LIKE 👍, SUBSCRIBE ✅, SHARE 🙌 and COMMENT ✍ if you enjoy this idea! Also share your ideas and charts in the comments section below! This is best way to keep it relevant, support me, keep the content here free and allow the idea to reach as many people as possible. **
-------------------------------------------------------------------------------
You may also TELL ME 🙋♀️🙋♂️ in the comments section which symbol you want me to analyze next and on which time-frame. The one with the most posts will be published tomorrow! 👏🎁
-------------------------------------------------------------------------------
💸💸💸💸💸💸
👇 👇 👇 👇 👇 👇

BITCOIN 6H breaking channel NowIn the previous analysis of Bitcoin, we mentioned the channel that today the channel's support for the data went and updated the support ranges.
Its not Buy or Sell SIGNAL
DYOR
BY : M.TeriZ - @AtonicShark

GOLD 4H Channel & SupportGiven the chart in the 4 -hour frame time, the price is on the upward channel, which, if preserved, we expect to climb the channel after colliding. If the floor of the channel breaks, the loss to the specified area is not unexpected.
Its not Buy or Sell SIGNAL
DYOR
BY : M.TeriZ - @AtonicShark

Bitcoin short-term view - SMA & EMA supportBitcoin short-term update
(a) BTC found support at SMA & EMA as supposed yesterday
(b) a second bearish leg to $17,195 of $16,960 likely
(c) bullish when breaking $17,500 again
Have a great Day dear Crypto Nation😎
Let me know your thoughts in the comments🤗
⬇️⬇️⬇️
Likes and Follow for updates appreciated🤗
Disclaimer:
Not financial advice
Do your own research before investing
The content shared is for educational purposes only and is my personal opinion

BITCOIN Pivot rejection, important 4H MA50 test! Buy or sell?Bitcoin (BTCUSD) immediately got rejected upon entering the 18200 - 18900 Pivot Zone (blue), which as we mentioned in our previous analysis was the former Support Zone from June until November (having multiple rebounds/ circles) now turned into a Resistance.
The price broke again below the 1D MA50 (blue trend-line) and is headed towards the Support of the 4H MA50 (red trend-line). This is a critical Support level as within the greater Falling Wedge pattern that started on the June 18 Low, every time the price broke below it after a Lower High, a major sell-off was initiated.
However all Lower Highs (peaks) within the Falling Wedge, have take place after BTC broke above the 1D MA100 (green trend-line), even marginally (green circles - August 15, September 13 and November 05). This hasn't happened yet on this Nov/ Dec rally and the 1D MA100 is currently just above yesterday's peak, inside the Pivot Zone and a little lower than the Falling Wedge's top (Lower Highs trend-line).
As a result, unless the 4H MA50 breaks, we still believe there is (at least) some upside left on this BTC rally. Perhaps the 1D RSI can give an additional edge to finding the top after it enters its Resistance Zone. Below the 4H MA50, we expect 16000 to be tested while even a Lower Low on the Wedge's bottom is possible.
As for the long-term, only a break above the 1D MA200 (orange trend-line) which is unbroken for nearly 1 year (since December 31 2021), can restore the bullish trend and confirm the new Bull Cycle.
So what do you think? Is there one left High to make or Bitcoin will break below the 4H MA50 first? Feel free to let me know in the comments section below!
-------------------------------------------------------------------------------
** Please LIKE 👍, SUBSCRIBE ✅, SHARE 🙌 and COMMENT ✍ if you enjoy this idea! Also share your ideas and charts in the comments section below! This is best way to keep it relevant, support me, keep the content here free and allow the idea to reach as many people as possible. **
-------------------------------------------------------------------------------
You may also TELL ME 🙋♀️🙋♂️ in the comments section which symbol you want me to analyze next and on which time-frame. The one with the most posts will be published tomorrow! 👏🎁
-------------------------------------------------------------------------------
💸💸💸💸💸💸
👇 👇 👇 👇 👇 👇

BITCOIN 6H new channelWe see the ascending channel correctly, after hitting the top of the channel, we expect correction to the bottom of the channel, which is the support area.
Its not Buy or Sell SIGNAL
DYOR
BY : M.TeriZ - @AtonicShark

Bitcoin short-term view - BTC got rejected at $18,355Bitcoin short-term update
(a) BTC got rejected at my mentioned $18,355 resistance
(b) we also lost important $18,000 mark
(c) but a further correction to $17,500 where we might find SMA & EMA support would not be concerning at all
Have a great Day dear Crypto Nation😎
Let me know your thoughts in the comments🤗
⬇️⬇️⬇️
Likes and Follow for updates appreciated🤗
Disclaimer:
Not financial advice
Do your own research before investing
The content shared is for educational purposes only and is my personal opinion

BITCOIN Long Trade 2022Nov29Signal: Blue * 3 -> Green
Risk Reward: 2
BTC , BTCUSD , BTCUSDT , BTCUSDTPERP , BTCBUSDPERP , BITCOIN , CRYPTO, CRYPTOCURRENCY
DISCLAIMER
This is only a personal opinion and does NOT serve as investing NOR trading advice.
Please make your own decisions and be responsible for your own investing and trading Activities.

Bitcoin short-term view - bearish divergence on RSI⚠️Bitcoin short-term update just before #FOMC meeting
(a) BTC with a nice pre-pump above $18,000😎👍
(b) bearish divergence on RSI⚠️
(c) $18,355 next bullish target🐂
(d) correction to $17,500 always possible🐻
Exciting before Jerome Powell speach dear Crypto Nation❓
Let me know your thoughts in the comments🤗
⬇️⬇️⬇️
Likes and Follow for updates appreciated🤗
Disclaimer:
Not financial advice
Do your own research before investing
The content shared is for educational purposes only and is my personal opinion

Total amount of stable coins transferred on-chain vs Bitcoin📝Overview
This indicator measures the total amount of coins transferred on-chain.
Only successful transfers are counted.
(Glassnode)
📈Analysis
In this chart I put the main stable coins.
Looking at the on-chain volume, the highest volume so far was reached on Nov 08, 2022, at the bottom marked in the red circle.
Looking at it, the break of this support would be accompanied with a new record in volume.
🔎Binance
Looking at Binance's stable coin in isolation, we have a temporary new all time high.

Bitcoin - BTC Renko-chart Support zones⬜️🟦🟥 Bitcoin Renko-chart Support zones⬜️🟦🟥
Get a clean view by filter out the noise dear Crypto Nation🔇😉
BTC zones to keep an eye on👀
⬜️$18k - $19k
temporary lost
🟦$16k - $17k
were we are now - green candle might come up🟩
🟥$11k - $13k
Let me know your thoughts in the comments🤗
⬇️⬇️⬇️
Likes and Follow for updates appreciated🤗
Disclaimer:
Not financial advice
Do your own research before investing
The content shared is for educational purposes only and is my personal opinion

Financial Wave. BTC m15BTCUSDT, 15min
Our preferred scenario in Bitcoin was confirmed by a rise towards $18,000. A continuation of the uptrend is the most likely scenario for BTC. A rise in wave 3 could lead the price of Bitcoin to the next target of $18,800. Our variant allows for a corrective fall to $17,500, a fall below $17,100 will change the wave structure and our priority scenario.

Bitcoin short-term view - BTC broke mentioned resistance channelBitcoin short-term view update
(a) BTC broke yesterdays mentioned resistance channel and might confirm it by a close above $17,244
(b) bullish target still $17,500
(c) bearish target still $16,500
Let me know your thoughts in the comments🤗
⬇️⬇️⬇️
Likes and Follow for updates appreciated🤗
Disclaimer:
Not financial advice
Do your own research before investing
The content shared is for educational purposes only and is my personal opinion

BITCOIN Historical Buy Signal is flashingBitcoin (BTCUSD) remains supported on the 1W MA350 (red trend-line) following the FTX crash. A rare indicator, the Gaussian Channel (GC), remains red but based on previous Cycles, by the time it turns green, Bitcoin already has the first mini rally of the new Bull Cycle.
The previous two GC Cycles from the end of the previous red period to the end of the next red period extended for 1260 and 1280 days respectively. If the 1280 day max is repeated during this Cycle also then the GC should flash green by January 30 2023. That means that historically there isn't much time left to start the 1st rally of the new Bull Cycle.
Also by using the Fibonacci extension and retracement levels we see that the first two Cycles topped a little over the 1.414 Fib extension, while the bottoms of the first three Cycles have been above the 0.618 Fib retracement level. As diminishing returns are in effect on each Cycle, which in theory should narrow Bitcoin's channel long-term, the last Cycle topped lower on the 1.236 Fib (which is where the last High before the Top was formed in the previous two Cycles). If the channel does narrow down, then we bottom should also be higher and the next candidate would be the 0.5 Fib, which is slightly below the recent November low.
With the Gaussian Channel pattern pointing to the 1st rally soon, the MA350 holding and the 0.5 Fib potentially the new Cyclical Support, we have perhaps the strongest buy signal of this Cycle flashing right now.
Do you think that's the best time to buy? Feel free to let me know in the comments section below!
-------------------------------------------------------------------------------
** Please LIKE 👍, SUBSCRIBE ✅, SHARE 🙌 and COMMENT ✍ if you enjoy this idea! Also share your ideas and charts in the comments section below! This is best way to keep it relevant, support me, keep the content here free and allow the idea to reach as many people as possible. **
-------------------------------------------------------------------------------
You may also TELL ME 🙋♀️🙋♂️ in the comments section which symbol you want me to analyze next and on which time-frame. The one with the most posts will be published tomorrow! 👏🎁
-------------------------------------------------------------------------------
💸💸💸💸💸💸
👇 👇 👇 👇 👇 👇

Bitcoin short-term view - $16,500 not unlikely now🔴Bitcoin short-term view update
(a) BTC down below volume resistance $16,960
(b) we had a fakeout on RSI
(c) bearish target $16,500 not unlikely now🔴
(c) bullish again if we break the resistance channel🟢
Let me know your thoughts in the comments🤗
⬇️⬇️⬇️
Likes and Follow for updates appreciated🤗
Disclaimer:
Not financial advice
Do your own research before investing
The content shared is for educational purposes only and is my personal opinion

bitcoin same pattern as the first breakout, today the same? 17.8as we can see the pattern is repeating, focussing to pop to the 18k resistance
this might happen today and we might see continuation tomorrow
i dont expect it to pullback before the spike to 17.5/17.8 area
let me know what you think

Bitcoin: WAIT For CPI, FOMC.All eyes on the CPI report coming out on Tuesday. This is a key report that the Federal Reserve considers when it comes to adjusting interest rates. And right after that, the FED meets on Wednesday to announce their next interest rate decision which is followed by the all important press conference. What does all this mean for Bitcoin? Price action is likely to go NO WHERE until the outcome of these events.
Do NOT make the mistake of thinking you know how the market will price in the outcomes. In this environment, these are BINARY events. Price can go one way or the other, or no where at all if there are no surprises or new pieces of information for the market to price in. This is where opinions can be VERY costly. If you are not in the market, it is best to WAIT until after the event is out of the way. The thing is, this week we have two major events back to back.
The problem with opinions is this: there is no way to know how exactly the market will react, and LOGIC (which is what everyone applies) is NOT effective in a market place that is primarily driven by emotions. For example, CPI may come out high but not as high as "expected" which can be a positive for the markets since it is in line with the Fed's raising rates at a slower pace. The point is, LET THE MARKET FIGURE IT OUT. The market knows all the information in the world, and is highly efficient.
Here is my swing trade plan for Bitcoin: AFTER both events are out of the way, I will be looking for short setups in the low 18Ks. If price happens to break through this area decisively, then I stand aside. While many may argue that Bitcoin is in a "bullish" trend, this only applies to very short time frames. Bigger picture continues to maintain a BEARISH structure. I have no intent to look for longs unless the 15K low is tested again, which is highly likely to break (especially in light of an unexpected catalyst).
Until these events unfold. Bitcoin (and the stock market) is NOT likely to go anywhere. Don't get caught into taking unnecessary action or trade just to trade in this highly uncertain situation. The 17K area is still near the mid point of the 15K to 18K broader lower high consolidation. Price action here is HIGHLY RANDOM.
While I still think it is too early to be taking any major positions for the longer time horizons, I do think it is a good time to build the investment plan. Bitcoin is going to be one of the instruments that I include in my forthcoming speculative growth portfolio which will be comprised of a variety of growth stocks and possibly select alt coins.
Thank you for considering my analysis and perspective. I hope you find it helpful.

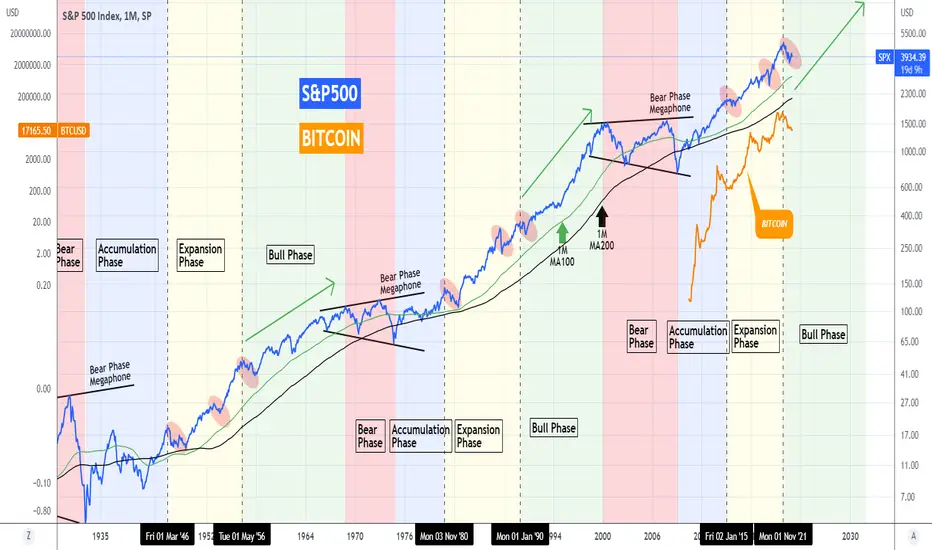
BITCOIN and S&P500 Has a 10 year Bull phase just started?A 1 year correction which is nothing but common throughout Bitcoin's (BTCUSD) existence, has done its work well in spreading fear and doubt at the market during this inflationary stock crisis in 2022. In times like this what helps the most is to maintain a long-term perspective and look at how history reacted in similar situations.
We thought that nothing can help us get a better grasp at the situation than look into how Bitcoin compares to the major stock index the S&P500 (SPX). On this 1M time-frame, Bitcoin is displayed by the orange trend-line while the S&P500 by the blue. We are looking into the S&P500's price action since the Great Depression. As you see the index repeats through history four major phases:
* The Bear Phase (red), where the index gets into a Megaphone pattern and has two major correction sequences. It breaks initially below the 1M MA100 (green trend-line) and then below the 1M MA200 (black trend-line).
* The Accumulation Phase (blue), where the index starts recovering from the Bear Phase and breaks above both the 1M MA100 and MA200, turning sideways. This is technically the most efficient/ earliest available level to enter the market.
* The Expansion Phase (yellow), where the index established trading above the 1M MA100/200 (never breaks them until the next Bear Phase) and makes the first multi-year rise. This Phase is marked by three "smaller" correction periods (red ellipses).
* The Bull Phase (green), where the index recovers from the last small correction and rises aggressively to form the top before the new Bear Phase. It tends to last around 10 years.
This year's correction (2022) is the third one of the Expansion Phase and as the price remains above the 1M MA100, it is more likely that with the correction already completed, S&P500 has entered its new Bull Phase.
The chart clearly shows that Bitcoin's 12 year period of immense growth has only been during the S&P500's Accumulation and Expansion Phases. This suggests that we may haven't seen yet it's strongest growth to come during the stock market's new Bull Phase! The correlation of Bitcoin's tops and bottoms to those of the S&P500 is more than obvious.
Most market participants say that this time is different due to the soaring inflation and aggressive rate hikes. But hasn't this also been the narrative in the late 70s? Still the market found the mechanisms to grow in the Expansion Phase that followed and the new technologies (internet etc) to inflate it to immense highs in the 90s until the eventual crashes of the 00s. It may seem like a different reason each time but the behavior is always cyclical with repeating patterns and phases, the narrative in the past 100 years can be whatever the news decide it to be. But the market will continue printing and printing the same patterns as human behavior stays the same.
So what do you think, are we about to witness the growth of a lifetime on both Bitcoin and stocks in the next 10 years? Feel free to let me know in the comments section below!
-------------------------------------------------------------------------------
** Please LIKE 👍, SUBSCRIBE ✅, SHARE 🙌 and COMMENT ✍ if you enjoy this idea! Also share your ideas and charts in the comments section below! This is best way to keep it relevant, support me, keep the content here free and allow the idea to reach as many people as possible. **
-------------------------------------------------------------------------------
You may also TELL ME 🙋♀️🙋♂️ in the comments section which symbol you want me to analyze next and on which time-frame. The one with the most posts will be published tomorrow! 👏🎁
-------------------------------------------------------------------------------
💸💸💸💸💸💸
👇 👇 👇 👇 👇 👇
Bitcoin short-term view - BTC at price action and RSI resistanceBitcoin short-term view update:
(a) BTC at price action and RSI resistances
(b) bullish breakout target $17,500🟩
(c) bearish rejection target $16,960🟥
Let me know your thoughts in the comments🤗
⬇️⬇️⬇️
Likes and Follow for updates appreciated🤗
Disclaimer:
Not financial advice
Do your own research before investing
The content shared is for educational purposes only and is my personal opinion

Bitcoin the next switch🔴🟢of DPPM Oscillator❓🚨❓🚨❓Bitcoin and the next switch🔴🟢of DPPM Oscillator ❓🚨❓🚨❓🚨❓
That would be a very interesting #bullish signal IMO - never seen such a quick double switch before😎
FTX won't heart BTC at all - that's clear‼️
Let me know your thoughts in the comments🤗
⬇️⬇️⬇️
Likes and Follow for updates appreciated🤗
Disclaimer:
Not financial advice
Do your own research before investing
The content shared is for educational purposes only and is my personal opinion
