$BTC : Going for 18K or 15K ? Let's CBy reviewing the November 27th analysis of BTC , we can see that we had 2 scenarios, and one of those scenarios was collecting BUY STOPS liquidities above $17,000, and this is exactly what happened, of course, the bearish scenario of the last analysis failed! Currently, we have two Institutional supports, one is $16,900 and one is $16,500! If the price consolidates above these levels, we can expect the price to grow to $18180 as the next target!
Follow me for more analysis & Feel free to ask any questions you have, I'm here to help.
⚠️ This Analysis will be updated ...
👤 Arman Shaban : @ArmanShabanTrading
📅 12. 01 .2022
⚠️(DYOR)
❤️ If you apperciate my work , Please like and comment , It Keeps me motivated to do better ❤️
Bitcoin-btcusd-btc

Bitcoin - BTC Aroon Oscillator from Top to Bottom🔵🟢🟡🔴Comparing the number of downward extremes at the Aroon Oscillator from Top to Bottom 2013-15 & 2017-18 🔵🟢🟡🔴..
..we got a further leg down as supposed dear BTC and Crypto Nation‼️
Comparing the number of peaks⚪️more downside possible❓
Let me know your thoughts in the comments🤗
⬇️⬇️⬇️
Likes and Follow for updates appreciated🤗
Disclaimer:
Not financial advice
Do your own research before investing
The content shared is for educational purposes only and is my personal opinion

The Game: Manipulators Vs Retail TradersLet’s play the game. It’s very interesting and it can give us a better understanding how the crypto market will move in the future.
DESCRIPTION
So, first of all imagine, we are Manipulators. We work as a team. Against us there is a team of Retail Traders.
We all want to make tons of money! We all need to buy as many Bitcoins as possible at the bottom and BEFORE a bullish cycle.
We have the same goals but different power and opportunities. If retail traders can execute any trading ideas in any time. We, as manipulators, need good volume. In order to buy 1 Bitcoin, we need someone who will sell us 1 Bitcoin. It's not a problem. But what if we need to buy 10 000 Bitcoins? 100 000 Bitcoins?? If we can’t get enough volume, we will have a good chance stay outside the market = we won't be able to make profit during a new bullish cycle.
CONDITIONS
During the previous bearish cycle, we could build long positions between $7 000 and $3 000 levels. The bullish cycle allowed us to make tons of money. In order to fix our profit, we sold our Bitcoins in the range between $70 000 and $30 000.
Now, we stay outside the market but with tons of cash and stable coins!
OUR GOALS
1. We have to build long positions at the true bottom.
2. We have to buy as many Bitcoins at the best price as possible
3. We have to do it BEFORE fundamental reasons will become bullish.
During the previous bearish cycle, we used FUD. It allowed us to take Bitcoins from retail traders. We kicked them from the market using dumps and long-term consolidations.
This time, retail traders are smart. They are not ready to swap their Bitcoins into fiat. They are ready to add even more Bitcoins if the price moves to $14 000 - 10 000. Many of retail traders think it will be the true bottom. So, they are ready to hold Bitcoins! They are ready to buy more Bitcoins at lower prices.
We, as manipulators, may face with the situation where we won't be able to buy enough Bitcoins. There won't be enough retail traders selling their Bitcoins.
THE MAIN QUESTION
What should we do to motivate retail traders sell their Bitcoins to us? We need good volume to build our long positions BEFORE a new bullish cycle. And we need the best price for our long positions.
How to be smarter than retail traders in 2022-2023???
Please, share in comments you ideas, playing for the Manipulators’ team. How would you reach 3 goals?

Bitcoin and US10Y-US02Y connectionUpdate on US10Y-US02Y
Compare RVGI indicator❌cross and Bitcoin
Still not a cross yet in the extreme area of this indicator that would mark a quite good entry for BTC
But the next cross for a possible Entry point is ahead dear Crypto Nation💥🚀😎
Let me know your thoughts in the comments🤗
⬇️⬇️⬇️
Likes and Follow for updates appreciated🤗
Disclaimer:
Not financial advice
Do your own research before investing
The content shared is for educational purposes only and is my personal opinion

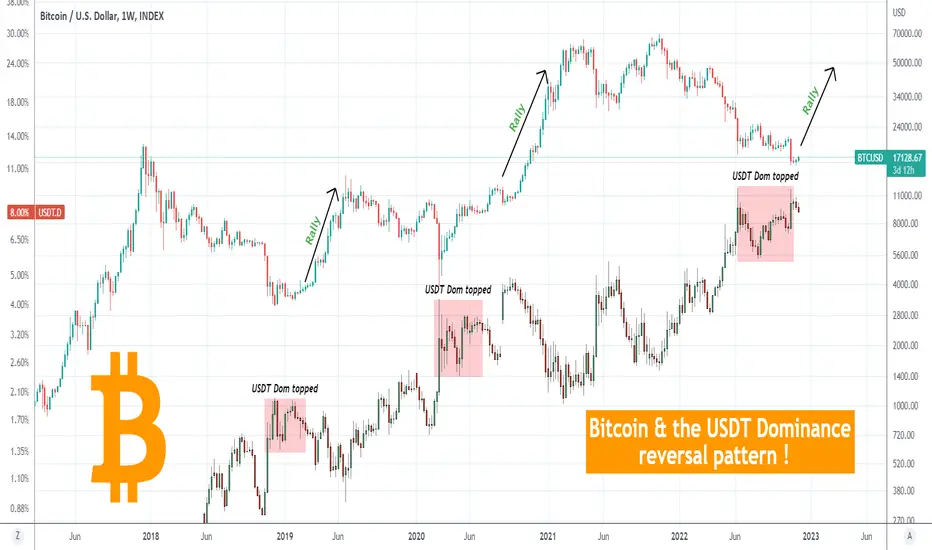
BITCOIN & the USDT Dominance point to a fast reversal!This is Bitcoin (BTCUSD) on the 1W time-frame drawn against the USDT dominance. For better comparison purposes both are displayed in candle bars, BTC being on top, USDT Dom at the bottom.
The essence of this comparison is to find a behavioral pattern that can help us estimate which phase of the Cycle BTC could be at. As you see, the USDT Dom is printing a pattern, technical top formation that has been previously associated with market bottoms on Bitcoin. In the past two weeks, the USDT Dom has started to pull-back and that very same sequence in July 2020 and February 2019 extended the drops, which was translated into an instant rally on Bitcoin. Even in the case of the August 31 2020 week and the injection that sent the USDT Dom (much) higher following the initial pull-back, the price quickly get back to its harmonized levels and fell back massively.
BTC has already started to react favorably to this 2-week USDT Dom pull-back. Do you think it can keep up this momentum and if this is indeed a USDT D. top are we ahead of a strong rally? Feel free to let me know in the comments section below!
-------------------------------------------------------------------------------
** Please LIKE 👍, SUBSCRIBE ✅, SHARE 🙌 and COMMENT ✍ if you enjoy this idea! Also share your ideas and charts in the comments section below! This is best way to keep it relevant, support me, keep the content here free and allow the idea to reach as many people as possible. **
-------------------------------------------------------------------------------
You may also TELL ME 🙋♀️🙋♂️ in the comments section which symbol you want me to analyze next and on which time-frame. The one with the most posts will be published tomorrow! 👏🎁
-------------------------------------------------------------------------------
💸💸💸💸💸💸
👇 👇 👇 👇 👇 👇
Bitcoin - A Bear Market Bottom?In this chart I note the completion of an Inverse Head and Shoulders pattern that and a bullish Inside Bar formation following the $15.5k low.
I consider the line of support offered within the Fibonacci Channel that has defined the entire Bitcoin bear market to date and wonder if this is not a natural bottom for Bitcoin.
What do you think? Is the bottom in? Or are we still yet to see the rug pulled again and new lows form?

Bitcoin short-term view - nice pump above $16,500Bitcoin short-term update
(a) BTC with nice breakout above $16,500 while volume increased
(b) bearish $15,460 from the table ATM
(c) consolidation to $16,500 likely IMO - RSI overbought
(d) bullish target $17,500-$18,000 to early yet
Have a great Day dear Crypto Nation
Let me know your thoughts in the comments🤗
⬇️⬇️⬇️
Likes and Follow for updates appreciated🤗
Disclaimer:
Not financial advice
Do your own research before investing
The content shared is for educational purposes only and is my personal opinion

Bitcoin ₿ollinger ₿and Expansion update🚨🚨🚨Bitcoin ₿ollinger ₿and Expansion update🚨🚨🚨
It was not a BTC direction prediction
No we see compression after expansion again🔵
Recognize on ₿ollinger ₿and Width:
🔴lower lows
🟠Expansion
🟢higher lows - when to expect❓🤔
Let me know your thoughts in the comments🤗
⬇️⬇️⬇️
Likes and Follow for updates appreciated🤗
Disclaimer:
Not financial advice
Do your own research before investing
The content shared is for educational purposes only and is my personal opinion

BITCOIN Weekly RSI has bottomed and leads the way to 19k first.This is Bitcoin (BTCUSD) on the 1W (weekly) time-frame. The focus is on the Bearish Megaphone that has been running since the April 12 2021 High, drawn on the weekly candle bodies, ignoring the wicks. This is the pattern that has been dominating the whole Bear Cycle since its beginning, with the October - November fake-out rally excluded as its was the peak of a stock market euphoria at the end of the post COVID quantitative easing.
As you see, since the FTX crash (November 07 2022 candle), BTC is trading sideways on the 3rd straight flat week ranging within 15550 - 17150. At the same time, the 1W RSI hit the top (Lower Highs trend-line) of the Bear Cycle's Falling Wedge, and has been rebounding. This could be an early indication that the long-term trend is shifting. On the short-term a potential rebound is limited to the Inner Lower Highs trend-line (dashed). The medium-term turns bullish only above the 1D MA200 (red trend-line), which has been intact for the whole year (since January 02 2022). If broken the medium-term targets are the 1W MA200 (orange trend-line) and 1W MA50 (blue trend-line).
On year-to-year basis, the target can be much higher. Look at how the current FTX Low was made on the -1.0 Fibonacci extension, counting from the first High and Low of the Bearish Megaphone. If the exact same symmetry plays out on the upside, then the 2.0 Fibonacci extension is located a little over $120000 (see chart below or narrow down the horizontal axis on the main chart).
Is this the start of a long-term bullish move for Bitcoin? Feel free to let me know in the comments section below!
-------------------------------------------------------------------------------
** Please LIKE 👍, SUBSCRIBE ✅, SHARE 🙌 and COMMENT ✍ if you enjoy this idea! Also share your ideas and charts in the comments section below! This is best way to keep it relevant, support me, keep the content here free and allow the idea to reach as many people as possible. **
-------------------------------------------------------------------------------
You may also TELL ME 🙋♀️🙋♂️ in the comments section which symbol you want me to analyze next and on which time-frame. The one with the most posts will be published tomorrow! 👏🎁
-------------------------------------------------------------------------------
💸💸💸💸💸💸
👇 👇 👇 👇 👇 👇

Bitcoin short-term view - BTC recovery fulfilledBitcoin short-term update
(a) BTC recovery to $16,500 as mentioned yesterday fulfilled
(b) might see some consolidation between SMA200 + EMA50 (4h) (yellow & blue line)
(c) breakout target $15,460 still in play
Have a great day dear Crypto Nation
Let me know your thoughts in the comments🤗
⬇️⬇️⬇️
Likes and Follow for updates appreciated🤗
Disclaimer:
Not financial advice
Do your own research before investing
The content shared is for educational purposes only and is my personal opinion

Bitcoin - BTC Hashrate trendline break👀Wow🚨
Look at BTC price when we got a Hashrate trendline break👀
What seems like bad news often turned out to be an early bullish indicator since prices were closer to the bottom than the top🚨
What are your thoughts dear Crypto Nation?
Let me know your thoughts in the comments🤗
⬇️⬇️⬇️
Likes and Follow for updates appreciated🤗
Disclaimer:
Not financial advice
Do your own research before investing
The content shared is for educational purposes only and is my personal opinion

Bitcoin short-term view - bearish breakout occurred🚨Bitcoin short-term update
Bearish breakout just occurred🚨
(a) BTC recovery to $16,500 likely - Bears like to confirm breakout
(b) breakout target as mentioned below $15,460
(c) RSI oversold - needs recovery
Have a great day dear Crypto Nation
Let me know your thoughts in the comments🤗
⬇️⬇️⬇️
Likes and Follow for updates appreciated🤗
Disclaimer:
Not financial advice
Do your own research before investing
The content shared is for educational purposes only and is my personal opinion

BITCOIN Targeting $18500 short-termSimple 1D time-frame analysis on Bitcoin (BTCUSD) showing that since the March 28 High, every drop was followed by a rebound to the 0.5 Fibonacci retracement level. Out of a total 3 occasions, in two of them the 0.5 Fib top matched by a 4H MA200 (orange trend-line) rejection.
Right the 4H MA200 is exactly on the 0.5 Fib at around $18500. Is that your short-term target? Feel free to let me know in the comments section below!
-------------------------------------------------------------------------------
** Please LIKE 👍, SUBSCRIBE ✅, SHARE 🙌 and COMMENT ✍ if you enjoy this idea! Also share your ideas and charts in the comments section below! This is best way to keep it relevant, support me, keep the content here free and allow the idea to reach as many people as possible. **
-------------------------------------------------------------------------------
You may also TELL ME 🙋♀️🙋♂️ in the comments section which symbol you want me to analyze next and on which time-frame. The one with the most posts will be published tomorrow! 👏🎁
-------------------------------------------------------------------------------
👇 👇 👇 👇 👇 👇
💸💸💸💸💸💸
👇 👇 👇 👇 👇 👇

Bitcoin: Too Early To Invest?No catalyst, no momentum, especially in the midst of holiday mode. Typically this time of year carries a general sense of optimism but is no where near as dramatic as a year ago and there is plenty of good reason for that. If you are confused by this, you are mostly likely viewing the market from the typical egocentric novice retail trader point of view. Stop trying to "think" or forecast where price will go. Instead embrace the fact that markets are mostly random, and are affected by many variables that are impossible to know (unless you are an insider). Focus two things: the context of the economic environment along with the intent presented by the general price structure.
Between context and price structure it is possible to gain a sense of what is reasonable in terms of momentum and RISK. The context has NOT changed for MONTHS. We have a hawkish FED, rates have yet to prove they are turning in a way that is more favorable to the markets. All while the broader price structure of Bitcoin continues to be BEARISH, especially in light of the new lower low recently established as a result of the unexpected FTX situation.
Note the levels on my chart. The 16,500 AREA is a mid point between the 18,500 range resistance and the 15,500 support. This is a highly random location where price can go either way equally over the short term. A recent sell signal from 16,300 was not able to follow through and unless a significant catalyst comes along, short squeezes are very possible. Maybe NFP will stimulate a reaction?
Either way, my swing trade plan is simple: WAIT for the 18,500 area resistance to be tested, followed by a setup. IF that opportunity presents itself, I am open to calling another short swing trade idea. Otherwise there is NOTHING to do here on this time frame. The risk is high either way.
As far as investing, while I am a proponent of taking small bites and accumulating inventory carefully over time, I think it is best to be very careful here. There is a lot of regulatory activity on the horizon and there is no way to know how it will affect Bitcoin. The alt coins are especially vulnerable to this which means accumulation of these should be even more conservative.
Since the break of 40K, I have not called one long swing trade, and I have been warning followers to take small bites because of the high RISK on the long side. The current situation still warns of high risk and levels as extreme as 14K, 10K or even 5K should be ACCOUNTED FOR. This is NOT a forecast, instead it is an important consideration in light of the economic context and price structure. Best advice I can offer: LISTEN TO PRICE NOT PEOPLE.
Thank you for considering my analysis and perspective. I hope you find it helpful.

Bitcoin Bull Market Support Bands 👀Bitcoin Bull Market Support Bands
Despite on false signal at Corona sell-off every cross above the Bands led to a great #bullish momentum for BTC 👀
What will you do when we see the next cross within the green investors zone🟢dear Crypto Nation❓
Let me know your thoughts in the comments🤗
⬇️⬇️⬇️
Likes and Follow for updates appreciated🤗
Disclaimer:
Not financial advice
Do your own research before investing
The content shared is for educational purposes only and is my personal opinion

BITCOIN 4H new bearish channel As we can see in the 4 -hour time frame, the descending channel is formed and if the area fails, we are likely to rise in price, otherwise the fall to the canal floor is not unexpected.
Attention: This is a short -term analysis in the 4H time frame.

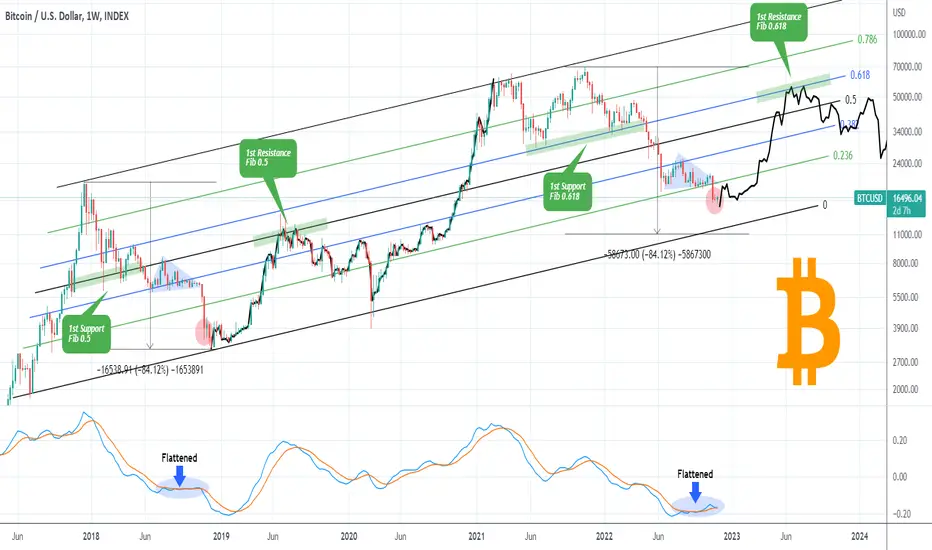
BITCOIN If this level holds, expect 50k on the next rally.This is an interesting finding on the 1W time-frame, showing Bitcoin (BTCUSD) within a Channel Up since December 2017 High (of the previous Cycle). Below we analyze frame by frame the similarities and differences, key pressure levels and how those can make a projection for the following months.
** Triangle.. then flush **
A key component of this is the pattern that preceded the FTX crash. As you see that was a Triangle (blue), with the FTX crash displayed by the strong 1W red candle that followed. Before that crash, the price was effectively supported on the 0.236 Fibonacci level. The very same Triangle was seen on the 2018 Bear Cycle, up until the week of November 12 2018. Two strong 1W red candles followed, which after a rather flat green, gave way to another two red weeks that priced the bottom. Notice that during both Triangles, the 1W LMACD flattened.
So far following the FTX candle, we've had another (flat) red and this week (so far) a green one. Relative to the 2018 fractal, the price should be proportionately positioned where the red circle is. This implicates that after the green 1W candle, another two red ones should follow and the bottom will be in.
How far those final red candles can go is anyone's guess but if they follow the (not so strong compared to 2018) FTX candle or even more so the flat 2nd red week that followed, then they could be rather limited in extent. This however goes in contrast to the total correction of the 2018 Bear Cycle, which was approximately -84%. A repeat of that magnitude would put BTC below the bottom (Higher Lows trend-line) of this long-term Channel Up, but the same took place on the week of March 09 2020, with the COVID flash crash, which broke the Channel's bottom rapidly on a wick and then rebounded almost instantly.
** The 1st Support - 1st Resistance pattern **
Another important aspect of this Channel is where the price had its 1st Support after the Top was made and the Bear Cycle started and where it found its 1st Resistance after the bottom and the start of the new Bull Cycle.
In early 2018, BTC had the 0.5 Fibonacci level as the 1st Support level that contained the downfall before the eventual sell-off to the Triangle. In 2021/22, that 1st Support level was on the 0.618 Fib. In 2019 the 1st Resistance level that put a stop to the first rally on the new Bull Cycle was again Fib 0.5, displaying a perfect symmetry. If the same pattern is continued, then the initial rally that will follow in the new Bull Cycle, should stop on the 0.618 Fib, i.e. slightly above $50000.
For a more effective comparison, we have plotted the 2019/20 sequence (black trend-line) on today's price action onwards. Not surprisingly, it is rejected on the 0.618 Fibonacci level, a little over $50k. That is of course, assuming that the next two weekly (1W) candles will be not as aggressive as in late 2018. If they are and the bottom of the Channel is hit, we can expect a bottom within $13000 - 12000.
Do you think we are very close to pricing the bottom and if so, is this model correct to predict 50k on the next rally? Feel free to let me know in the comments section below!
-------------------------------------------------------------------------------
** Please LIKE 👍, SUBSCRIBE ✅, SHARE 🙌 and COMMENT ✍ if you enjoy this idea! Also share your ideas and charts in the comments section below! This is best way to keep it relevant, support me, keep the content here free and allow the idea to reach as many people as possible. **
-------------------------------------------------------------------------------
You may also TELL ME 🙋♀️🙋♂️ in the comments section which symbol you want me to analyze next and on which time-frame. The one with the most posts will be published tomorrow! 👏🎁
-------------------------------------------------------------------------------
👇 👇 👇 👇 👇 👇
💸💸💸💸💸💸
👇 👇 👇 👇 👇 👇
Bitcoin - BTC Trix indicator❌Bitcoin
We see a momentum drift on the TRIX indicator sponsored by FTX misery🚨
If BTC gets more bearish pressure the indicator points❌might get in the support zone again - unlikely IMO
Stay long-term BULLISH dear Crypto Nation😉
Let me know your thoughts in the comments🤗
⬇️⬇️⬇️
Likes and Follow for updates appreciated🤗
Disclaimer:
Not financial advice
Do your own research before investing
The content shared is for educational purposes only and is my personal opinion

BITCOIN $19000 and the importance of the Channel's medianSince the May 31 High and the subsequent sell-off, Bitcoin (BTCUSD) has been trading within a Channel Down pattern. We've plotted the Fibonacci retracement levels and the +/- 0.5 upper and lower extensions, in order to see potential pressure points/ levels.
As you see, the Channel's median (Fibonacci 0.5) has been dominating the price action with six so far (including the one three days ago) touches, all of which initiated rebounds. The 1D RSI and MACD (Bullish Cross) sequences indicate that the current consolidation on Fib 0.5 resembles that of August 28 - September 07. That pattern fueled a rebound that stopped just above the 1D MA50 (blue trend-line) and the 0.786 Fib. As long as the 0.5 Fib holds, the short-term target is the 0.786 Fib.
It is worth mentioning that the 1D MA200 (orange trend-line), unbroken since December 31 2021, is now closer than even to the Channel Down. A closing above it can potentially test the 1.5 Fibonacci extension of the Channel. On the other hand, two closing in a row below the 0.5, can target instantly the 0.236 Fib, even the bottom of the Channel.
Which way do you think Bitcoin will break to first? Top or Bottom of the Channel? Feel free to let me know in the comments section below!
-------------------------------------------------------------------------------
** Please LIKE 👍, SUBSCRIBE ✅, SHARE 🙌 and COMMENT ✍ if you enjoy this idea! Also share your ideas and charts in the comments section below! This is best way to keep it relevant, support me, keep the content here free and allow the idea to reach as many people as possible. **
-------------------------------------------------------------------------------
You may also TELL ME 🙋♀️🙋♂️ in the comments section which symbol you want me to analyze next and on which time-frame. The one with the most posts will be published tomorrow! 👏🎁
-------------------------------------------------------------------------------
👇 👇 👇 👇 👇 👇
💸💸💸💸💸💸
👇 👇 👇 👇 👇 👇

Bitcoin: Massive Logarithmic Curve Chart is self explanatory. I can see a low of around 13k - 15k with the next top around 120k - 150k.
This sell-off took many people by surprise. This is mostly due to the federal reserve and monetary policies, but don't panic.

Btc plan for 2024-2025This analysis is based on Gann’s science to determine price targets in terms of time and price. It is expected to rise to 48000 levels first for confirmation, and then the first target at 87000 and the second target at 110000. Please trade with caution - fluctuation may occur
Until 12 - 12 - 2022
(This analysis is canceled by fraction number 5400)
Be safe

Bitcoin short-term view - recovery as predictedBitcoin short-term update - 1h chart
(a) BTC at price resistance $16,500
(b) SMA200 + EMA50 (4h chart) accumulated resistances
(c) RSI overbought
(d) 2nd leg to $15,460 likely
(e) next bullish target $18,000
Have a great day dear Crypto Nation
Let me know your thoughts in the comments🤗
⬇️⬇️⬇️
Likes and Follow for updates appreciated🤗
Disclaimer:
Not financial advice
Do your own research before investing
The content shared is for educational purposes only and is my personal opinion

BITCOIN Huge volume signaling the end of the Bear Market?Two weeks ago, we saw the strongest weekly volume in more than a year, fueled by the collapse of FTX. This is a good opportunity to historically examine the effect of such huge volume spikes on Bitcoin (BTCUSD).
On this 1W chart, we see that such volume spikes tend to be associated with trend reversals on BTC. In recent price action in particular, we've had a similar volume spike on June 13 2022. Practically same volume spikes between a 5 month period. As this chart shows, volume spikes of such a period or shorter have historically been either Bottom or Top formations.
The previous such volume pattern was between January 11 2021 - May 17 2021 and was the formation of the Bull Cycle Top. The one before was between November 19 2018 - May 13 2019 and was the bottom formation of the Bear Cycle. Before that we've had the Bull Cycle Top formation of the December 18 2017 - February 05 2018 volume spikes. Finally the Bottom formation of the 2014/15 Bear Cycle was made on the January 12 2015 - November 02 2015 spikes.
The latter is the pattern that has the most similarities with the current one (June 13 - November 07 2022) as there is a Lower Highs (Bottom) trend-line involved. Can the November 07 volume spike be the moment that gives the trend reversal to bullish and get Bitcoin out of this two year Bear Cycle or is it simply a short-term rebound at best like the June 13 2022 and February 05 2018 volume spikes?
Feel free to let me know in the comments section below!
-------------------------------------------------------------------------------
** Please LIKE 👍, SUBSCRIBE ✅, SHARE 🙌 and COMMENT ✍ if you enjoy this idea! Also share your ideas and charts in the comments section below! This is best way to keep it relevant, support me, keep the content here free and allow the idea to reach as many people as possible. **
-------------------------------------------------------------------------------
You may also TELL ME 🙋♀️🙋♂️ in the comments section which symbol you want me to analyze next and on which time-frame. The one with the most posts will be published tomorrow! 👏🎁
-------------------------------------------------------------------------------
👇 👇 👇 👇 👇 👇
💸💸💸💸💸💸
👇 👇 👇 👇 👇 👇
