BITCOIN Targeting $18500 short-termSimple 1D time-frame analysis on Bitcoin (BTCUSD) showing that since the March 28 High, every drop was followed by a rebound to the 0.5 Fibonacci retracement level. Out of a total 3 occasions, in two of them the 0.5 Fib top matched by a 4H MA200 (orange trend-line) rejection.
Right the 4H MA200 is exactly on the 0.5 Fib at around $18500. Is that your short-term target? Feel free to let me know in the comments section below!
-------------------------------------------------------------------------------
** Please LIKE 👍, SUBSCRIBE ✅, SHARE 🙌 and COMMENT ✍ if you enjoy this idea! Also share your ideas and charts in the comments section below! This is best way to keep it relevant, support me, keep the content here free and allow the idea to reach as many people as possible. **
-------------------------------------------------------------------------------
You may also TELL ME 🙋♀️🙋♂️ in the comments section which symbol you want me to analyze next and on which time-frame. The one with the most posts will be published tomorrow! 👏🎁
-------------------------------------------------------------------------------
👇 👇 👇 👇 👇 👇
💸💸💸💸💸💸
👇 👇 👇 👇 👇 👇
Bitcoin-btcusd-btc

Bitcoin: Too Early To Invest?No catalyst, no momentum, especially in the midst of holiday mode. Typically this time of year carries a general sense of optimism but is no where near as dramatic as a year ago and there is plenty of good reason for that. If you are confused by this, you are mostly likely viewing the market from the typical egocentric novice retail trader point of view. Stop trying to "think" or forecast where price will go. Instead embrace the fact that markets are mostly random, and are affected by many variables that are impossible to know (unless you are an insider). Focus two things: the context of the economic environment along with the intent presented by the general price structure.
Between context and price structure it is possible to gain a sense of what is reasonable in terms of momentum and RISK. The context has NOT changed for MONTHS. We have a hawkish FED, rates have yet to prove they are turning in a way that is more favorable to the markets. All while the broader price structure of Bitcoin continues to be BEARISH, especially in light of the new lower low recently established as a result of the unexpected FTX situation.
Note the levels on my chart. The 16,500 AREA is a mid point between the 18,500 range resistance and the 15,500 support. This is a highly random location where price can go either way equally over the short term. A recent sell signal from 16,300 was not able to follow through and unless a significant catalyst comes along, short squeezes are very possible. Maybe NFP will stimulate a reaction?
Either way, my swing trade plan is simple: WAIT for the 18,500 area resistance to be tested, followed by a setup. IF that opportunity presents itself, I am open to calling another short swing trade idea. Otherwise there is NOTHING to do here on this time frame. The risk is high either way.
As far as investing, while I am a proponent of taking small bites and accumulating inventory carefully over time, I think it is best to be very careful here. There is a lot of regulatory activity on the horizon and there is no way to know how it will affect Bitcoin. The alt coins are especially vulnerable to this which means accumulation of these should be even more conservative.
Since the break of 40K, I have not called one long swing trade, and I have been warning followers to take small bites because of the high RISK on the long side. The current situation still warns of high risk and levels as extreme as 14K, 10K or even 5K should be ACCOUNTED FOR. This is NOT a forecast, instead it is an important consideration in light of the economic context and price structure. Best advice I can offer: LISTEN TO PRICE NOT PEOPLE.
Thank you for considering my analysis and perspective. I hope you find it helpful.

Bitcoin Bull Market Support Bands 👀Bitcoin Bull Market Support Bands
Despite on false signal at Corona sell-off every cross above the Bands led to a great #bullish momentum for BTC 👀
What will you do when we see the next cross within the green investors zone🟢dear Crypto Nation❓
Let me know your thoughts in the comments🤗
⬇️⬇️⬇️
Likes and Follow for updates appreciated🤗
Disclaimer:
Not financial advice
Do your own research before investing
The content shared is for educational purposes only and is my personal opinion

BITCOIN 4H new bearish channel As we can see in the 4 -hour time frame, the descending channel is formed and if the area fails, we are likely to rise in price, otherwise the fall to the canal floor is not unexpected.
Attention: This is a short -term analysis in the 4H time frame.

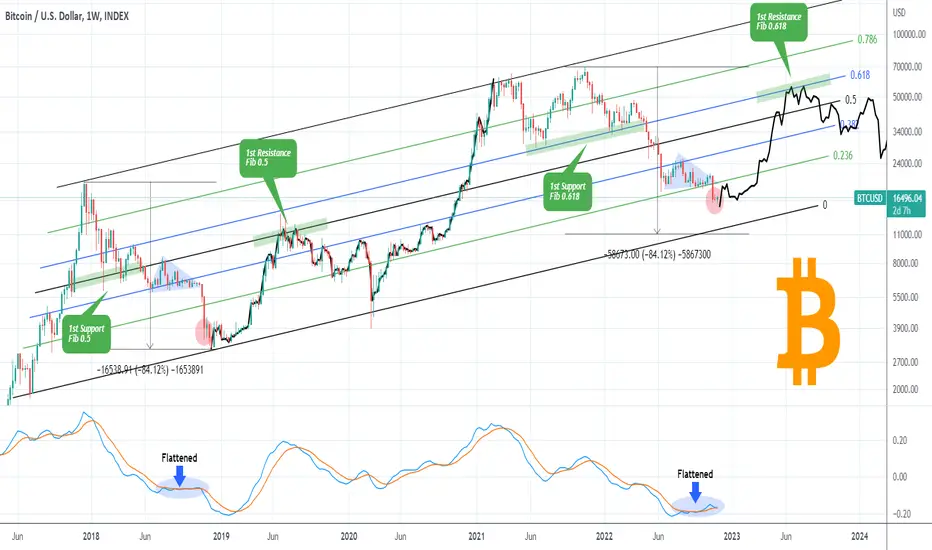
BITCOIN If this level holds, expect 50k on the next rally.This is an interesting finding on the 1W time-frame, showing Bitcoin (BTCUSD) within a Channel Up since December 2017 High (of the previous Cycle). Below we analyze frame by frame the similarities and differences, key pressure levels and how those can make a projection for the following months.
** Triangle.. then flush **
A key component of this is the pattern that preceded the FTX crash. As you see that was a Triangle (blue), with the FTX crash displayed by the strong 1W red candle that followed. Before that crash, the price was effectively supported on the 0.236 Fibonacci level. The very same Triangle was seen on the 2018 Bear Cycle, up until the week of November 12 2018. Two strong 1W red candles followed, which after a rather flat green, gave way to another two red weeks that priced the bottom. Notice that during both Triangles, the 1W LMACD flattened.
So far following the FTX candle, we've had another (flat) red and this week (so far) a green one. Relative to the 2018 fractal, the price should be proportionately positioned where the red circle is. This implicates that after the green 1W candle, another two red ones should follow and the bottom will be in.
How far those final red candles can go is anyone's guess but if they follow the (not so strong compared to 2018) FTX candle or even more so the flat 2nd red week that followed, then they could be rather limited in extent. This however goes in contrast to the total correction of the 2018 Bear Cycle, which was approximately -84%. A repeat of that magnitude would put BTC below the bottom (Higher Lows trend-line) of this long-term Channel Up, but the same took place on the week of March 09 2020, with the COVID flash crash, which broke the Channel's bottom rapidly on a wick and then rebounded almost instantly.
** The 1st Support - 1st Resistance pattern **
Another important aspect of this Channel is where the price had its 1st Support after the Top was made and the Bear Cycle started and where it found its 1st Resistance after the bottom and the start of the new Bull Cycle.
In early 2018, BTC had the 0.5 Fibonacci level as the 1st Support level that contained the downfall before the eventual sell-off to the Triangle. In 2021/22, that 1st Support level was on the 0.618 Fib. In 2019 the 1st Resistance level that put a stop to the first rally on the new Bull Cycle was again Fib 0.5, displaying a perfect symmetry. If the same pattern is continued, then the initial rally that will follow in the new Bull Cycle, should stop on the 0.618 Fib, i.e. slightly above $50000.
For a more effective comparison, we have plotted the 2019/20 sequence (black trend-line) on today's price action onwards. Not surprisingly, it is rejected on the 0.618 Fibonacci level, a little over $50k. That is of course, assuming that the next two weekly (1W) candles will be not as aggressive as in late 2018. If they are and the bottom of the Channel is hit, we can expect a bottom within $13000 - 12000.
Do you think we are very close to pricing the bottom and if so, is this model correct to predict 50k on the next rally? Feel free to let me know in the comments section below!
-------------------------------------------------------------------------------
** Please LIKE 👍, SUBSCRIBE ✅, SHARE 🙌 and COMMENT ✍ if you enjoy this idea! Also share your ideas and charts in the comments section below! This is best way to keep it relevant, support me, keep the content here free and allow the idea to reach as many people as possible. **
-------------------------------------------------------------------------------
You may also TELL ME 🙋♀️🙋♂️ in the comments section which symbol you want me to analyze next and on which time-frame. The one with the most posts will be published tomorrow! 👏🎁
-------------------------------------------------------------------------------
👇 👇 👇 👇 👇 👇
💸💸💸💸💸💸
👇 👇 👇 👇 👇 👇
Bitcoin - BTC Trix indicator❌Bitcoin
We see a momentum drift on the TRIX indicator sponsored by FTX misery🚨
If BTC gets more bearish pressure the indicator points❌might get in the support zone again - unlikely IMO
Stay long-term BULLISH dear Crypto Nation😉
Let me know your thoughts in the comments🤗
⬇️⬇️⬇️
Likes and Follow for updates appreciated🤗
Disclaimer:
Not financial advice
Do your own research before investing
The content shared is for educational purposes only and is my personal opinion

BITCOIN $19000 and the importance of the Channel's medianSince the May 31 High and the subsequent sell-off, Bitcoin (BTCUSD) has been trading within a Channel Down pattern. We've plotted the Fibonacci retracement levels and the +/- 0.5 upper and lower extensions, in order to see potential pressure points/ levels.
As you see, the Channel's median (Fibonacci 0.5) has been dominating the price action with six so far (including the one three days ago) touches, all of which initiated rebounds. The 1D RSI and MACD (Bullish Cross) sequences indicate that the current consolidation on Fib 0.5 resembles that of August 28 - September 07. That pattern fueled a rebound that stopped just above the 1D MA50 (blue trend-line) and the 0.786 Fib. As long as the 0.5 Fib holds, the short-term target is the 0.786 Fib.
It is worth mentioning that the 1D MA200 (orange trend-line), unbroken since December 31 2021, is now closer than even to the Channel Down. A closing above it can potentially test the 1.5 Fibonacci extension of the Channel. On the other hand, two closing in a row below the 0.5, can target instantly the 0.236 Fib, even the bottom of the Channel.
Which way do you think Bitcoin will break to first? Top or Bottom of the Channel? Feel free to let me know in the comments section below!
-------------------------------------------------------------------------------
** Please LIKE 👍, SUBSCRIBE ✅, SHARE 🙌 and COMMENT ✍ if you enjoy this idea! Also share your ideas and charts in the comments section below! This is best way to keep it relevant, support me, keep the content here free and allow the idea to reach as many people as possible. **
-------------------------------------------------------------------------------
You may also TELL ME 🙋♀️🙋♂️ in the comments section which symbol you want me to analyze next and on which time-frame. The one with the most posts will be published tomorrow! 👏🎁
-------------------------------------------------------------------------------
👇 👇 👇 👇 👇 👇
💸💸💸💸💸💸
👇 👇 👇 👇 👇 👇

Bitcoin: Massive Logarithmic Curve Chart is self explanatory. I can see a low of around 13k - 15k with the next top around 120k - 150k.
This sell-off took many people by surprise. This is mostly due to the federal reserve and monetary policies, but don't panic.

Btc plan for 2024-2025This analysis is based on Gann’s science to determine price targets in terms of time and price. It is expected to rise to 48000 levels first for confirmation, and then the first target at 87000 and the second target at 110000. Please trade with caution - fluctuation may occur
Until 12 - 12 - 2022
(This analysis is canceled by fraction number 5400)
Be safe

Bitcoin short-term view - recovery as predictedBitcoin short-term update - 1h chart
(a) BTC at price resistance $16,500
(b) SMA200 + EMA50 (4h chart) accumulated resistances
(c) RSI overbought
(d) 2nd leg to $15,460 likely
(e) next bullish target $18,000
Have a great day dear Crypto Nation
Let me know your thoughts in the comments🤗
⬇️⬇️⬇️
Likes and Follow for updates appreciated🤗
Disclaimer:
Not financial advice
Do your own research before investing
The content shared is for educational purposes only and is my personal opinion

BITCOIN Huge volume signaling the end of the Bear Market?Two weeks ago, we saw the strongest weekly volume in more than a year, fueled by the collapse of FTX. This is a good opportunity to historically examine the effect of such huge volume spikes on Bitcoin (BTCUSD).
On this 1W chart, we see that such volume spikes tend to be associated with trend reversals on BTC. In recent price action in particular, we've had a similar volume spike on June 13 2022. Practically same volume spikes between a 5 month period. As this chart shows, volume spikes of such a period or shorter have historically been either Bottom or Top formations.
The previous such volume pattern was between January 11 2021 - May 17 2021 and was the formation of the Bull Cycle Top. The one before was between November 19 2018 - May 13 2019 and was the bottom formation of the Bear Cycle. Before that we've had the Bull Cycle Top formation of the December 18 2017 - February 05 2018 volume spikes. Finally the Bottom formation of the 2014/15 Bear Cycle was made on the January 12 2015 - November 02 2015 spikes.
The latter is the pattern that has the most similarities with the current one (June 13 - November 07 2022) as there is a Lower Highs (Bottom) trend-line involved. Can the November 07 volume spike be the moment that gives the trend reversal to bullish and get Bitcoin out of this two year Bear Cycle or is it simply a short-term rebound at best like the June 13 2022 and February 05 2018 volume spikes?
Feel free to let me know in the comments section below!
-------------------------------------------------------------------------------
** Please LIKE 👍, SUBSCRIBE ✅, SHARE 🙌 and COMMENT ✍ if you enjoy this idea! Also share your ideas and charts in the comments section below! This is best way to keep it relevant, support me, keep the content here free and allow the idea to reach as many people as possible. **
-------------------------------------------------------------------------------
You may also TELL ME 🙋♀️🙋♂️ in the comments section which symbol you want me to analyze next and on which time-frame. The one with the most posts will be published tomorrow! 👏🎁
-------------------------------------------------------------------------------
👇 👇 👇 👇 👇 👇
💸💸💸💸💸💸
👇 👇 👇 👇 👇 👇


Bitcoin short-term view - recovery likelyBitcoin short-term view
(a) BTC with a perfect touch of volume support $15,460
(b) bullish divergence seems to occur
(c) lower support $13,969 unlikely for today
(d) recovery to $16,500 possible
Have a great day dear Crypto Nation😎
Let me know your thoughts in the comments🤗
⬇️⬇️⬇️
Likes and Follow for updates appreciated🤗
Disclaimer:
Not financial advice
Do your own research before investing
The content shared is for educational purposes only and is my personal opinion

BITCOIN 3H Bearish again? According to the chart, we are on an important support area, and if this area breaks, I have the possibility of falling further on the trend line. Otherwise, I have the possibility of increasing the price to the resistance zone.
Its not Buy or Sell SIGNAL
DYOR
BY : M.TeriZ - @AtonicShark

#Bitcoin bear market Bottom 2022THE WAVES OUT THERE ARE NOT ELLIOT WAVES ....
i always talk about the semilarity between 2014 bear market and 2022 bear market until this moment everything seems normal for me. i JUST dont care about the news i can see all of them at the chart ...just relaxe and look at these levels ... the bottom is around... may we see the last capitulation candle any time stronge Volume Panic Sell ...the last shake out will be just as it is ... my orders are ready at 13k/11k/ and worst case senario is around 9300 levels as flash out and close above 11 k .
whene the price break the bottom of the wave 3 in 2014 bear market the price stopped goin lower for a week in the same percentage low -78% from the peak ... this is the same percentage whene the price stopped this previous week at 15500... -77.5% lower from the peak and now the -40% is missing im waiting for it ...

Bitcoin ₿ollinger ₿and Expansion as predicted 🚨🚨🚨Bitcoin ₿ollinger ₿and Expansion as predicted 2nd half of November🚨🚨🚨
It was not a BTC direction prediction
No we see huge expansion after compression
Recognize on ₿ollinger ₿and Width:
🔴lower lows
🟠Expansion
🟢higher lows
Let me know your thoughts in the comments🤗
⬇️⬇️⬇️
Likes and Follow for updates appreciated🤗
Disclaimer:
Not financial advice
Do your own research before investing
The content shared is for educational purposes only and is my personal opinion

Bitcoin short-term viewBitcoin short-term view
(a) BTC lost $16,500 after spending much time here
(b) next lower volume support at $15,460
(c) if we get above $16,500 again the volume resistance $18,000 is our next #bullish target
Have a great Day dear Crypto Nation🤗😎
Let me know your thoughts in the comments🤗
⬇️⬇️⬇️
Likes and Follow for updates appreciated🤗
Disclaimer:
Not financial advice
Do your own research before investing
The content shared is for educational purposes only and is my personal opinion

Bitcoin in connection to Home Sales 🚨🚨Update:
Bitcoin in connection to Home Sales
We just saw a channel break dear Crypto Nation - last time seen at Corona sell-off🚨🚨
If Home Sales find the way back into the channel BTC might recover as well
Let me know your thoughts in the comments🤗
⬇️⬇️⬇️
Likes and Follow for updates appreciated🤗
Disclaimer:
Not financial advice
Do your own research before investing
The content shared is for educational purposes only and is my personal opinion

BITCOIN The Fib-Dollar Cheat sheet says the bottom is formedThis analysis is centered around Bitcoin's (BTCUSD) Halvings and their important to the market due to the supply shock they fundamentally deal and have done so historically and the U.S. Dollar Index (DXY being the green trend-line). On this 1W time-frame, we've applied time and horizontal Fibonacci levels on each Halving Cycle, from start to end, to classify the different phases that BTC has traded and determine where we are at now (always based on the model).
** The Time Fibonacci levels **
As you see, the price tends to rally aggressively after each Halving (Fib 0.0) until Fib 0.236. We classify this as the Parabolic Phase.
From Fib 0.236 to 0.382, BTC tends to make the final rally and forms its Cycle Top. We classify this as the Top formation.
From Fib 0.382 to 0.5, BTC has officially entered Bear Market territory. We classify this as the Bear Phase.
From Fib 0.5 to 0.618, BTC is in the final staged of the Bear Cycle, preparing for its last (and most aggressive) fall. We classify this as the Despair Phase.
From Fib 0.618 to 0.786, BTC traditionally forms the Bottom of the Cycle, signaling the end of the Bear Market. We call this the Bottom formation phase.
From Fib 0.786 to 1.0 (next Halving), BTC officially starts the new Bull Market. Categorization: Bull.
** The horizontal Fibonacci levels **
Those are measured from the bottom of the Halving candle to the top of each Cycle. Those are mostly useful in calculating a potential bottom level. The first Cycle bottomed after the 0.382 Fib broke. The second Cycle bottomed after the 0.5 Fib broke (a Fib level lower than the previous Cycle), while the current Cycle has already broken Fib 0.618 (a Fib level lower than the previous Cycle).
Not surprisingly, this recent (FTX led) low is timed right within the 'Bottom formation' Phase (blue zone). In the 2018/19 Cycle, the price rebounded relatively early after the 'Bottom formation' Low, while in 2014/15 in did so towards its end. The phase's end is in May 2023.
** The Dollar's importance **
Among all the Fibs and classifications, the USD Index (DXY) plays its own highly important role during BTC's Cycles. Right now the DXY has been on a +1 month (aggressive) decline. Typically, as it is valued in USD, Bitcoin tends to rise when the DXY falls. The stop of USD's previous run was in March 2020, right on the COVID crash. What Bitcoin did then was bottom out and start the 2020/21 Parabolic rally. The previous USD top was on December 2016, when again Bitcoin was in its 'Parabolic Phase'. The USD's previous top was in March 2015, right at the start of the 2015 'Bottom formation' phase.
From all the about, we could reach a (always with a certain degree of error/risk) conclusion that the combination of a new (fundamentally led/ FTX) Low within the "Bottom formation" phase of this Halving Cycle, while the DXY is dropping aggressively, could be Bitcoin's new bottom. Whether the price rebounds now as in 2019 or twards the end of the phase as in 2015, it remains to be seen, and certainly depends on a lot of variable factors, most of which fundamental. Stability in the stock market is definitely among the top ones.
But what do you think? Has Bitcoin priced its new Cycle Bottom as this Halving model suggest, especially if the DXY is starting a new long-term decline? Or the global fundamentals are so strong that it will be invalidated? Feel free to let me know in the comments section below!
-------------------------------------------------------------------------------
** Please LIKE 👍, SUBSCRIBE ✅, SHARE 🙌 and COMMENT ✍ if you enjoy this idea! Also share your ideas and charts in the comments section below! This is best way to keep it relevant, support me, keep the content here free and allow the idea to reach as many people as possible. **
-------------------------------------------------------------------------------
You may also TELL ME 🙋♀️🙋♂️ in the comments section which symbol you want me to analyze next and on which time-frame. The one with the most posts will be published tomorrow! 👏🎁
-------------------------------------------------------------------------------
👇 👇 👇 👇 👇 👇
💸💸💸💸💸💸
👇 👇 👇 👇 👇 👇

Bitcoin: Where's The Bottom?Bitcoin price is now consolidating between the 15K and 18K range. The 18,500 range high has established another lower high in the context of the bigger picture. As long as this level stays intact, it would be unreasonable to expect a spectacular bullish outcome ANY TIME SOON. What is reasonable? A test of the 14K to 12K support area.
In one of my recent streams, a troll with nothing better to do accused me of being a perma bear. The reality is, I am a Bitcoin bull, but I do NOT let my opinions get in the way of market intent. All of my articles and streams since June have had a bearish bias, simply because long term price structure and economic context favored and continue to favor a BEARISH OUTCOME. My extremely simple "less is more" market view has helped me to avoid the FTX situation (which NO ONE saw coming), and from accumulating any meaningful inventory too early. All while being completely ignorant of news, rumors, fake gurus, Twitter, and other mainstream nonsense that motivates the retail trader.
I am a believer in the idea that price factors all the known information in the world at any given moment. And right now, price structure and economic context continue to point to lower prices. The 18,500 resistance has been established as a new lower high and 20K has been completely compromised. This puts the 14K to 12K support in play which means these levels should be accounted for in terms of RISK. IF this price structure maintains itself, a test of lows is favored, but just keep in mind, that does not guarantee price WILL test these levels. There is NO way to be CERTAIN where price will go next. The best we can do is estimate risk and then determine how we want to interact with that risk. Anyone that pretends to know the future is exposing themselves as a novice, while attempting to capitalize on your ignorance.
In my precious article I pointed out the 16,300 break will activate a new sell signal which has been in play but lacks follow through. Price is not likely to move until a new catalyst surprises the market, especially in light of the holiday week on the horizon. While the short side still offers potential, the current level carries a lot of squeeze risk. The more conservative choice would be to WAIT for a signal to appear upon the test of the 18K resistance. Short squeezes happen but should not be confused with a trend reversal. Do not react. Gauge your probabilities and assess your risk. Prepare in advance for these scenarios.
Thank you for considering my analysis and perspective. I hope you find it helpful.

Bitcoin - timing scenario percentage🔵and time⚫️Bitcoin
Using RSI & SMA delta Indicator by MarcoValente (changed settings)..
.. BTC might be on the outlet of the bear market
Using the average of pre-gains in percentage🔵and time⚫️..
..we might have to be more patient dear Crypto Nation
Let me know your thoughts in the comments🤗
⬇️⬇️⬇️
Likes and Follow for updates appreciated🤗
Disclaimer:
Not financial advice
Do your own research before investing
The content shared is for educational purposes only and is my personal opinion

BITCOIN Bearish Bias! Sell!
Hello,Traders!
BITCOIN is trading in a narrowing wedge
And I am somewhat bearish biased
So IF we see a bearish breakout
Then a bearish continuation will follow
Sell!
Like, comment and subscribe to boost your trading!
See other ideas below too!

BITCOIN Strongest sell signal since 2021! This time's different?Those who follow our channel for long, know that we like to look into Bitcoin (BTCUSD) on many different time-frames for a more all-around perspective. The 3D time-frame is one of the most accurate for long-term price projections and this time is no different as since last week its MACD formed a Bearish Cross.
As you see, since March 2021 we've had this formation another four times, all of which delivered a new Low. The September 16 2021 Cross was limited to 'only' a -18% drop but the other three delivered enormous -50%, -52% and -57% drops. A 'standard' (according to this model) -50% drop from today's Bearish Cross' candle would push the price down to a little below the $10000 barrier, a huge psychological level undoubtedly. Add to the mix that BTC got rejected on its 3D MA50 (blue trend-line) same it did in late March/ early April 2022 before the last MACD Bearish Cross and the -57% drop.
Now, what's different this time? The only parameter that differs is that in the past four events, the build-up to the Bearish Crosses was a Channel Up. This time it was a Channel Down. How important can that be and whether it can cause the opposite outcome (a rise), it remains to be seen. A good indication that this time it might be different would be if the price breaks above the Channel Down, thus the 3D MA50 (currently at 20386) as well.
What do you think? Are we about to see Bitcoin at $10k in the next 2 months or does the Channel Down signal the end of this bearish model? Feel free to let me know in the comments section below!
-------------------------------------------------------------------------------
** Please LIKE 👍, SUBSCRIBE ✅, SHARE 🙌 and COMMENT ✍ if you enjoy this idea! Also share your ideas and charts in the comments section below! This is best way to keep it relevant, support me, keep the content here free and allow the idea to reach as many people as possible. **
-------------------------------------------------------------------------------
You may also TELL ME 🙋♀️🙋♂️ in the comments section which symbol you want me to analyze next and on which time-frame. The one with the most posts will be published tomorrow! 👏🎁
-------------------------------------------------------------------------------
👇 👇 👇 👇 👇 👇
💸💸💸💸💸💸
👇 👇 👇 👇 👇 👇
