Crypto could get UGLY3 weeks ago we saw fakeout from major bear edge getting sent down to slide the edge until a minor uptrend was established
Now seeing this minor uptrend rejected on the parent downtrend resistance we can see that this downtrend's support and bear edge form an average level at the June low support
This level also matches the downtrend fib extension 1.618
What is most alarming is the latest rejection can also be interpreted as confirmation of 786 fib extension and intent for full extension...
taking the optimistic doom case we can expect ~20% down on total crypto cap
full doom call would be full extension ~40% down
Bitcoin-btcusd-btc

Bitcoin lost $18,435 since 102 weeks🚨🚨🚨Bitcoin lost $18,435 since 102 weeks🚨🚨🚨
But what next for BTC dear Crypto Nation❓
Considering the volume profile and LogFIB...
BULLISH🟢
price reclaims $18,435 and goes higher
more likely🟠
price founds support at $13,696 at FIB50%
Bearish🔴
price even loses $13,696
Let me know your thoughts in the comments🤗
⬇️⬇️⬇️
Likes and Follow for updates appreciated🤗
Disclaimer:
Not financial advice
Do your own research before investing
The content shared is for educational purposes only and is my personal opinion

Bitcoin: 14K Support In Range?Great lessons to learn about risk, perception and how easily the herd is mislead in the most deceptive industry in the world thanks to FTX. Were you exposed to this unexpected event risk? My recent sell signal (mentioned here) from 20,250 reached its profit target and then some. Price is now within the 17K to 14K support zone which I have been accounting for since June (read my previous articles).
I don't short Bitcoin, and I am not about to start, but I share the trade ideas if the signals appear. One thing I can at least say for sure: I HAVE NOT called ANY longs for months. My "less is more" analytical process helped me steer clear of this sell off because there was NEVER a compelling reason to go long. NO ONE saw this coming, yet I managed to avoid the long and shared a sell signal without following ANY public information, news, "experts", etc. I FOLLOW PRICE.
As I have been pointing out for MONTHS, Bitcoin refused to compromise any major resistance levels (22K to 25K). Along with that, we have had a rising rate environment which reduces the chances of a sustainable rally even further. That is ALL you had to know to make a rational decision. All it takes is an unexpected catalyst, and next thing you know we are breaking supports (which is in line with a BEARISH environment). The market was pointing to this possibility the entire time and never offered ANY evidence of a trend reversal, bull market, or any other optimistic NONSENSE that is regularly pushed in the mainstream news.
So what now? This situation is a result of the extreme LACK OF OVERSIGHT in this industry. It began with a "leaked" balance sheet? Exposing a much more REALISTIC picture of the FTT token which comprised more than 60% of the companies assets? The valuation was FAKE. This should make you wonder about the numerous alt coins out there that were overly hyped and possibly "engineered" to encourage a "perceived" value? How many other exchanges engage in this type of "market making"? Like I remind my followers regularly, the role of the retail trader / investor in this game is to make others rich. And with no regulation, alt coins are the perfect vehicle to accomplish that. Bear markets expose the frauds in this game. Who's next? Bitfinex and Tether?
Right now price action in Bitcoin is pointing to a continuation SELL SIGNAL upon the break of 16,300. IF momentum continues (which price structure favors) it is within reason for price to test the 14K support over the coming week. There is also a new resistance level in the 18,500 area.
Lesson to learn from all of this: 1) do not trust any exchanges in an unregulated industry. (never keep all of your assets in one exchange). 2) Investors are exposed to this type of event risk. Swing trades are much more effective here because they LIMIT this type of exposure. 3) Learn to make decisions on the LEAST amount of information possible. A chart can help with this.
Thank you for considering my analysis and perspective. I hope you find it helpful.

Bitcoin - Bear flag and Fibonacci Channel Supports In this chart I look at the Bear Flag formation that is looking to break and consider the downside projection to $11.8k seems very likely given the macro economic factors impacting the crypto markets at the moment. With unconfirmed support within reach now at around the $12k level, there is also a technical reason in the chart for price to drop. Assuming support is found there, there are some notable lines of resistance that will need to be overcome, particularly around $18.3k and $21.5k. If price can recover and get above those levels, then the back of the Bear Market would seem to be broken, particularly so when we break through the top of the declining Fibonacci channel.
What do you think? Will Bitcoin fall lower before recovering, or is it time to moon?

NEW BITCOIN BOTTOMBTC will likely drop to between these two ranges, that will most likely be bottom
support going back to 2017
last bull runs bottom

Why i think ETH could hit 500-600 in DecemberThis is just an idea and nothing more NFA,DYOR (may not work)
First target is 1000 and then 500-600 as the bottom
I dont feel for making a long description right now, so thats it.
ETH BITCOIN BTC

BITCOIN Inflation down -0.5% a 9-month low! Is it truly Bullish?Bitcoin (BTCUSD) is having an initial bullish reaction before the U.S. session opens following a more than expected -0.5% drop on the U.S. CPI to 7.7% from 8.2% in the previous month. This reading beat the forecast by 0.3%. Is a drop to inflation truly bullish for BTC?
To answer this, we should look at the previous 3 times that the CPI had a monthly fall. Since August we basically have falling CPI each month:
* On August 10 the CPI fell to 8.5% from 9.1% the previous month.
* On September 13 the CPI fell to 8.3% from 8.5% the previous month.
* On October 13 the CPI fell to 8.2% from 8.3% the previous month.
* And today (on November 10 ) the CPI fell to 7.7% from 8.2% the previous month.
As we see on the chart, the August 10 CPI fall instead of a rise caused a massive drop on Bitcoin. The September 13 CPI fall also caused a drop on BTC instead of a rise, though less aggressive. The October 13 CPI fall though did start a rally but not as aggressive as one would expect, but reasonable considering the drop was only 0.1%.
That price action has kept Bitcoin within a Channel Down since the June 18 Low and yesterday the bottom was hit making a new Lower Low. This time though, the 1D RSI is rebounding after breaking yesterday below the 30.000 oversold level. The last two oversold 1D RSI readings caused short-term rallies (May and June-August) which are highlighted (black and yellow lines). Their projections are illustrated within the Channel Down, both showing a touch of the 1D MA200 (orange trend-line) in 4-5 weeks. If it happens, that would be the first 1D MA200 contact since January 02!
Do you think this huge monthly CPI drop will make Bitcoin fall and break below its Channel Down or rebound and test the 1D MA200? Feel free to let me know in the comments section below!
-------------------------------------------------------------------------------
** Please LIKE 👍, SUBSCRIBE ✅, SHARE 🙌 and COMMENT ✍ if you enjoy this idea! Also share your ideas and charts in the comments section below! This is best way to keep it relevant, support me, keep the content here free and allow the idea to reach as many people as possible. **
-------------------------------------------------------------------------------
You may also TELL ME 🙋♀️🙋♂️ in the comments section which symbol you want me to analyze next and on which time-frame. The one with the most posts will be published tomorrow! 👏🎁
-------------------------------------------------------------------------------
👇 👇 👇 👇 👇 👇
💸💸💸💸💸💸
👇 👇 👇 👇 👇 👇


Bitcoin Begins to Capitulate Lower After 5 Months of IndecisionBitcoin has broken under the critical 17567 - 18892 support zone, a range that has held since the middle of June, opening the door to resuming the broader downtrend.
BTC/USD is also testing a break under the November 26th, 2020 low at 16200.
That has exposed the September 2020 low at 9813.
A push back above lows from June may shift the focus back to a neutral setting as the 200-day Simple Moving Average nears. The latter may reinstate the dominant downside focus.
COINBASE:BTCUSD

Financial Wave. BTC m15The price fell below the first intermediate target of wave C - $17250, further decline to $15200 looks like the most preferable scenario. Growth above $20,000 will change our view of BTC

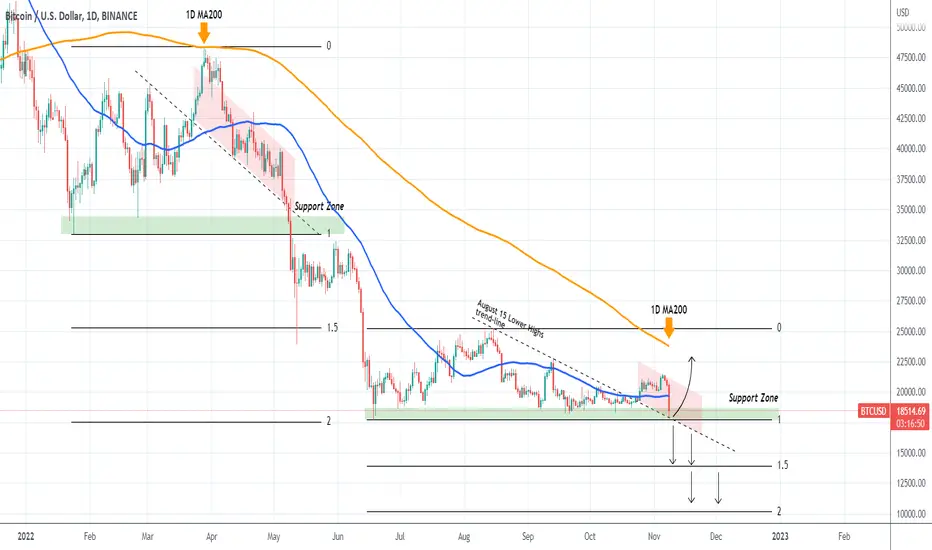
BITCOIN Nightmare fractal if this level breaksBitcoin (BTCUSD) is following the overall panic sentiment of the market after the Binance news and tested the Support Zone of the June 18 Low. A break below can set in motion a sell-off similar to that of May 09, which first hit the 1.5 Fibonacci extension and after some consolidation, moved to make the June 18 Low on the 2.0 Fibonacci extension.
What stood out then as the trigger of the sell-off was a Lower Highs trend-line that started on March 02 and then turned into Lower Lows that held the price action until the Support Zone. When it broke, the aggressive sell-off took place. On today's sequence, we have that (former) Lower Highs trend-line starting on the August 15 High, getting hit today on the Binance exchange.
A break below it can trigger that same massive sell-off with the 1.5 Fib extension being around 14000 and 2.0 around 10200. Another common characteristic of the two fractals is the fact that the 1D MA200 (orange trend-line) was never broken and acted as a Resistance. That means that technically only a break above it can invalidate this bearish pattern.
So what do you think? Can the former Lower Highs trend-line save the day? Feel free to let me know in the comments section below!
-------------------------------------------------------------------------------
** Please LIKE 👍, SUBSCRIBE ✅, SHARE 🙌 and COMMENT ✍ if you enjoy this idea! Also share your ideas and charts in the comments section below! This is best way to keep it relevant, support me, keep the content here free and allow the idea to reach as many people as possible. **
-------------------------------------------------------------------------------
You may also TELL ME 🙋♀️🙋♂️ in the comments section which symbol you want me to analyze next and on which time-frame. The one with the most posts will be published tomorrow! 👏🎁
-------------------------------------------------------------------------------
👇 👇 👇 👇 👇 👇
💸💸💸💸💸💸
👇 👇 👇 👇 👇 👇
Financial Wave. BTC m15In the last review, we considered growth to $20,600 and were right. At the moment, the correction continues, and the price is falling to intermediate targets of $17,250. This scenario is preferable. Fixing the price above $19500 will change our view.

IMO, the lower line of this channel looks like a targetSupply is overcoming demand. The price seems to be forming a weak bounce from the median line, so the chances of a drop to 18k are increasing.
Bitcoin - Price action with the MAsIn this chart I look at some basic overlays to the BTC chart; a Fibonacci channel, the Simple Moving Averages (SMAs) and the untested support level at $12k.
I note the 1W 300MA is now above the prior low, which means price will have to break this level to find a new bear market bottom.
1D 50MA is currently the only MA offering support (at $19.6k) and if price falls below that level, all the daily MAs will then be cast as offering resistance against price appreciation. Not really a strong position for Bulls.
Notably, the Fibonacci levels within the parallel channel structure have been well respected throughout this bear market, including where price was rejected at $21.4k just three days ago. I observe that the earliest intersection of the $12k level with the channel levels is around November 25.
What do you think? Will the 1W 300MA offer a floor to the BTC price, or will we make a lower low? If a lower low, then will $12k become confirmed support?
Either way, it would seem that the 1D 50MA has to support the close today for Bulls to have confidence.

BITCOIN Can the Adam & Eve pattern push the price to 29-34k?Despite today's drop, Bitcoin (BTCUSD) is still on its path of completing an Adam and Eve (A&E) pattern since the June crash, which is a formation consistent with market bottoms. In fact as we see on this analysis, which is made on the 1D time-frame, every market Bottom on BTC's previous Cycles was formed on a A&E pattern. Despite the different eras, even the RSI and MACD indicators seem quite consistent across those patterns.
Technically, the short-term target is the 1D MA200 (orange trend-line). The next is the 0.382 Fibonacci retracement level, which was the previous Support Zone during this Bear Cycle and is around $29700. But based on the A&E characteristics, the price can skyrocket by Q1 2023 as high as Eve's 2.0 Fib, which is around $34400.
Is this a realistic Target Zone for Bitcoin for the next 4 months? Feel free to let me know in the comments section below!
-------------------------------------------------------------------------------
** Please LIKE 👍, SUBSCRIBE ✅, SHARE 🙌 and COMMENT ✍ if you enjoy this idea! Also share your ideas and charts in the comments section below! This is best way to keep it relevant, support me, keep the content here free and allow the idea to reach as many people as possible. **
-------------------------------------------------------------------------------
You may also TELL ME 🙋♀️🙋♂️ in the comments section which symbol you want me to analyze next and on which time-frame. The one with the most posts will be published tomorrow! 👏🎁
-------------------------------------------------------------------------------
👇 👇 👇 👇 👇 👇
💸💸💸💸💸💸
👇 👇 👇 👇 👇 👇

Common Double Bottom StructuresShowing double bottom structures that can be seen across the board, with Bitcoin being in yellow.
Its interesting because these altcoins are heavily following BTC which in the past hasn't always been the case.
I have listed three for example however there are definitely many more I have came across.
I wonder how the bullish reversal (consequent of double bottom) will play out :0
BTC Detailed Top-Down Analysis - Day 98Hello TradingView Family / Fellow Traders. This is Richard Nasr, as known as theSignalyst.
98 out of 500 days done.
I truly appreciate your continuous support everyone!
Let me know if you like the series, and if you would like me to change or add anything.
Always follow your trading plan regarding entry, risk management, and trade management.
Good Luck!.
All Strategies Are Good; If Managed Properly!
~Rich

Bitcoin Vs USD: Wave analysis Chart: 4H
Based on a purely technical analysis, BTC should hit $22K before dropping again to 21.5K and then, continuing all the way to 22.5K.
The entire movement should take around 10-12 days.
Trade safe!

BITCOIN Supertrend about to turn green after a year! Bottoms in?Bitcoin (BTCUSD) has been trading on a red (bearish) Supertrend on the 3D time-frame since November 2021, i.e. a year. If the price breaks above 23k, this very reliable indicator will turn green (bullish) again. On this time-frame in particular, it has the highest historic accuracy.
With inflation being the cause of this 2022 Bear Market so far (asset wide), a big part of it is Oil (black trend-line). In fact it is often the leading indicator of inflation. An extremely interesting correlation of Oil with BTC is that every time the Supertrend turned green after a Bear Cycle bottom, WTI Oil was already on a strong, counter trend (as the primary trend was bearish) rally after a Lower Lows bottom.
In ten years, this combination of parameters has always been the start of Bitcoin's new Bull Cycle. Oil has been on a bearish trend since March 2022 but posting a counter trend rally since the September low. Can this be the build-up to a Supertrend green reversal and a new BTC Bull Cycle? Feel free to let me know in the comments section below!
-------------------------------------------------------------------------------
** Please LIKE 👍, SUBSCRIBE ✅, SHARE 🙌 and COMMENT ✍ if you enjoy this idea! Also share your ideas and charts in the comments section below! This is best way to keep it relevant, support me, keep the content here free and allow the idea to reach as many people as possible. **
-------------------------------------------------------------------------------
You may also TELL ME 🙋♀️🙋♂️ in the comments section which symbol you want me to analyze next and on which time-frame. The one with the most posts will be published tomorrow! 👏🎁
-------------------------------------------------------------------------------
👇 👇 👇 👇 👇 👇
💸💸💸💸💸💸
👇 👇 👇 👇 👇 👇

BITCOIN Is LTC a leading indicator to BTC's Bull Cycle??This is a chart on the 1W time-frame of Bitcoin (BTCUSD) and Litecoin (LTCUSD). This is not the first time we do this analysis, those who follow for long will know that during the previous BTC Cycle, right when it was consolidating after the December 2018 bottom, we used LTC's price action to identify similarities with historic price runs.
And yes, in the past two Cycles, Litecoin has been an excellent leading indicator to Bitcoin, showing the way with a first rally into the market's new Bull Cycle. As you see on the chart, LTC right after the market bottom, tends to make an initial rally and diverge from BTC while it is still sideways (green zone). Shortly after, LTC explodes to the upside with a strong rally, while BTC only posts a small rise (blue zone). Right after this, the Bull Cycle begins officially.
Litecoin has been rising since mid October, diverging significantly from Bitcoin. We can claim that we are already in a new Green Zone as at the same time Bitcoin is trading sideways. Do you think this correlation will play out once more? And if so, should we expect a small rise for Bitcoin in the final two months of 2022 and a new Bull Cycle starting as early as next year? Feel free to let me know in the comments section below!
-------------------------------------------------------------------------------
** Please LIKE 👍, SUBSCRIBE ✅, SHARE 🙌 and COMMENT ✍ if you enjoy this idea! Also share your ideas and charts in the comments section below! This is best way to keep it relevant, support me, keep the content here free and allow the idea to reach as many people as possible. **
-------------------------------------------------------------------------------
You may also TELL ME 🙋♀️🙋♂️ in the comments section which symbol you want me to analyze next and on which time-frame. The one with the most posts will be published tomorrow! 👏🎁
-------------------------------------------------------------------------------
👇 👇 👇 👇 👇 👇
💸💸💸💸💸💸
👇 👇 👇 👇 👇 👇

BITCOIN 4H Channel Update In the previous analysis, we mentioned the ascending channel, which now, after reaching the bottom of the channel, has started an upward trend towards the top of the channel. Now, with the breaking of the resistance range, we expect the price to increase.
Its not Buy or Sell SIGNAL
DYOR
BY : M.TeriZ - @AtonicShark

BITCOIN Complete 1H analysis. Buy above this level only!Bitcoin (BTCUSD) is falling back after the Fed's +0.75% Rate Hike and Powell's press conference. From a technical perspective on the 1H time-frame, the price remains within a Channel Down pattern (blue) since the October 29 High but on the longer term within a Channel Up (dashed lines) since the October 13 Low.
We can see an interesting finding on this chart as this Channel Down is a recurring pattern since October 07. The price drops with the 1H MA50 (blue trend-line) as its Resistance and the catalyst that gives a confirmed signal to buy is a break above the 1H MA200 (orange trend-line). In remarkable fashion, both previous MA200 break-outs, gave an instant rise of +2.50%. Based on the 1H MA200's current level, a +2.50% rise would approach the $21000 mark.
Until the 1H MA200 breaks, the Channel Down would aim lower. A break below the Channel Up bottom (Higher Lows trend-line) can target Support (A) and further break-out Support (B) at 19240 and 18650 respectively. On the bull side, if the Channel Up extends fully to its Top to form a new Higher High, it can hit $22000.
Which break-out do you think will come first? Feel free to let me know in the comments section below!
-------------------------------------------------------------------------------
** Please LIKE 👍, SUBSCRIBE ✅, SHARE 🙌 and COMMENT ✍ if you enjoy this idea! Also share your ideas and charts in the comments section below! This is best way to keep it relevant, support me, keep the content here free and allow the idea to reach as many people as possible. **
-------------------------------------------------------------------------------
You may also TELL ME 🙋♀️🙋♂️ in the comments section which symbol you want me to analyze next and on which time-frame. The one with the most posts will be published tomorrow! 👏🎁
-------------------------------------------------------------------------------
👇 👇 👇 👇 👇 👇
💸💸💸💸💸💸
👇 👇 👇 👇 👇 👇

Start of the next bull run?I was looking through some of my old trading strategies and ran across my CCI setups. What's interesting about this chart on the 2 week per candle is that we are currently crossing up from -130 and -70 on the CCI. This is the 4th time it's happened in Bitcoins history. Each time it has done so, it has been the beginning of a notable increase in price and has triggered a bull run. Is this time different?
