BTC only a matter of timeIt's only a matter of time, BTC will likely break through the down trending resistance line exiting the bear market soon.
Bitcoin-btcusd-btc

BITCOIN The last stand for Bulls. Failure will be catastrophic!Bitcoin (BTCUSD) is getting at that point where, based on its previous two Cycles, will provide a decisive move in the next weeks, as presented to you on this 1W time-frame analysis. The three charts represent Bitcoin's three Bear Cycles: 2021/22, 2018/19 and 2014/15 as they appear from left to right.
The LMACD indicator (logarithmic MACD) is what makes most of the difference at this point we are at, as in the past three weeks, it histogram has broken above the 0.00 level for the first time since March. With the Bullish Cross also taking place in October and the red histogram ascending, all this is consistent with the phases of the past Bear Cycles right after their Bottom and right before a rally to the 1W MA50 (blue trend-line) took place.
The price hasn't yet broken above the 1W MA20 (orange trend-line) but the 1W MA50/100 Bearish Cross was formed last month and that was always past the Bottom of the previous Bear Cycles. As you see the 1W MA300 (red trend-line) was always the major Support during Bear Cycles.
Do you expect a strong rebound towards the 1W MA50 in the coming weeks as per this Cycle Comparison Analysis or a closing deep below the 1W MA300 will unleash catastrophic consequences? Feel free to let me know in the comments section below!
-------------------------------------------------------------------------------
** Please LIKE 👍, SUBSCRIBE ✅, SHARE 🙌 and COMMENT ✍ if you enjoy this idea! Also share your ideas and charts in the comments section below! This is best way to keep it relevant, support me, keep the content here free and allow the idea to reach as many people as possible. **
-------------------------------------------------------------------------------
You may also TELL ME 🙋♀️🙋♂️ in the comments section which symbol you want me to analyze next and on which time-frame. The one with the most posts will be published tomorrow! 👏🎁
-------------------------------------------------------------------------------
👇 👇 👇 👇 👇 👇
💸💸💸💸💸💸
👇 👇 👇 👇 👇 👇

Bitcoin warm up- i know some peoples are still waiting for 15k or 10k.
- in 2018-19, some of my friends were waiting BTC to dip $1000 when BTC was around 3000$, they are still waiting right now.
- Used correctly, Bollinger Band is a powerful indicator.
- you need to look closely at the Weekly BB contraction.
- When BB compress, it's a sign of volatility returns.
- the lower BB reached 17k+ ( was around 15.5k few weeks ago )
- The lowest BTC dip was $17,580
- BTC is evolving in a flat rectangle between 17,5k and 25k, the same situation happened in 2018-2019, it's called " Consolidation ".
- i can only suggest you to DCA buy instead of missing the train.
- it's better to take the risk to go in between 17k5-19.5k, than wait for a price that you won't never see again.
" The greed works on both sides, Bulls or Bears. "
Happy Tr4Ding!

BTCUSD bullish butterfly patternBTC bulls showed butterfly pattern , 18k$ is good price for long term entry. Hope panic ends in this zone!

Bitcoin - no BTC candle close🔑below $18,435 since 97 weeks 🚨Bitcoin
No weekly candle close🔑below $18,435 since 97 weeks 🚨
15 hours to go - what are your thoughts on that weekly mark dear BTC and Crypto Nation❓
Likes, comments & Follow appreciated🤗
*not financial advice
do your own research before investing

BITCOIN 6H Update range mode According to the chart, we are in the range of suffering, waiting for failure. If the trend line is broken upward, we expect the price to increase, otherwise we will have a correction.
Its not Buy or Sell SIGNAL
DYOR
BY : M.TeriZ - @AtonicShark

BITCOIN: USD rejected on 2008 Resistance. Turning point for BTC?Following the CPI release this week, the 3rd straight month of decreasing numbers with potentially high implications on the USD, I thought it would be relevant to look at the U.S. Dollar Index (DXY) and how it's current state can affect Bitcoin (BTCUSD) relative to key turning points and correlations of the past.
** Bitcoin's Bull and Bear against the Dollar **
The chart on the top displays Bitcoin with the Green Channel being a Bull Phase, the Red Channel being a Bear Cycle and the Blue Rectangle predominantly an Accumulation Phase straight after the Bear Cycle where investors bought at a low price in preparation of the Bull Cycle.
The chart on the bottom displays the Dollar Index with the Green Channel being a Rally Phase, the Red Channel a Decline Phase and the Blue Rectangle sideways movement/ consolidation. What is perhaps more critical on this 14 year chart, is the Higher Highs trend-line that started during the 2008 Housing Crisis and where DXY has been so far rejected 4 times, including the most recent hit on the weekly (1W) candle of September 26 2022.
** The 2008 Housing Crisis trend-line **
This trend-line is where the Dollar Rallies historically ended. What followed was either a consolidation phase or a decline. And as you see (and I am sure you are well aware of), the Dollar is negatively correlated with Bitcoin, meaning that (typically) when the USD trends towards one direction, Bitcoin trends towards the opposite. This is quite evident on this comparison chart. Red phases on the DXY are typically the Final Parabolic Rallies on BTC's Bull Cycles while Green phases on the DXY take place during BTC's Bear Cycles.
** Are we at a turning point? **
This is exactly where we are at now. The DXY has been on its strongest multi-month rally of recent times (Green) while Bitcoin is having its traditional Bear Cycle. With the DXY hitting its 2008 Higher Highs trend-line, the probability of a reversal gets stronger. The last two times the 2008 trend-line got hit, Bitcoin ended a Bear Cycle (January 2015) and started a Final Parabolic Rally (January 2017). As a result the probability of Bitcoin making a Bear Cycle bottom here increases. It is more likely to see an Accumulation Phase (blue) next as the Dollar tends to consolidate after such Rallies end.
But what do you think? Will DXY stay below its 2008 Higher Highs trend-line and reverse, giving Bitcoin a bottom or it will break above it and invalidate this historic pattern, sending Bitcoin even lower and changing the narrative? Feel free to let me know in the comments section below!
P.S. Snapshot of the chart below, in case it doesn't show up proportionally on your browser:
-------------------------------------------------------------------------------
** Please LIKE 👍, SUBSCRIBE ✅, SHARE 🙌 and COMMENT ✍ if you enjoy this idea! Also share your ideas and charts in the comments section below! This is best way to keep it relevant, support me, keep the content here free and allow the idea to reach as many people as possible. **
-------------------------------------------------------------------------------
You may also TELL ME 🙋♀️🙋♂️ in the comments section which symbol you want me to analyze next and on which time-frame. The one with the most posts will be published tomorrow! 👏🎁
-------------------------------------------------------------------------------
👇 👇 👇 👇 👇 👇
💸💸💸💸💸💸
👇 👇 👇 👇 👇 👇

XLM Stellar ShortXLM bearish target is 0.1090
Potential sell or buy limit order. Btc is also in big consolidation so impossible is nothing ...

#btcstarburst Bounce Zone? Was this the area? Or is this jus a fake out. Following up…Dca safely A Gann a study

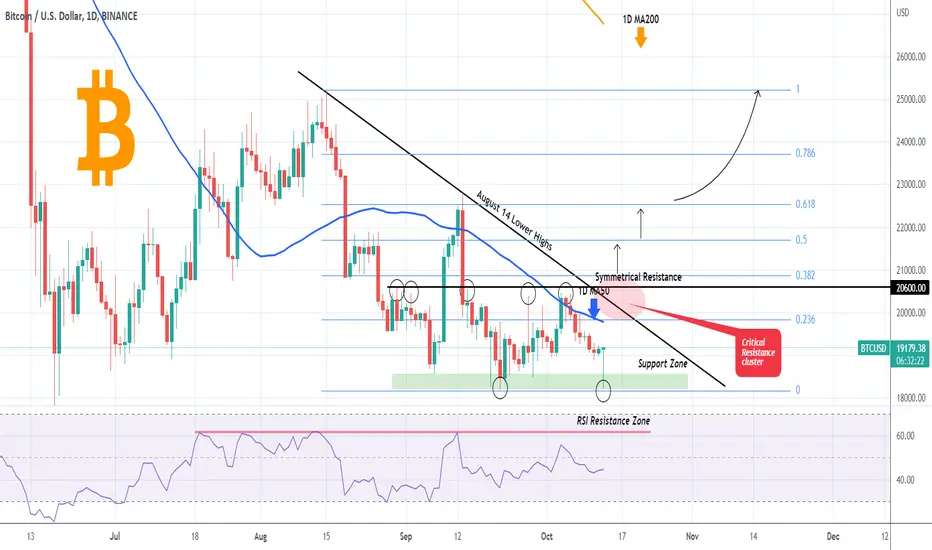
BITCOIN Today's CPI rebound may change the narrative.Bitcoin is rebounding massively on its September Support Zone following the CPI release despite a higher than expected reading. Being still lower than the previous month, the markets strong defense reaction on this Support level may change the bearish narrative of the past two months.
The immediate Resistance level is the 1D MA50 (blue trend-line) but the difference maker will be a break or rejection on the August 14 Lower Highs trend-line and the 20600 Symmetrical Resistance, which as we mentioned on last week's analysis shown below, has rejected the price 5 times in just over a month:
A break above this highly important Resistance Cluster, can set in motion bullish break-outs that can target the upper Fibonacci retracement levels one by one all the way towards the critical long-term 1D MA200 (orange trend-line) test. On the other hand a closing below the Support Zone, would probably be translated into a break below the 1W MA300, which has been holding since the June low. Below that level, 16000, 14000 even 12000 is possible before Bitcoin bottoms.
Which scenario do you think will prevail? Feel free to let me know in the comments section below!
-------------------------------------------------------------------------------
** Please LIKE 👍, SUBSCRIBE ✅, SHARE 🙌 and COMMENT ✍ if you enjoy this idea! Also share your ideas and charts in the comments section below! This is best way to keep it relevant, support me, keep the content here free and allow the idea to reach as many people as possible. **
-------------------------------------------------------------------------------
You may also TELL ME 🙋♀️🙋♂️ in the comments section which symbol you want me to analyze next and on which time-frame. The one with the most posts will be published tomorrow! 👏🎁
-------------------------------------------------------------------------------
👇 👇 👇 👇 👇 👇
💸💸💸💸💸💸
👇 👇 👇 👇 👇 👇
HNTUSD LongHNT bullish confirmation, Target is $5.07... Sharks are doing their job very well ! I highly recommend this position, bulls will reach this target...

BITCOIN 2H TrendLine SupportBitcoin has reached its support range in the 2-hour time frame, and with the break of the trend line, we expect the price to increase.
Its not Buy or Sell SIGNAL
DYOR
BY : M.TeriZ - @AtonicShark

BITCOIN 2021 RSI fractal points lowerAs Bitcoin (BTCUSD) is struggling to break above the Lower Highs trend-line that started after its November 2021 All Time High (ATH), the RSI on the 1D time-frame has been printing (since June) a sequence similar to that of mid-July - early-Nov 2021.
As you see with the candle comparisons (orange for 2021 and blue for 2022), even though the RSI patterns were fairly similar during their course, the candle patterns diverged halfway through as 2021 was an (aggressive) uptrend while post mid-June 2022 has been a consolidation so far.
Regardless of that and as Bitcoin is being rejected yet again on its ATH Lower Highs, does this mean we are on the verge of another sell-off? The RSI certainly points that way. Feel free to let me know in the comments section below!
-------------------------------------------------------------------------------
** Please LIKE 👍, SUBSCRIBE ✅, SHARE 🙌 and COMMENT ✍ if you enjoy this idea! Also share your ideas and charts in the comments section below! This is best way to keep it relevant, support me, keep the content here free and allow the idea to reach as many people as possible. **
-------------------------------------------------------------------------------
You may also TELL ME 🙋♀️🙋♂️ in the comments section which symbol you want me to analyze next and on which time-frame. The one with the most posts will be published tomorrow! 👏🎁
-------------------------------------------------------------------------------
👇 👇 👇 👇 👇 👇
💸💸💸💸💸💸
👇 👇 👇 👇 👇 👇

Bitcoin chart analysisThe situation has not changed since our last forecast. We removed the low at $18,500 (in liquidity zone 1)
We have a liquidity zone below $17,600 where there is a big chance to go down (liquidity zone 2)
Now the market is very fishy with a lot of fake movements, a similar market was in early May and early June, after that Bitcoin showed new waves of decline.
Therefore, we must warn you against opening new positions while bitcoin is in such a flat and knocks out stops in 2 directions.
We would looking for Bitcoin purchases after fixing above 50 and 100 moving averages, because before that we had 2 unsuccessful attempts to break through.
The magnitude of the falling wave on Bitcoin will depend on world news, stock indices and the dollar index.
As long as the trend is upward on the dollar index, which is bad for Bitcoin, there is no point in working against the trend.
For Bitcoin to fall far below $17k we think we should see some kind of unexpected news that will shock all markets, like a nuclear strike, a big bank/exchange bankruptcy and like the recent Luna or other similar shocks.
#Cardano has already broken its latest lows as we suggested , which may be a forerunner of a fall for the entire market as it is a top altcoin.

BTC TO THE GRAVE YARDSince we are about to transcend from fiat to crypto btc's going to dump probably to 0 taking all cryptos with it, making usd strong.... except for ripple, wich is then gonna skyrocket, killing of the last fiat currencies...

BITCOIN Break or fail on the November 2021 Resistance??This is Bitcoin (BTCUSD) on the 1D time-frame where we might be having perhaps the biggest development of the current Cycle. What do I mean by that? Well the 2021/22 Bear Cycle has been largely sustained 'thanks to' the Lower Highs trend-line that started on the November 10 2021 All Time High (ATH). The first major rejection it had was on the March 28 2022 Lower High, which happened to be also on the 1D MA200 (orange trend-line) and started the bearish leg of April-May-mid June, and the most reject minor rejection was on the September 13 Lower High which almost touched the trend-line.
As you see, the price touched that trend-line again on October 04, hitting the 1D MA50 (blue trend-line) in the process and after a marginal break on a candle wick above the trend-line on October 06, it pulled-back below it again. However the sideways trading of the past two days is putting BTC on the November 10 2021 trend-line again, adding more to that uncertainty of the trend.
What are you treating Bitcoin's persistence to trade around this trend-line as? Is it a break or a fail? So far it couldn't be more unclear indeed. Technically a decisive break can lead the price to the 1D MA200 for the first time since March 28 but that break alone would be one of the most critical steps of this Cycle towards starting the new Bull Phase. On the other hand a rejection has the June 18 Support Zone to test, which is also where the major Support trend-line of the 1W MA300 (red trend-line) is coming to.
So is Bitcoin breaking to the upside or failing here? Feel free to let me know in the comments section below!
-------------------------------------------------------------------------------
** Please LIKE 👍, SUBSCRIBE ✅, SHARE 🙌 and COMMENT ✍ if you enjoy this idea! Also share your ideas and charts in the comments section below! This is best way to keep it relevant, support me, keep the content here free and allow the idea to reach as many people as possible. **
-------------------------------------------------------------------------------
You may also TELL ME 🙋♀️🙋♂️ in the comments section which symbol you want me to analyze next and on which time-frame. The one with the most posts will be published tomorrow! 👏🎁
-------------------------------------------------------------------------------
👇 👇 👇 👇 👇 👇
💸💸💸💸💸💸
👇 👇 👇 👇 👇 👇

Bitcoin: How To Play The Range.Bitcoin price structure continues to point to lower levels even though this market is out of play. Out of play means it is a good idea to avoid it (especially on smaller time frames) until momentum reestablishes itself. In this article I want to point out some important considerations when attempting to time Bitcoin in this environment.
Before I get into that, here's what needs to happen in order for momentum to increase: Price needs to close above 20,500 or below 18,500. What you are seeing now is a consolidation. ANYTHING that occurs inside this range is pretty much meaningless in terms of the bigger picture. This is not a "bitcoin can go higher or lower" analysis, it's about knowing how to adjust when Bitcoin provides enough activity for profit potential. If you have an opinion, and you trade on it, you are placing yourself in a situation where there is at least 50% chance of being wrong. That's gambling and not an effective way to extract profits over time.
To better navigate this type of environment consider these points:
1. Gauging probabilities comes from evaluating price information (things you can see) AND environmental factors like macro fundamentals and market correlations (S&P). If you rely on a chart in isolation, you will not know how to weight scenarios or form reasonable expectations (and most likely get lured into fake guru hope appeals). Interest rates are still RISING (bearish for EVERYTHING) and stock market is poised to break lower. This means ANY bullishness in Bitcoin has very LIMITED potential as long as this trend continues.
2. Bitcoin price has YET to compromise a relevant resistance level. 22 to 25K is still intact and NOW there is a new resistance (lower high) established at the 20,500 level. Lower highs often lead to lower lows UNLESS the market offers a new piece of information like a resistance break. As long as this structure stays intact (macro fundamentals support this) LOWER prices are STILL in favor. While 18,500 manages to hold, it is less likely to continue if it is tested again.
3. Markets are HIGHLY RANDOM. This means NO ONE KNOWS where price will be in the future. THINGS CHANGE quickly. Markets are priced in terms of participant's perception of the future. Greed and fear are what move prices NOTHING ELSE. For these reasons, your focus should be accounting for RISK NOT profits. Probabilities currently favor lower prices, but that does not mean price will go to 5K. Currently 14K and 17K are the support levels within range. Account for these, ESPECIALLY if you are trying to accumulate inventory for a longer time horizon. This also means relying on things like oscillators, or conventional logic will NOT help you. You will NEVER know more than the market unless you have inside information.
If you are flat, there is no reason to be in a hurry to take any action until the market at least shows signs of momentum. There is nothing wrong with WAITING for some form of clarity.
Thank you for considering my analysis and perspective. I hope you find it helpful.

BTCUSD BreakdownUPDATED: Forgot to add my exact entries and also everyone, if the FED comes out with any major news that can change sentiment
I would possibly enter at that Demand Level below the entry

Bitcoin H4-chartRising wedge inside and n the h4 frame, inside a bearish pennant on the D1 time frame.. expected key targets I’d like to see play out at the important levels…

BITCOIN 4H in the channelWe see the ascending channel in the 4-hour time frame, which was unable to form a peak higher than the previous peak and reached the bottom of the channel. If the bottom of the channel breaks, the possibility of falling will increase, otherwise it will reach the top of the channel again with the support of the price.
Its not Buy or Sell SIGNAL
DYOR
BY : M.TeriZ - @AtonicShark

Bitcoin at huge trendline support accumulation 🟢🔴🟢Bitcoin
Sometimes you need to calm down and filter out the noise by... RENKO-charts
Every₿ody can see that BTC is at a huge trendline support accumulation 🟢🔴🟢
RT & Follow appreciated 🤗
And tell me your opinion on RENKO-charts dear Crypto Nation 😎
*not financial advice
do your own research before investing

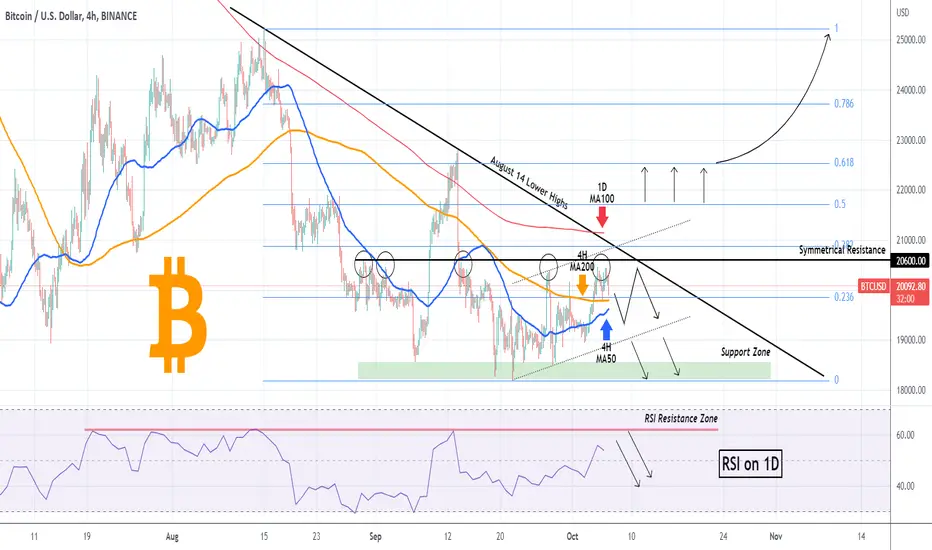
BITCOIN Strong August Resistance cluster! Break or rejection?This is Bitcoin (BTCUSD) on the 4H time-frame as we are looking into the short-term price action on this particular analysis. As you see the price got rejected just below the Symmetrical Resistance that was first formed on the August 30 High. Since then we had another three (excluding the current) rejections or near rejections.
However, an even more important Resistance level that this, is the Lower Highs trend-line that started after the August 14 High. At the moment this is located exactly on the 0.382 Fibonacci retracement level, which is another important level as it supported from Aug 19 to 23.
So far the RSI on the 1D time-frame, hasn't hit the Resistance Zone that since July 19 has formed all major Highs, so there is some more room to grow. That is why I've plotted a potential Channel Up pattern (dotted lines) that fills up this void. As you see, there is high probability of trading within this pattern. A break below is a sell signal targeting the lower Support Zone (green).
A break above however will still be limited to the 1D MA100 (red trend-line) and the 0.5 Fibonacci level. Only a closing above the 0.5 Fib can be taken as a buy break-out signal and only on the short-term, towards the 0.618 Fib. We can only consider a longer term buy if the price closes above the 0.618 Fib and target the August High.
Do you agree with this short/ medium-term trading approach? Feel free to let me know in the comments section below!
-------------------------------------------------------------------------------
** Please LIKE 👍, SUBSCRIBE ✅, SHARE 🙌 and COMMENT ✍ if you enjoy this idea! Also share your ideas and charts in the comments section below! This is best way to keep it relevant, support me, keep the content here free and allow the idea to reach as many people as possible. **
-------------------------------------------------------------------------------
You may also TELL ME 🙋♀️🙋♂️ in the comments section which symbol you want me to analyze next and on which time-frame. The one with the most posts will be published tomorrow! 👏🎁
-------------------------------------------------------------------------------
👇 👇 👇 👇 👇 👇
💸💸💸💸💸💸
👇 👇 👇 👇 👇 👇
Bitcoin PI Cycle comparison🔺🟢Bitcoin PI Cycle comparison
Interesting to see that in 2014, 2018 and now in 2022 the downside from a significant market structure to the PI Cycle Bottom signal🔺🟢was about -47% so far
Follow appreciated 🤗 dear BTC and Crypto Nation 😎
Let me know your thoughts 🤔
*not financial advice
do your own research before investing
