A long term painful path for #bitcoinUsed only Elliott' s Wave patterns. It has worked from 2017 top till current time. Now it's the time for 5th corrective wave. After the dip occured then months later we may see the lowest #btc .Approximately in 2023 March trend reversal may begin with the incoming halving.
Not financial advice. DYOR.
Bitcoin-btcusd-btc

Bitcoin daily stage 4 in progressOn August 19 we break track line with bearish bars, red dot and weakness arrow.
Since that consecutive red dots below and below track line as well.
I can see a double bottom for now.

Update on US10Y-US02Y cross and Bitcoin behaviorUpdate on US10Y-US02Y...
compare RVGI indicator cross and Bitcoin
Not a cross yet in the extreme area of this indicator that would mark a quite good Entry for BTC - see linked idea
But the next cross for a possible Entry point is ahead dear Crypto Nation 💥🚀😎
Comment & FOLLOW appreciated 🤗
*not financial advice
do your own research before investing

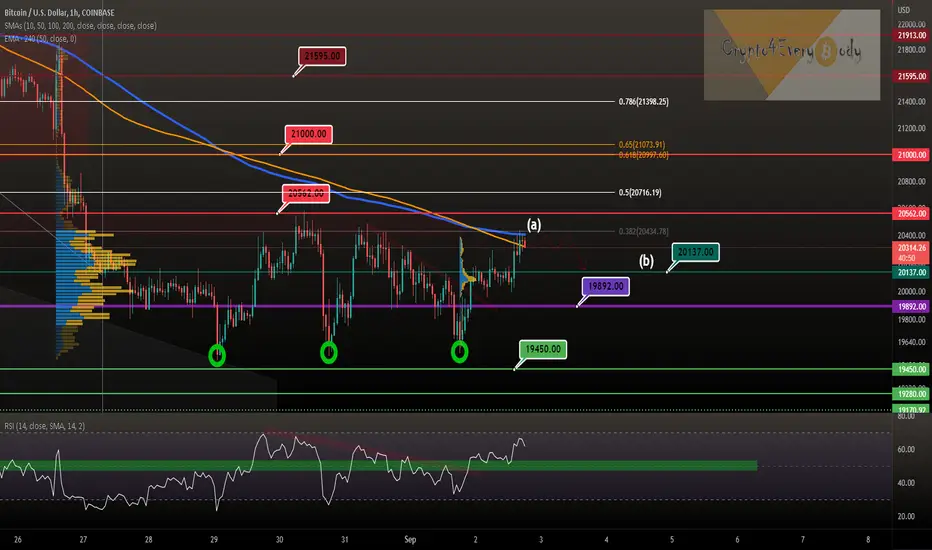
Bitcoin short-term view - EMA50 (4h chart) strong resistanceBitcoin short-term view - breakout target reached as predicted
(a) EMA50 (4h chart) is known as strong resistance on low TF
(b) a sideways consolidation down to $20,137 would not be concerning
Will keep you updated dear Crypto Nation
*not financial advice
do your own research before investing
BITCOIN - MULTI YEAR ACCUMULATION RANGE?To stay this strucure of huge consolidation channel we need to keep uur current low and print stron higher low.
We have place to one more lego down just slightly below 19 k where bulls will have to absorb all the selling pressure.
If that holds I think we will have choppy month or longer even after breaking main trend line.

Bitcoin Trend Analytics September 2The key short-term bullish support sustained the price and many positions are added at this level. It’s still functioning as key support.
Taking hold of $21115.19 could BTC enter consolidation.
Intraday fluctuation is concentrated between the key support and intraday resistance. Monitor the key support.
QT doubles in September. Fed lifts the upper limit of QT to 95 billion (60 billion treasury bonds + 35 billion MBS). The market is under the pressure of quick and massive liquidity drainage.
The market expected interest rate hike in September: 50bp(28%),75bp(72%)

MAYBE... just MAYBENot as technical as we tend to be in our analysis here at ORCA, but if it plays like this you saw it here first.
Trade safely, and stay tuned for our next post which will be our analysis for our q4 outlook!

The Trimmed Mean PCE inflation rate still rising - Bitcoin ??Update:
The Trimmed Mean PCE inflation rate still rising
See the reverse of Bitcoin🟠and the Trimmed Mean PCE🔵inflation rate
Love to keep you updated dear Crypto Nation?
Follow appreciated 🤗
*not financial advice
do your own research before investing

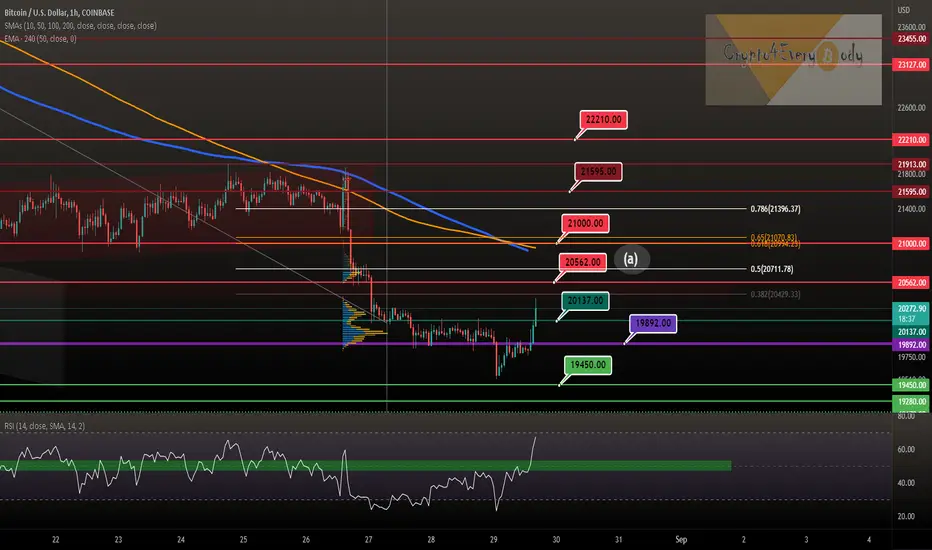
Bitcoin short-term view - BTC tripple bottom - breakout ahead?Bitcoin short-term view
(a) BTC formed a tripple bottom - breakout ahead?
(b) we need a close above ATH 2017 at $19,892 and price action resistance at $20,137 as well as on RSI
(c) target IMO still at FIB 38.2% - $20,434 (SMA+EMA resistance)
*not financial advice
do your own research before investing

Bitcoin following the script as expectedOn 11th of May 2022 when $BTC was $30000 I published the idea that it will drop to $14000-$12000.
Back than we were in wave B of the correction.
Check the link below.
We are now fully underway in wave C. starting minor wave 5 of C.
So the good news that the ending of the correction is near. When wave 5 of C is done, the whole correction started in November 2021 is done.
The bad news (for $BTC holders) is that is still going down to that $12000-$14000 level. I have multiples Fib ratios pointing to that level.
This is my analysis and does not constitute financial advice.

BITCOIN Short-term outlook doesn't look promising. Unless...This analysis is on Bitcoin (BTCUSD) on the 4H time-frame where we're looking on its short-term perspective. As you see since the August 15 High and the rejection on the 1D MA100 (red trend-line), the trend has been bearish and using the Fibonacci Channel with its extensions, better grasps the movement.
The price has been closing below the 4H MA50 (blue trend-line) since August 16 and the 4H MA200 (orange trend-line) since August 18. Every major drop (black arrows) was preceded by a Channel Up/ Bear Flag pattern, where sellers accumulated. It appears that we are in such a Flag currently that is about to break downwards. On top of that, BTC failed to break above the Lower Highs trend-line tha started on the August 15 High and last time that happened (August 26), the new drop happened. We are though very close to the Channel's Bottom (Lower Lows trend-line), which broke momentarily on Aug 28, so a new drop may target the -0.5 Fibonacci extension.
On the bull side, the 4H RSI has been on Higher Lows since August 19, also printing an Inverse Head and Shoulders pattern. A candle close above the 4H MA50 should be enough to accumulate buyers into targeting the 4H MA200 (orange trend-line). On the longer-term, only a weekly closing above the 1D MA100 seems capable to restore the bullish trend.
Also, consider this Higher Lows zone since June 30, illustrated by the dashed lines on the chart below (I didn't include this on the main chart to make it less messy):
Which direction do you think Bitcoin will follow? Break above the 1D MA50 or new drop? Feel free to share your work and let me know in the comments section below!
--------------------------------------------------------------------------------------------------------
Please like, subscribe and share your ideas and charts with the community!
--------------------------------------------------------------------------------------------------------

BITCOIN 12H TA: Break TrendLineAs we can see in the chart, the uptrend line is broken down and if the pullback is completed, there will be a bearish move, if the price can be closed again above the trendline, the analysis will be updated.
Its not Buy or Sell SIGNAL
DYOR
BY : M.TeriZ - @AtonicShark

Bitcoin connection to United States Chicago PMI Bitcoin connection to United States Chicago PMI - measuring performance of manufacturing and non-manufacturing sector in Chicago
Chicago PMI is released one day before the ISM Manufacturing Index.
Look how strong #BTC behaved in PMI uptrends and partly even in downtrends
What to expect at next PMI uptrend ⁉️
Comments & Follow appreciated 💥😉💥

BITCOIN Recovering the 1D MA100 is key for $30000 as in 2019The trading set-up on Bitcoin (BTCUSD) since the June 18 low looks a lot like the price action that followed the December 15 2018 Bottom of that Bear Cycle. There is no need to overanalyze this as a simple comparison of the two charts of 2022 and 2019 would suffice.
As you see in 2019 when the price broke below the 1D MA50 (blue trend-line), it entered the final stage of Accumulation inside a Channel Down before the first rally of the new Bull Cycle. The pull-back was contained above the 0.786 Fibonacci retracement level. Once the price broke above the 1D MA50 but more clearly above the 1D MA100 (green trend-line), there was considerable buying accumulation that in just over one month broke also above the 1D MA200 (orange trend-line) to reach the 2.0 Fibonacci extension. This Fib is on today's set-up around 32700. The 1D MACD patterns so far are fairly similar. One more Bullish Cross on the MACD may confirm the bias to break above the 1D MA50 initially.
Do you think that as long as the 0.786 Fib holds and the 1D MA100 breaks, BTC can reach 32700? Feel free to share your work and let me know in the comments section below!
--------------------------------------------------------------------------------------------------------
Please like, subscribe and share your ideas and charts with the community!
--------------------------------------------------------------------------------------------------------

Update: Bitcoin long-term - BTC never lower than $17,607 again⁉️Update: Bitcoin long-term - BTC never lower than $17,607 again ⁉️
When TRIX indicator touched the green support channel in 2015 and 2019...
...the low of the weekly candle before was never seen again later
We also might see a further decline within the channel
What are your thoughts on that comparison dear Crypto Nation?
Follow for updates
*not financial advice
do your own research before investing

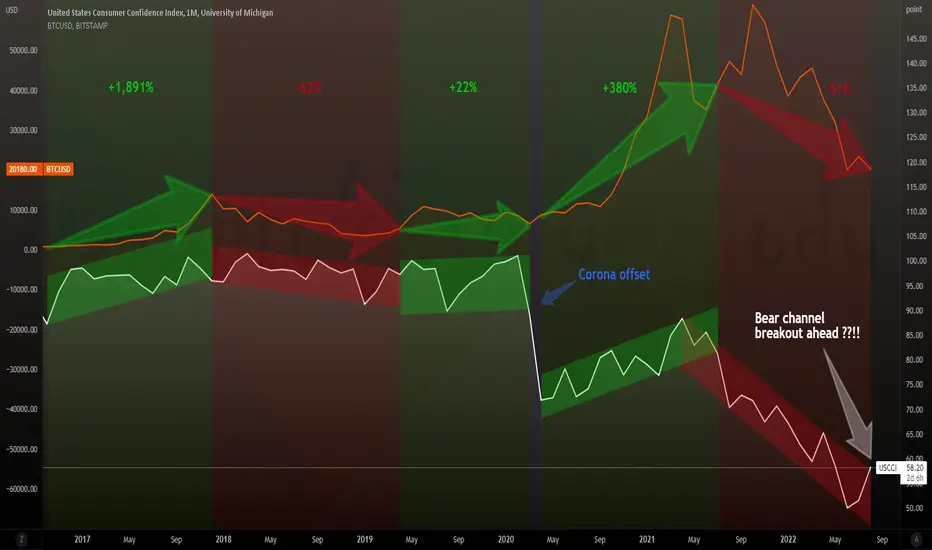
Bitcoin & US Consumer Confidence Index by University of MichiganUS Consumer Confidence Index by University of Michigan
Bitcoin needs a bear channel breakout dear Crypto Nation
Will keep you updated 😎
Follow appreciated 🤗
*not financial advice
do your own research before investing
Bitcoin Long Opportunity 20220829, with a High Risk RewardBlue -> Green * N
BTC , BTCUSD , BTCUSDT , BTCUSDTP, BITCOIN , CRYPTO, CRYPTOCURRENCY
DISCLAIMER
This is only a personal opinion and does NOT serve as investing NOR trading advice.
Please make your own decisions and be responsible for your own investing and trading Activities.

Bitcoin short-term view - BTC above volume profileBitcoin short-term view - BTC above volume profile
(a) Next volume resistance at $20,562 and $21,000
Nice pump... but how substantial dear Crypto Nation?
*not financial advice
do your own research before investing
Bitcoin Hourly Chart Perspective Bitcoin looks bullish on the inverse 1H chart. Inverse 1H Bull flag breakout

The Real Bitcoin BottomThe Real Bitcoin Bottom is clear, currently we are in a bear flag breakdown, targets indicated. EMA ribbons also have proved to be strong resistance in multiple instances, the trend is your friend on this one.

Bitcoin: 17K Test In Range.Bitcoin breaking 20K (again) further confirms bearish momentum which puts the 17K low on the horizon for the coming week. There were 2 sell signals in the previous two weeks (I described both of them in my previous articles and streams). If you are not short, NOW is NOT the time to REACT. The effective thing to do is prepare for what the next signal can look like.
For those who thought Bitcoin was going back to 30 or 40K, as you can see, the market does not agree. If you were lured by big talk by false authorities, it is not them to blame, but instead your own emotional needs. You should know by now hope and fear are what drive the herd. If you are moved by such irrational forces, then YOU are part of the herd, YOU are the profit opportunity. Once again, listen to PRICE not people.
The broader price structure AND economic environment have been BEARISH the ENTIRE summer. Just because Bitcoin went from 17K to 25K does NOT mean ANYTHING in terms of the broader trend (as you can see NOW). As I have mentioned previously, bear market rallies are confusing and hard to grasp because everyone expects "logic" to play a role in the markets. The reality is, it is antithesis of logic that drives markets, also known as irrational behavior. Stop asking "why" and instead as "where" along with "how" price is likely to behave. TRUST the price, it is a reflection of ALL the known information in the world in a given moment.
Lower highs often lead to lower lows. As I wrote previously, 24K is now a LOWER HIGH. There is also a minor lower high in the 21K to 22K area. The entire zone between 22 and 25K was a potential resistance area where this type of activity was reasonable to expect. The fact that price could not clear this zone is what helped me maintain a BEARISH outlook (even though I do not short Bitcoin).
Getting short now carries too much risk because the 20K area can see short squeezes. This type of situation is best for smaller time frame ideas, NOT for swing trades. As far as a new short, either price retests the 22 to 23K area followed by a new sell setup OR a momentum continuation pattern appears (inside bar) followed by a break of the low of that inside bar. At this moment, there is NO setup which means there is NO reason to do anything.
Keep in mind, price may just continue lower without any signal. Betting on this is extremely aggressive. The reward/risk at this price is not attractive if 17K is to be used as the measure for potential. What if 17K breaks? Then 14K becomes the next reference point.
There is no reason to be long at this time. If you looking to invest, keep it SMALL. We are in a very unfriendly economic environment for highly speculative assets like Bitcoin. The S&P sold off for the SAME reason. Don't fight the Federal Reserve.
Thank you for considering my analysis and perspective. I hope you find it helpful.

BITCOIN Will the pivot line hold again?Bitcoin (BTCUSD) has completed nine days below the 1D MA50 (blue trend-line) as it failed to capitalize on last week's slow rise and got rejected on Friday just before breaking it following Powell's comments on the Fed's outlook.
This downtrend has started on August 15, after the price got rejected exactly on the 1D MA100 (green trend-line). The last time we saw a similar rejection was on March 02. BTC also suffered a short-term pull-back, before rebounding again to the 1D MA200 (orange trend-line) and eventually starting the new selling sequence.
A key during the Nov 2021 - March 2022 phase was the Pivot trend-line (1) which at first was a perfect Resistance but then on the shorter-term turned into a Support, which gave the critical bounce to the 1D MA100 and the 1D MA200.
We have an identical trend-line (2) since March that has been acting as a Resistance since July 20 and after breaking, has held so far twice, with the first bounce giving the 1D MA100 test. If it holds, there are high chances of starting a new rebound towards the 1D MA200. If not, the fractal model is invalidated and should put the 1W MA300 to test.
Notice also that the Ichimoku Cloud is now on green territory. When that happened on March 25, Bitcoin had already started the rebound to the 1D MA200.
So do you think the Pivot trend-line will hold? Feel free to share your work and let me know in the comments section below!
--------------------------------------------------------------------------------------------------------
Please like, subscribe and share your ideas and charts with the community!
--------------------------------------------------------------------------------------------------------

Bitcoin BTC weekly EMA20 ❌ EMA200 crossBitcoin weekly EMA20 ❌ EMA200 cross
Bad times to buy BTC by looking at the DEMA indicator as well❓
What do experienced investors think... dear Crypto Nation ⁉️😎
Likes, comments and Follow appreciated 🤗
*not financial advice
do your own research before investing
