BITCOIN 12H TA: Bearish Move?In the previous analysis, we mentioned possible scenarios regarding the failure of the support and resistance areas, which has now reached the bottom of the trend line after an unsuccessful rise. I expect a fall to the $19,500 area as a downside target. To change the upward trend, the price needs to reach above the trend line again.
Its not Buy or Sell SIGNAL
DYOR
BY : M.TeriZ - @AtonicShark
Bitcoin-btcusd-btc

reverse of Bitcoin🟠and the Trimmed Mean PCE🔵inflation rateSee the reverse of Bitcoin🟠and the Trimmed Mean PCE🔵inflation rate
The Trimmed Mean PCE inflation rate is an alternative measure of core inflation in the price index for personal consumption expenditures
What will the next month offer dear Crypto Nation?
*not financial advice
do your own research before investing

Bitcoin short-term view - BTC breakout of bear flagBitcoin short-term view - BTC breakout of bear flag
(a) at volume support $20,562 after loosing $21,000
(b) next lower price action support at $20,137
2017 ATH at $19,892 - will we touch again dear Crypto Nation?
*not financial advice
do your own research before investing

BITCOIN Cyclical 1D MA200 model shows bottom & bullish break-outBitcoin (BTCUSD) tends to have a constant cyclical behavior, repeating certain aspects over and over again during each Cycle. The model that I will quickly analyze on today's post is no different and it involves the 1D MA200 (orange trend-line).
** Similar dips and break-out durations **
On this 1W time-frame, you can see that during the past two Cycles, the price dipped -65% (Jan 12 2015) and -63% (December 10 2018) after the last rejection on the 1D MA200, before making the Bottom of the Bear Cycle. Also, the times from the rejections until the price broke again above the 1D MA200 are comparable, as it respectively took 33 weeks (231 days) to break above it on June 29 2015 and 36 weeks (252 days) on the April 01 2019 1W candle.
As you see, those are roughly identical numbers and continue to hold during the current Cycle as well, as the drop from the last 1D MA200 rejection (March 28 2022 candle) to the June 13 2022 Low, has also been -63%, making it a bottom according to the model. If this process is fulfilled, then the price will break above the 1D MA200 again by the week of December 05 2022 the latest.
** Williams Alligator showing the Bottom is in **
An additional indicator that brings value to this model, is the Williams Alligator used on a 3W time-frame here. As shown during the past two Cycles, the market Bottom was made right when the green trend-line (lips) crossed below the blue trend-line (jaw). Similarly when the green trend-line crossed back above the blue, BTC had already started rising into the new Bull Cycle and that was an indication that the first rally of the Cycle made its top.
So do you think that this model will be repeated once more, meaning that the market has already bottomed and Bitcoin will break above the 1D MA200 by the week of December 05 2022 the latest? Feel free to share your work and let me know in the comments section below!
P.S. Because the chart has the added element of the Williams Alligator plotted and pinned to scale Z, it is not constant and may appear distorted based on your screen's/ browser dimensions. The original looks like this below, so if yours doesn't, adjust the vertical/ horizontal axis in order to make it look like this and better understand what is illustrated:
--------------------------------------------------------------------------------------------------------
Please like, subscribe and share your ideas and charts with the community!
--------------------------------------------------------------------------------------------------------


Update: Nasdaq with reaction at golden trendlineAgain... these times Bitcoin and Nasdaq are in line
Since Bitcoin is at the golden trendline support (see my other ideas) we see a nice reaction for Nasdaq as well
So what do you think - is Nasdaq about to bottom at this golden trendline?
Let me know your thoughts
*not financial advice
do your own research before investing

Bitcoin BTC - exciting times - golden trendline since 2011Bitcoin - exciting times - golden trendline since 2011
Still support for BTC at all...
What would a break through the downside mean to you?
Let me know dear Crypto Nation?
*not financial advice
do your own research before investing

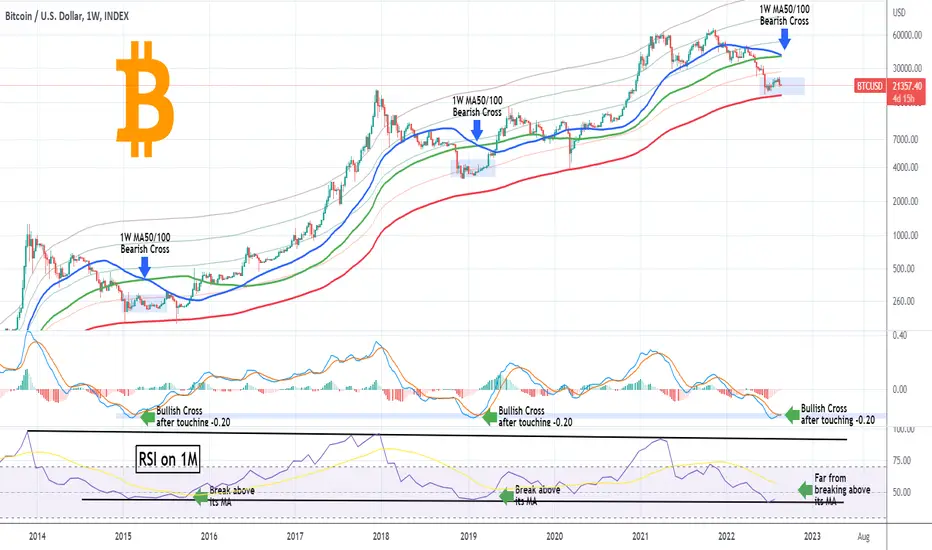
BITCOIN 1W MA50/100 Cross! No better time to buy than now!Bitcoin (BTCUSD) saw a strong pull-back last week after it failed to break above its 1D MA100 and got rejected. We've already addressed that but what we do need to update you on is the fact that the 1W MA50 (blue trend-line) is crossing below the 1W MA100 (green trend-line). This is technically a Bearish Cross but as the chart shows, during the previous two Bear Cycles, it has always been a signal that the price has formed its Cycle low and that BTC was inside the Accumulation Zone leading to the new Bull Cycle.
It is evident that the current price action is very similar to those of February 2019 and April 2015 where BTC made its 1W MA50/100 Bearish Cross following a pull-back. With the 1W MA300 supporting, we may be closer to a 2015 type price action than 2019. In any case, there is another important set of indicators showing that the bottom is in.
First the 1W LMACD making a Bullish Cross. Every time it made this formation after touching the -0.20 level, BTC was well inside the Accumulation Zone of the new Bull Cycle.
Secondly, the RSI on the 1M time-frame hit and is rebounding on the historic Lower Lows trend-line (Support). Every time this happened the Cycle bottom was in and when the RSI broke above its MA (yellow trend-line), a new rally (first of the Bull Cycle) started above the 1W MA50.
Do you agree that this indicator combo is enough evidence that the time to buy is now? Feel free to share your work and let me know in the comments section below!
--------------------------------------------------------------------------------------------------------
Please like, subscribe and share your ideas and charts with the community!
--------------------------------------------------------------------------------------------------------
Connection US GDP and Bitcoin quarterly performanceBitcoin and Crypto Nation... eat this ‼️
Found an interesting connection of quarterly reported US GDP and the prediction of the following quarter performance of BTC - no joke - look at the chart ‼️
Kind of sentiment effect IMO
Thursday GDP increase expected - bullish Q3 for Bitcoin ??!!
Tell me your thoughts in that idea
*not financial advice
do your own research before investing

Bitcoin short-term view - BTC breakout of falling wedge(a) Bitcoin short-term view - BTC breakout of falling wedge
(b) not a massive falling wedge - breakout target at $22,210
(c) should be difficult to get above SMA200 and EMA50 (4h chart) quick
*not financial advice
do your own research before investing

US10Y-US02Y interesting connection of RVGI indicator and BitcoinUS10Y-US02Y interesting connection of RVGI indicator and Bitcoin
Except at one false signal June 2018 every cross in the extreme area of this indicator marked quite good Entry or Exit points for BTC
Seems the next cross for a possible Entry point is ahead dear Crypto Nation
*not financial advice
do your own research before investing

BITCOIN 1H TA: Can break last HH?I determined the support and resistance range and drew the possible scenarios according to the trend line. Of course, he was unable to overcome the previous peak. If the support range and trend line are lost, the analysis will be updated.
Its not Buy or Sell SIGNAL
DYOR
BY : M.TeriZ - @AtonicShark

September is typically a pretty painful month.I don't believe there is any possibility for any significant bullish trend that can exist in the coming weeks. A green day here and there, but it looks like pain is in the forecast. Time to simply trade the chart.

BTCUSD Miner Capitulation ended! Best Buy but eyes on the USD.Two days ago the Hash Ribbon on the well-known indicator flashed a buy signal, technically ending the Miner Capitulation! What does this mean for Bitcoin (BTCUSD)? Well historically, Miner Capitulation periods have occurred on absolute market bottoms (or lows during uptrends), providing the most attractive buy entries. The 'blue' buy signal on this indicator practically marks the end of this period, which gives the most optimal entry for a long-term investor.
With the price being within the Buy Zone that comes all the way from the previous Bear Cycle bottom, still on Higher Lows, continuing to imitate the December - March 2019 bottom formation process, we may be in a spot similar to Jan 12 2019, when the price broke below its 1D MA50 (blue trend-line) after having marginally broken above it previously, stayed below for 2-3 weeks but when it recovered it again, it didn't break it for months, starting the first rally into the new Bull Cycle. BTC is again currently below the 1D MA50 after trading above it for the majority of August. A break above it again, could be the last we see for months, initiating the new rally.
The only objection we have against this pattern getting repeated, is the U.S. Dollar Index (DXY) displayed by the green trend-line, which has been rising aggressively since mid August and is something that isn't consistent with Bitcoin rallies. Technically, BTC doesn't rise when the USD rises as well. Check the recent history where all major bottoms (Dec 2019 and March 2020) have coincided with the USD trading at least sideways.
Do you think however that the Miners Capitulation ending can provide a boost strong enough on its own regardless of the rising USD? Feel free to share your work and let me know in the comments section below!
--------------------------------------------------------------------------------------------------------
Please like, subscribe and share your ideas and charts with the community!
--------------------------------------------------------------------------------------------------------

simple trading plan for BTC 2022-2023I divided the whole range in 4 simple areas.
My plan is to wait for the price to dip in the "Buy-The-F**king-Dip-For-F**k-Sakes" area and just hodl it.
If the price decides to go up before the dip, then I will take short position at the "da resistance" area.
If my short gets liquidated, then I will ape into long cuz we are going to Valhalla.

BTCUSDT A quick and thorny way of growth BTC price to $180-230kToday, you have two fractals with a positive scenario at the base.
A quick scenario - growth from the current BTCUSDT price to $180,000 by the end of May 2023.
Thorny way - predicts a protracted consolidation of the Bitcoin price in the range of $20,000-26,000 until May 2023. And only after that, long-term growth can begin with the goal of $230,000 by June 2025.
In both scenarios, the critical point is the $19800 level.
If the BTCUSD price fixing below this level, then the next strong support is far from below - in the area of $12,000 per BTC
_______________________________
Since 2016 , we have been analyzing and trading the cryptocurrency market.
We transform our knowledge, trading moods and experience into ideas. Each "like under the idea" boosts the level of our happiness by 0.05%. If we help you to be calmer and richer — help us to be happier :)
