BTCUSD targeting 108000 on the next leg up.Bitcoin is trading inside a Channel Up, having just rebounded on the MA100 (4h).
In the last 2 months, it accumulates on the same pattern, a Falling Resistance bottoms on an Arc and when it breaks, a rally delivers a new High.
Trading Plan:
1. Buy on the current market price.
Targets:
1. 108000 (dashed trendline).
Tips:
1. The RSI (4h) gives a very clear buy signal when it breaks 35.00. Currently that shows that we've already bottomed.
Please like, follow and comment!!
Notes:
Past trading plan:
Bitcoin-btcusd-btc

BTCUSD: Is 300k a realistic target?Despite the weekly correction, Bitcoin remains bullish on its 1D technical outlook (RSI = 66.961, MACD = 5631.400< ADX = 43.561) and even overbought on the 1W timeframe (RSI = 74.750). That is because the market has started the final parabolic rally, the cycle's most aggressive phase, supported by the 1W MA50. It can stay overbought until the top, the end of the cycle. Based on the 1W CCI, we may be in a 3 week consolidation stage before the rally resumes. According to the previous Cycle, this happened a little over the 0.5 Fibonacci level. Taking a +1,895.45% rise from the bottom, we can see that the exact same position is applied on the current Cycle and stage.
Does this mean that we can see $300,000 as this Cycle's top? Technically yes but it goes against Bitcoin's Theory of Diminishing Returns. Of course, this Cycle is different as we are already over the previous Cycle's ATH, while in November 2020 we were exactly on it. This is due to the launch of the Bitcoin ETF, which has accelerated its growth, so maybe the capital inflows will extend this Cycle beyond what should have been based on the diminishing returns.
## If you like our free content follow our profile to get more daily ideas. ##
## Comments and likes are greatly appreciated. ##

BITCOIN rejected on the 1st real Resistance of the Bull Cycle.Yesterday's brutal Bitcoin (BTCUSD) rejection caught the majority of the market off guard. There are a few fundamental reasons, there is the exhaustion of the post-election euphoria, there is the psychological weight of the $100000 barrier. However there is one major technical reason that has gone under the radar and we'll explain it to you below.
** The Fibonacci Channel and the 0.236 Fib **
As you can see on this chart, the underlying pattern has been a Fibonacci Channel going through the last 3 Cycles (including the current one). The pattern started with a strong rebound on its bottom (green circle) that formed the December 2013 Top. That Cycle Top was on the 0.236 Fibonacci level of the Cycle and that is a level that rejected rallies during Bull Cycles on June 24 2019 and May 11 2024.
** The '1st Real Resistance of the Bull Cycle' **
That is the Fib trend-line that (more recently) rejected the uptrend on November 22. We can call this the '1st Real Resistance of the Bull Cycle' as this is the first major rejection level that a Bull Cycle faces before the eventual Top. That high during the last 2 Cycles has been on the 0.0 Fibonacci level, technically the top of the Channel (red circles). The red spot on the current Cycle in late 2025 doesn't represent a projection but is an illustration for comparison purposes.
** Top timing and the 1W MA50 **
On a side-note, it is interesting to observe that the duration of each of the past Bull Cycles has been roughly 150 weeks (1050 days) so a repeat of this pattern would give us a High towards the end of September/ early October. It is much better to try to time the High and sell that put an actual price tag on it. Equally interesting is the fact that even though BTC is on a technical rejection, the current rally started on the August 05 2024 Low, exactly on the 1W MA50 (blue trend-line). Technically, as long as this trend-line holds, the cyclical bullish wave should stay intact.
But what do you think? Do you think the 0.236 Fib i.e. the '1st Real Resistance of the Bull Cycle' will extend the correction? Feel free to let us know in the comments section below!
-------------------------------------------------------------------------------
** Please LIKE 👍, FOLLOW ✅, SHARE 🙌 and COMMENT ✍ if you enjoy this idea! Also share your ideas and charts in the comments section below! This is best way to keep it relevant, support us, keep the content here free and allow the idea to reach as many people as possible. **
-------------------------------------------------------------------------------
💸💸💸💸💸💸
👇 👇 👇 👇 👇 👇

Bitcoin 4 Year Fractal update 2022 I've created this because I've had literally tens of people messaging me asking for an updated chart - There isnt a huge amount to update from the last one- we topped at the right time, wrong price - I've retraced 80-85% and then onward to a price target of 330k.
Trying to predict the price of a relatively new, risk asset in the middle of a pandemic and world war 3 is pretty poinless but this might be a bit of fun to track and its max pain for a lot of people, buying at 69k, seeing it drop into the teens then staying in the 20s for a year will flush a lot of people out...
But like I say, I dont think price can be held that low for long, there simply isnt enough corn and theres a lot of hodlers now.

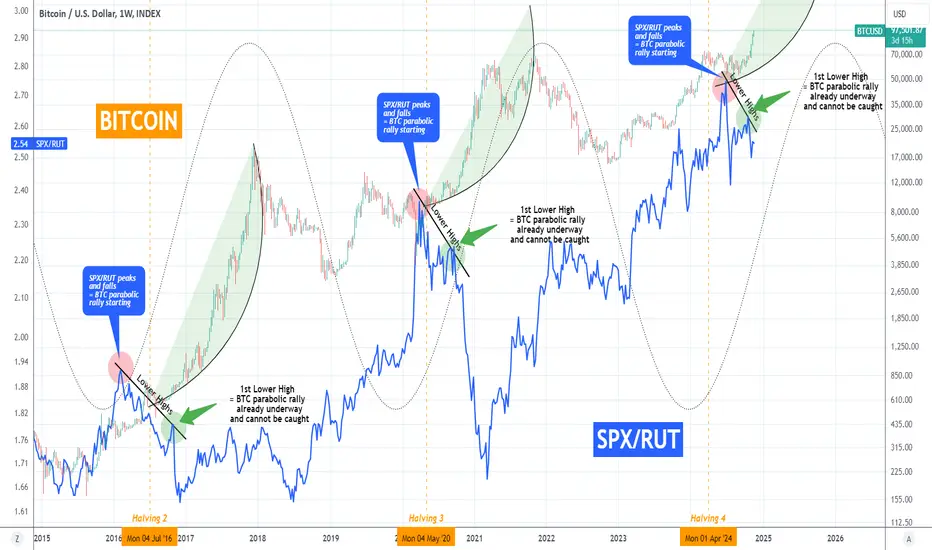
BITCOIN rally cant get caught anymore and SPXRUT ratio shows whyIt's beyond doubt now that Bitcoin (BTCUSD) has started the new Parabolic Rally (PR), technically the most aggressive phase of the Bull Cycle. We've made numerous analyses in the past explaining on time why we expected this break-out to take place after 7 months of accumulation.
What we bring to you today is the SPX/RUT ratio, the correlation of the S&P500 (SPX) and Russell 2000 (RUT) indices against BTC and how it confirms that this rally will now accelerate to a pace that it won't be easy to get caught (i.e. bought).
The SPX/RUT ratio is displayed by the blue trend-line. The ratio is particularly helpful during Bitcoin's Parabolic Rally phase as their correlation is mostly a negative one, meaning when the ratio falls, Bitcoin rises. On this chart, this correlation is present on a cyclical basis. This means that during every Cycle, it displays a behavioral pattern that is common.
The key characteristic here is the Lower Highs pattern that the ratio forms every Cycle around the Halving time. As you can see, when SPX/RUT peaks (red circle) and starts forming Lower Highs, Bitcoin stars its Parabolic Rally (green arc). On the 1st Lower High, BTC's rally is already underway and has entered the stage where due to the sheer buying pressure and aggression, getting an entry is difficult. The Lower Highs on SPX/RUT also signify a shift from big capitalization stocks to low, i.e. an increasing appetite for riskier assets and that transcends to the Bitcoin market as well.
So what do you think? Does the SPX/RUT ratio indicate that we've started the part of BTC's rally that is hard to catch? Feel free to let us know in the comments section below!
-------------------------------------------------------------------------------
** Please LIKE 👍, FOLLOW ✅, SHARE 🙌 and COMMENT ✍ if you enjoy this idea! Also share your ideas and charts in the comments section below! This is best way to keep it relevant, support us, keep the content here free and allow the idea to reach as many people as possible. **
-------------------------------------------------------------------------------
💸💸💸💸💸💸
👇 👇 👇 👇 👇 👇
BITCOIN Will Keep Growing! Buy!
Hello,Traders!
BITCOIN is trading in an
Uptrend and the pair is
Now trying to make a
Breakout of the key
Horizontal level of 93k$
So IF the breakout is
Confirmed we will be
Expecting a further move up
Buy!
Like, comment and subscribe to help us grow!
Check out other forecasts below too!

This is the way, BTCThis is the only way.
TV wants me to say something more, I can´t, because this is the way!
gosh, TV ruin the chart, so,
Green = % change change
Red = days/bars change change
remember, the only way.

BITCOIN Pi Cycle Theory aiming at $120k at least!Following Bitcoin's (BTCUSD) new All Time High in the aftermath of the U.S. elections, we've established on previous posts that we've entered the final year (12 months) of this Bull Cycle. This is clearly visible by the use of the Sine Waves as shown on this 1W chart.
** Pi Cycle **
The new aspect we're bringing to you today is the Pi Cycle indicator, which has proven to be as consistent as any other at projecting the long-term price action of Bitcoin. As you can see every Cycle Top has been considerably above the Top Pi Band (red trend-line) and we're currently trading $30k below where this level is now. This means that it is only a matter of time for BTC to 'attack' $120k and break it.
** 1W RSI kickstarting the aggression **
We are at a point where the new rally phase that started after the price tested, held and rebounded on the 1W MA50 back in early August, will start getting more and more aggressive. The final bullish signal was given last week after the 1W RSI closed above 70.00 (vertical orange dashed line). As you can see, during the previous two Cycles, every time Bitcoin closed the 1W RSI above 70.00, the Cycle peaked 54 weeks later (roughly 365 days). There is no reason to expect otherwise this time also, as this projected date (week of November 24 2025) falls exactly on the Sine Wave's Top.
Notice also that during the most aggressive part of the Parabolic Rally, the 1D MA100 (blue trend-line) tends to Support. And before that, when that crosses above the Bottom Pi band (green trend-line), the indicator gives a confirmed buy signal for the whole Cycle.
** Timing the market is everything **
The question now is how high can the price get? Well according to those estimates, a peak above the Top Pi Band can be anywhere within the $150k - $200k range, and that could be a conservative estimate. But lucky enough, with technical tools like the one we present to you today, we can time the market (thus our exits/ sells) almost perfectly and get out as high as possible, without having an absolute Target in mind.
But what do you think? Are you also expecting the rally to start getting even more aggressive and break above $120k? Feel free to let us know in the comments section below!
-------------------------------------------------------------------------------
** Please LIKE 👍, FOLLOW ✅, SHARE 🙌 and COMMENT ✍ if you enjoy this idea! Also share your ideas and charts in the comments section below! This is best way to keep it relevant, support us, keep the content here free and allow the idea to reach as many people as possible. **
-------------------------------------------------------------------------------
💸💸💸💸💸💸
👇 👇 👇 👇 👇 👇

BTCUSD: Timing the top is better than setting an actual target.Bitcoin is overbought on its 1W technical outlook (RSI = 73.472, MACD = 6115.900, ADX = 33.802) as it made new All Time Highs last week on an amazing post election bullish breakout. The 1W MACD is on a Bullish Cross, the very same buy signal it flashed before every ATH breakout. During the previous Cycle, Bitcoin peaked 45 weeks after the breakout and the one before 35 weeks after. Since the Cycle is calculated to peak towards the end of 2025, it is only reasonable to assume that this is an arithmetic progression and we will see the top probably on 10 weeks more than the previous Cycle, i.e. in 55 weeks. That places it around November 2025. If you don't have a specific target in mind, it is much more reasonable to time your sells at whatever price BTC will be at from September 2025 onwards, so that you can exit as high as possible with the maximum profit.
## If you like our free content follow our profile to get more daily ideas. ##
## Comments and likes are greatly appreciated. ##

Bitcoin: 100K? 85K More Probable.Bitcoin has gone nuts thanks to the historical election catalyst. Unusual situations such as these often provide lots of opportunity but that opportunity comes in forms that may not be so obvious to many. In situations where a market makes new all time highs, I do not get caught up with what the crowd is saying, and instead measure the affects of such a move in terms of RISK.
There are going to be LOTS of wild forecasts. The typical "expert" tends to overreact along with telling people what they want to hear in order to attract eye balls. The rational question is: what is the RISK for investors, swing traders, day traders, etc?
In terms of the broader perspective, Bitcoin has broken out of the consolidation that was in play since March. The move appears to be a broader Wave 5, which means a test of 100K or higher is within reason as a result of this breakout. People who called this move years ago look like geniuses only by coincidence (if the election went the other way, Bitcoin may have also). While there is NOTHING bearish to consider at the moment, this situation is best for those who bought much earlier. When markets look their best, that is usually the WORST time to buy not because of some bearish reason, but because of the inherent RISK.
Investors and swing traders are assuming the MOST risk at these levels. The nearest supportive area (by proportion) is somewhere between 83K and 78K (see rectangle, arrow). A 6K to 10K+ retrace is very possible and can come out of no where for any reason (have you seen the -500+ Nasdaq?). Fundamentals do not matter in these high momentum situations. If you are not willing to take that kind of risk, then taking on new positions at these levels with the intention of staying in for the 100K break out is NOT in your best interest. The probability of a retrace increases as the market pushes higher. The rational thing to do is be patient, WAIT for the retrace. Markets do NOT move in straight lines.
The better opportunity in my opinion is on the smaller time frames (day trade). 1000 points per hour in some cases, this is where you can take relatively smaller risk (if you know how to control it) while capturing some wild moves. There is a number of supports for this time frame but the more obvious one is around the 87K area. With this type of price action you can play both long and short and avoid the broader risk by not taking any overnights. A tool like my Trade Scanner Pro works well in a high momentum environment like this one, especially when it comes time to defining risk and profit objectives.
The illustration on the chart shows the scenario that I anticipate on the daily time frame for the coming week. It MAY or MAY NOT unfold this way. It may touch the 95K resistance first. There is no way to know in advance, the key is to have some idea of what scenario is within reason and then act when the market CONFIRMS.
While there is a clear bias in price structure, we must always respect that MARKETS are HIGHLY random and things can change fast. A strong market can easily retrace and yet it is still strong. Know your higher probability levels in advance and wait for the market to prove itself. Otherwise, if your the type who depends on hope in tough situations, your profits during this wild time will be brief.
Thank you for considering my analysis and perspective.

BITCOIN Bearish Breakout! Sell!
Hello,Traders!
BITCOIN was trading in a
Super strong uptrend
But now we are seeing a
Bearish breakout so we
Will be expecting a local
Bearish move down
Sell!
Like, comment and subscribe to help us grow!
Check out other forecasts below too!

BITCOIN buying pressure indeed stronger than any Cycle before!Three months ago (August 12, see chart below) we published our view on Bitcoin (BTCUSD) claiming that on the current levels and compared to the relative stages it was in previous Cycles, the bullish trend was stronger than ever before:
At the time the price was 'just' at GETTEX:59K and yesterday it touched the $90000 level. This shouldn't surprise you as the pattern has been 'playing out' in a similar way to both the 2019 - 2021 and 2015 - 2017 Bull Cycles.
In fact it is so strong that we now need to readjust the green parabolic channel of the current (2023 - 2025) Bull Cycle to a more aggressive pattern in order to fit the enormous rally that started in September.
As you can see this comparison with the previous Cycles suggests that BTC can reach at least the -0.618 Fibonacci extension, which is a little over $170000, like the other two did. It also highlights how the current Cycle has been more aggressive than the previous as the price reached the All Time High faster (March 2024) than the previous two but also the amazing symmetry among them as the current (final) parabolic rally that started on the August 05 2024 bottom took place 90 weeks (630 days) after the November 2022 bottom. As you see both in 2020 and 2016 the final parabolic rally also started 90 weeks after their respective Cycle bottoms.
So do you agree that the current rally shows the current buying pressure is more aggressive than in previous Cycles at this stage? Feel free to let us know in the comments section below!
-------------------------------------------------------------------------------
** Please LIKE 👍, FOLLOW ✅, SHARE 🙌 and COMMENT ✍ if you enjoy this idea! Also share your ideas and charts in the comments section below! This is best way to keep it relevant, support us, keep the content here free and allow the idea to reach as many people as possible. **
-------------------------------------------------------------------------------
💸💸💸💸💸💸
👇 👇 👇 👇 👇 👇

BITCOIN Can it repeat last year and reach $140000?It was less than a month (October 14, see chart below) when we updated our old Bitcoin (BTCUSD) Channel Up idea of June 07, calling for the confirmed start of the new Bullish Leg of the Channel Up and setting a medium-term Target of $94500:
New evidence following the U.S. elections suggest that the aggressive nature of the past weekly rally can see BTC target even higher, more specifically the top of the Channel Up by Q2 2025.
As you can see, the price is currently between the 0.5 - 0.618 Fibonacci Channel range, which is technically a neutral zone. However it is considerably below the 0.618 horizontal Fib level applied on a potential +198.10% rise (same as the Sep 2023 - March 2024 rally). This showcases the enormous upside potential that exists within this 2-year Channel Up.
The RSI is about to enter the Overbought Zone (>70.00), which when the previous two Bullish Legs started was also while the price was below the 0.618 Fib (especially in the case of the October 20 2023 candle).
As a result, even though our 94500 medium-term Target stands, for the long-term we are targeting 140000, which is almost at the top of the 2-year Channel Up and marginally below a potential +198.11% rise. Notice that the two lengthy corrections (green Rectangles) within the pattern started only when the RSI formed a Lower High below the overbought level (<70.00).
So what do you think? Is Bitcoin still so undervalued at the moment, despite last week's surge, that it can even hit $140k? Feel free to let us know in the comments section below!
-------------------------------------------------------------------------------
** Please LIKE 👍, FOLLOW ✅, SHARE 🙌 and COMMENT ✍ if you enjoy this idea! Also share your ideas and charts in the comments section below! This is best way to keep it relevant, support us, keep the content here free and allow the idea to reach as many people as possible. **
-------------------------------------------------------------------------------
💸💸💸💸💸💸
👇 👇 👇 👇 👇 👇

BITCOIN Will Keep Growing! Buy!
Hello,Traders!
BITCOIN keeps growing
And we are seeing a
Strong bullish breakout
Of the key level around 74k$
Which reinforces our bullish
Bias and we will be expecting
A further move up
Buy!
Like, comment and subscribe to help us grow!
Check out other forecasts below too!

BTCUSD Can it repeat Nikkei's 80s mania phase?This is of course a highly speculative but fun chart between Bitcoin / BTCUSD and Nikkei.
As you can see Bitcoin has been following Nikkei's post 1950 parabolic curve up to the point that it tested the 1month MA50 and rebounded aggressively to cross above the curve.
That was Nikkei's 80s Mania Phase that inflated the economic Bubble that burst emphatically and caused hyperinflation, not allowing Japan to recover up to this date.
Bitcoin is based on that comparison on a similar pre-breakout situation.
If it does break above the parabolic curve, which will mean a new narrative for Bitcoin with industry wide adoption and commerce use, we should be seeing (again based on this Nikkei comparison) an extension to the 10 Fibonacci level.
Previous chart:
Follow us, like the idea and leave a comment below!!

BITCOIN fully supported targeting $170k after the ATH breaks.Exactly 3 months ago (August 05, see chart below) when the price was on the 1W MA50 (blue trend-line), having hit it for the first time since the week of March 12 2003, we claimed that this was the last stand for Bitcoin (BTCUSD) if the market wanted to maintain the Bull Cycle, as based on the previous 3 Cycles, it was the absolute supporting trend-line:
The 1W MA50 eventually held not once but twice and that gave way to a rally that last week tested the 73800 All Time High (ATH). That is incredibly bullish, especially only two days before the U.S. elections, as from the historic patterns we've shown you before, a Parabolic Rally has started after each election.
So according to our August comparison chart, if history is repeated, BTC is looking towards at least the 1.618 Fibonacci extension from the ATH, which is roughly a little over $170k.
But what do you think? Are you expecting the ATH test to start a massive rally similar to all previous Cycles? And if so, is $170000 a realistic Target? Feel free to let us know in the comments section below!
-------------------------------------------------------------------------------
** Please LIKE 👍, FOLLOW ✅, SHARE 🙌 and COMMENT ✍ if you enjoy this idea! Also share your ideas and charts in the comments section below! This is best way to keep it relevant, support us, keep the content here free and allow the idea to reach as many people as possible. **
-------------------------------------------------------------------------------
💸💸💸💸💸💸
👇 👇 👇 👇 👇 👇

BITCOIN BULLISH BIAS|LONG|
✅BITCOIN is going down now
But a strong support level is ahead at 66,000$
Thus I am expecting a rebound
And a move up towards the target at 71,000$
LONG🚀
✅Like and subscribe to never miss a new idea!✅

Bitcoin: Double Top Or Buying Op?Bitcoin missed all time high by 200 points. Are you long from the RISKIEST price location since March? If you observe this price action from a larger time frame (weekly), you should recognize the failed high which is a variation of the classic double top formation. If you got long betting on the break out (on this time frame) and a red candle develops the next day or so (see arrow), that is usually a good reason to exit in order to avoid the 6K to 8K associated risk. Rather than getting stuck in a painful position, it is far more effective to gauge the probability and RISK in advance and adjust to it. Let me explain.
There is no question, Bitcoin is generally strong, but that does NOT guarantee a break out will follow through. Betting on break outs is a viable strategy, you just have to know how to manage the position if it fails. The main idea here is you MUST accept the fact that there is NO WAY To know if the break will fail or succeed in advance. All you can do is ask: if it fails, how much risk am I taking? And your answer will depend on the time frame you are operating within. The larger the time frame, the greater the risk. In the case of the daily chart, the next support is the 68K to 66K area (old resistance/ new support).
Also when taking such a trade, you should be acting on specific entry criteria (some kind of pattern) that provides some level of objectivity to your decision making process. IF you got long as a reaction to a price spike. or worse, as a result of consuming mainstream news, you will find out the hard way that acting on low quality information makes you a profit opportunity for someone else. For optimal results (and to profit from those who react to noise) you MUST have a clear decision making process that defines profit objectives/risk the same way for EVERY trade or investment you make (Trade Scanner Pro).
So what about buying this pullback? That is sensible BUT I have yet to see a buy signal. The location is attractive (see illustration), but without a signal there is no way to measure risk. The other important point is to have a realistic profit objective in terms of PROBABILITY OF PROFIT. While a "higher high" is likely in a bullish trend (74K+?), you have a greater chance of exiting green at a lower price (test of 71.5K). This decision depends on your degree of confidence and willingness to embrace risk. While price is favored to make the higher high, there is NO guarantee. Accept the fact that there is NO WAY to know for sure. You place a bet and hope it works out. And if not, you have a plan in place to control the risk. That is the trader mentality in a nutshell.
If you look at my previous articles, my forecasts (illustrations) have been wrong. I have been anticipating a retrace to a support, but Bitcoin does not agree. It is important for you to understand that at highs I will usually look for a pullback and at lows I will look for a bounce. While this does not work 100% of the time, it has helped me effectively navigate this range bound market that Bitcoin has been gyrating within since March and has yet to break out of.
Unlike many "gurus" I do not pretend to be able to forecast the future, I simply play the probabilities, just like going all in on pocket aces before the flop. It doesn't ALWAYS work, but probability favors a positive outcome because that is the strongest hand you can start with.
The more time you factor into an idea, the less of a chance you have of being accurate. This is because markets are HIGHLY random. Price has retraced off the high and that is ideal for a swing trade long (which can be good for a few days/week). Its just a matter of confirmation at this point. What happens after that is anyone's guess.
Thank you for considering my analysis and perspective.

BITCOIN Risky Long! Buy!
Hello,Traders!
BITCOIN is making a retest
Of the falling support line
While trading in an uptrend
So we are bullish biased
And we will be expecting
A further move up
Buy!
Like, comment and subscribe to help us grow!
Check out other forecasts below too!

BITCOIN GROWTH AHEAD|LONG|
✅BITCOIN fell again to retest the support of 69,000$
But it is a strong key level
So I think that there is a high chance
We will see a bullish rebound and a move up
LONG🚀
✅Like and subscribe to never miss a new idea!✅

BITCOIN Closed 2 straight green 1M candles after 7 months!Bitcoin (BTCUSD) is closing today the monthly (1M) candle and unless it drops by 7000 in a few hours, it will close the month of October in green. That will be the 2nd straight green 1M candle since March!
This 7 month consolidation period is no stranger to BTC as such patterns, where there are no straight green 1M candles, are standard Accumulation Phases that we see during Bull Cycles. So far on the current one we've had three (including March 2024) and once the market closed 2 straight green 1M candles, it rallied.
The 2019 - 2021 Bull Cycle had three such straight green candle occasions and a very clear Accumulation Phase, while the 2015 - 2018 Cycle had numerous. One thing is clear based on this multi-year chart. When the market closes two straight green 1M candles, it is always a good signal to buy.
But what do you think? Do you find this indicator reliable? Are you buying based on this? Feel free to let us know in the comments section below!
-------------------------------------------------------------------------------
** Please LIKE 👍, FOLLOW ✅, SHARE 🙌 and COMMENT ✍ if you enjoy this idea! Also share your ideas and charts in the comments section below! This is best way to keep it relevant, support us, keep the content here free and allow the idea to reach as many people as possible. **
-------------------------------------------------------------------------------
💸💸💸💸💸💸
👇 👇 👇 👇 👇 👇

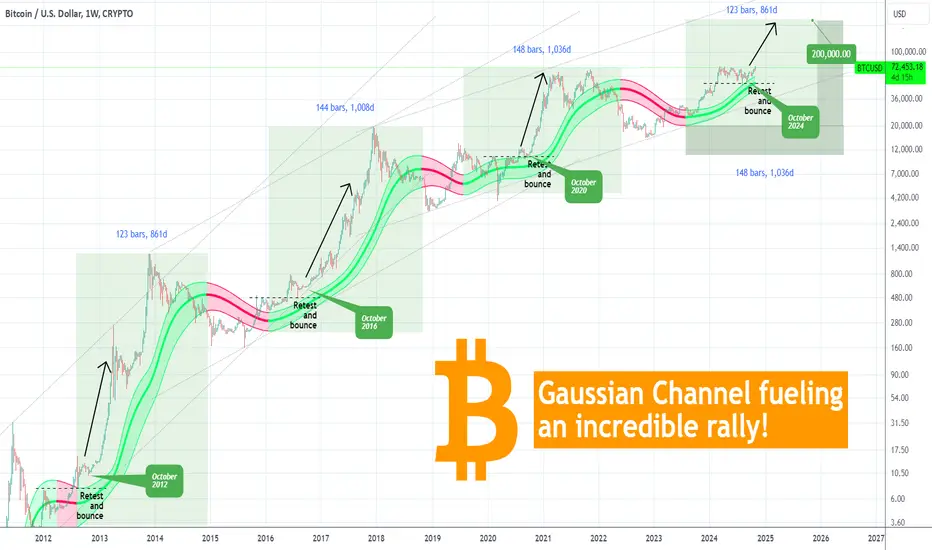
BITCOIN Gaussian Channel telling you the rally has already begunBitcoin (BTCUSD) is illustrated here on the 1W time-frame from the 2011 Cycle until today. We've used the Gaussian Channel (GC) after a long time and the reason is simple. Since the August 05 2024 Low, it has been supporting the uptrend up to today's test of the All Time High (ATH).
** Gaussian October support every 4 years **
This continuous support is a critical feature moving forward as every time the GC held at this stage of the previous Cycles (October 2020, 2016 and 2012), BTC started its final (and most aggressive) Parabolic Rally of the Cycle.
** Resistance turned Support **
What's equally interesting is that during those stages, the price also re-tested and held the former Resistance (of the previous Higher High), turned it into a Support (while the GC held) and bounced to the Parabolic Rally. This is a remarkably consistent feature taking place every 4 years!
** The green GC length matters **
Now as to the GC in more detail. What we want you to keep from it, is that the green part of the GC has lasted in the previous Cycles 123, 144 and 148 weeks respectively, which translates to 861, 1008 and 1036 days, until it turned red. As a result, we can expect the current green phase to last until December 08 2025 (minimum) and June 01 2026 (maximum). It is more reasonable to expect the longer case as the recent Cycles tend to have stabilized most of their common time patterns.
The Bear Cycle tends to start when a 1W candle is closed below the GC. Until then, based on the parallel Channel Up patterns that encompass 3 Cycles each time, we can even expect a price as high as $200000 for this Cycle Top.
Do you think that's realistic? And if so, do you also expect the GC wave to support a parabolic rally all the way to the top? Feel free to let us know in the comments section below!
-------------------------------------------------------------------------------
** Please LIKE 👍, FOLLOW ✅, SHARE 🙌 and COMMENT ✍ if you enjoy this idea! Also share your ideas and charts in the comments section below! This is best way to keep it relevant, support us, keep the content here free and allow the idea to reach as many people as possible. **
-------------------------------------------------------------------------------
💸💸💸💸💸💸
👇 👇 👇 👇 👇 👇
BITCOIN Short From Resistance! Sell!
Hello,Traders!
BITCOIN is retesting a
Horizontal resistance level
Around 74k USD which also
Happens to be an all-time-high
So despite our bullish bias
We will be expecting a
Local bearish correction
Sell!
Like, comment and subscribe to help us grow!
Check out other forecasts below too!
