Bitcoin (BTC/USD) Slammed Back Into Channel SupportBitcoin shed -2.46% today, reversing sharply lower from the top of its descending channel and the 50-day SMA, reaffirming resistance just below $88,700. The rejection puts focus back on the 200-day SMA and mid-channel support.
🔻 Price remains firmly inside the falling channel
📉 MACD is flattening below zero — no bullish crossover yet
⚖️ RSI sits at 44 — modest bearish momentum without being oversold
If price breaks below $79,000, eyes may turn to the lower channel boundary near $72,000, and eventually the long-term trendline closer to $68,000.
Momentum is weak and trend pressure remains tilted downward unless bulls can reclaim the 50-day SMA and break out of this channel decisively.
-MW
Bitcoin-btcusd

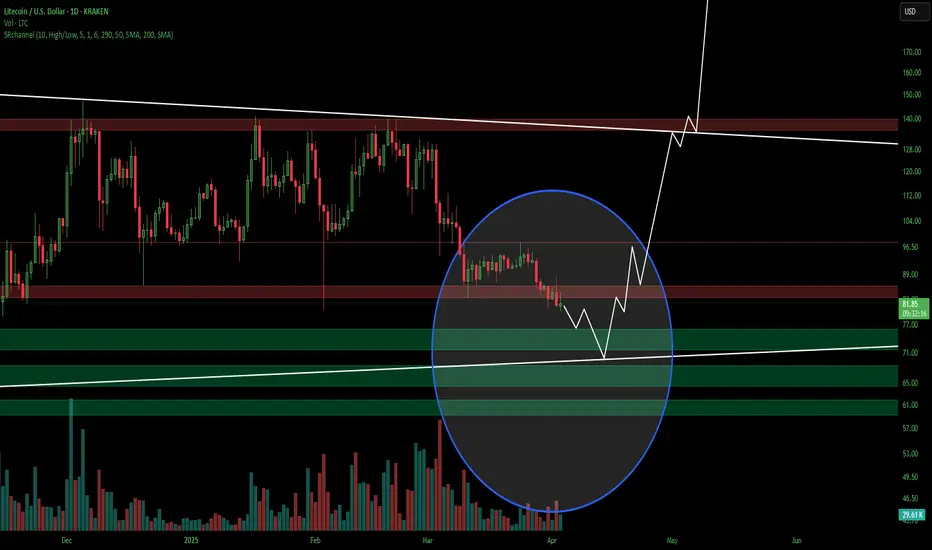
Litecoin LTCUSD Completing Final Leg Down Before LaunchAs you can see Litecoin is forming a very similar pattern. I think the rest of March will be corrective. Litecoin will likely come down and bounce off the trend line which coincidental also is a major support level. April will be slightly bullish, May and June will be majorly bullish which I believe Bitcoin will also fly up to 140k as well in this time. I believe Litecoin will outperform the majority of the market. Major hyperinflation will begin this summer which will be very positive for crypto. Many cryptos will die in this hyperinflation period. Only some will survive. Dollar is going to crash. Get ready for a wild ride into 2026. People calling for a bear market are ill informed and will kick themselves for selling. This is the beginning of the biggest run in some cryptos, we've ever seen. Buckle up. Good luck. Not financial advice.

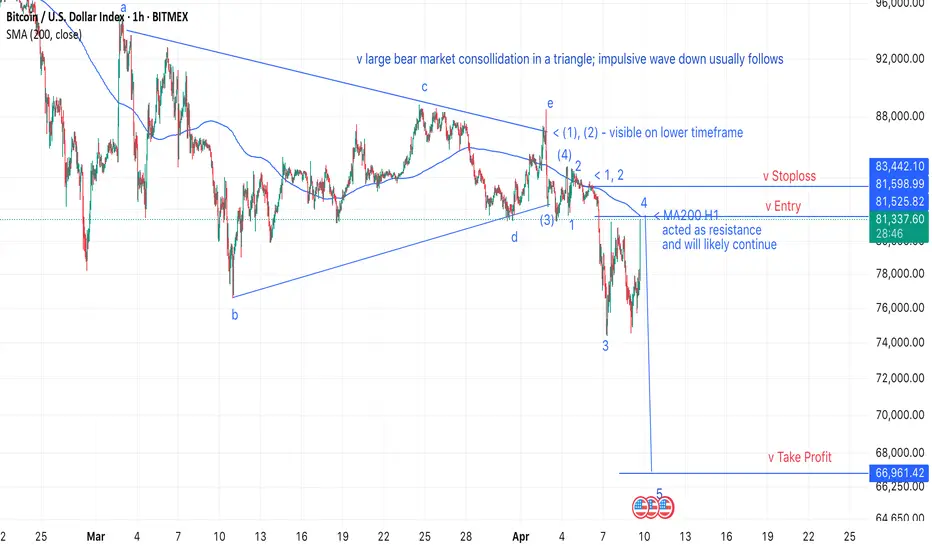
[BTC short] Entry: 81.5k, SL: 83.5k, TP: 67kThe backdrop is my prediction of a 2008-style crash, with Bitcoin (BTC) dropping to $26k (see related ideas).
During the crash, I’ll aim to capitalize on short-term moves, targeting clear patterns with high reward-to-risk ratios.
Following a prolonged consolidation—resembling a triangle—an impulsive wave down has begun to form. I now expect the 200-hour moving average (MA200 H1) to act as resistance, pushing the price to a new low and trade accordingly.
BITCOIN Can a USD sell-off save the Cycle?Bitcoin (BTCUSD) is hanging on its 1W MA50 (blue trend-line) amidst the market chaos and especially following last night's stronger 104% trade tariffs to China from the U.S.
This is a simple yet powerful classic chart, displaying Bitcoin against the U.S. Dollar Index (DXY, black trend-line). This shows the long-term negatively correlated pattern they follow on their Cycles.
Every time DXY entered an aggressive sell-off in the final year of the 4-year Cycle, Bitcoin started its final parabolic rally of its Bull Cycle. This time the DXY peaked exactly at the start of the year (2025) and is on a selling sequence up until today but due to the ongoing Trade War, BTC not only didn't rise but is on a correction too.
Can an even stronger DXY sell-off save the day and complete the 4-year Cycle with a final rally? Feel free to let us know in the comments section below!
-------------------------------------------------------------------------------
** Please LIKE 👍, FOLLOW ✅, SHARE 🙌 and COMMENT ✍ if you enjoy this idea! Also share your ideas and charts in the comments section below! This is best way to keep it relevant, support us, keep the content here free and allow the idea to reach as many people as possible. **
-------------------------------------------------------------------------------
💸💸💸💸💸💸
👇 👇 👇 👇 👇 👇

[BTC] Crash to $26k: Generational Buying OpportunitySince 2022, Bitcoin has surged in a major bull market, hitting the psychological $100k milestone. However, a triple divergence on the weekly RSI signals an overbought market, pointing to an imminent pullback.
The recent peak likely marked the end of Wave (3). Given that Wave (2) was an expanding flat (verifiable on lower timeframes), Wave (4) should bring a sharp, significant correction.
Wave 4 of (3) formed a running triangle, followed by a short Wave 5—exactly as occurred. Running triangles in Wave 4 paired with a brief Wave 5 often indicate distribution, typically preceding a major move against the trend.
The price action from March 2024 into 2025 resembles classic distribution. Since peaking near $110k, Bitcoin has declined slowly but steadily, suggesting a major crash rather than a typical medium-term pullback.
The $26k–$30k range offers robust support, and it’s unlikely the price will drop much lower. Along the way, the 200-week moving average (MA200 Weekly)—Bitcoin’s strongest historical support—could trigger a significant bounce. However, if this level is decisively breached, full-blown panic could ensue.
Given my expectation of a 2008-style bear market in the S&P 500 (see related ideas), the timing aligns perfectly. A market-wide crash would inevitably impact Bitcoin, as panic drives capital out of all markets to meet margin calls.
The $26k zone should mark the crash’s bottom, potentially presenting a generational Bitcoin-buying opportunity. If the S&P 500 retests its COVID lows while Bitcoin only revisits its 2023 consolidation range, it would underscore BTC’s relative strength. Once panic subsides, capital could flood into Bitcoin from across the globe.
Technically, this would be the bottom of Wave (4). Wave (5) could then propel Bitcoin to $1 million per coin in a powerful uptrend.

BTCUSD: Last chance to prove the Bull Cycle is still intact.Bitcoin remains bearish on its 1W technical outlook (RSI = 40.819, MACD = 1234.500, ADX = 47.185) as it is on the 3rd red 1W candle in a row, which just hit the 1W MA50. First contact since Sep 2nd 2024. The weeky low is also almost at the HL bottom of the Bull Cycle's Channel Up. Needless to say, it has to hold in order for the bullish trend to continue. Practically this is the market's last chance to prove that the Bull Cycle is still intact. So far the -32% decline is no different that all prior inside the Channel Up but an Arc shaped bottom needs to start forming. If it does and that's the new bottom, expect $160,000 by September.
## If you like our free content follow our profile to get more daily ideas. ##
## Comments and likes are greatly appreciated. ##

Bitcoin Plan.I tried to explain simply the things to pay attention to.
* The purpose of my graphic drawings is purely educational.
* What i write here is not an investment advice. Please do your own research before investing in any asset.
* Never take my personal opinions as investment advice, you may lose your money.

BITCOIN Is it still on track with past Cycles??Bitcoin (BTCUSD) saw a strong correction last week as well as early trade yesterday on Monday, along with all major stock markets, but had an equally impressive round on Wall Street opening, which keeps it so far above its key 1W MA50 on a potentially weekly closing.
So the critical question now is this: Will it continue the pattern of past Cycles and give one more major rally in 2025?
Well based on the BTC Rainbow Waves, it is still on track and actually in a similar situation as July 2013 when after a 3-month correction/ pull-back sequence, it got back to the Blue Buy Zone and near the Fair Value green trend-line.
As you can see all Cycles peaked on the Red Zone and so far on this Cycle we haven't even reached the 1st orange trend-line. Based on the Time Cycles, the next peak should be around November 2025 and if the price action confirms the Rainbow Wave model again, the closest level to the Red Zone by then would be around $180000.
Do you think that amidst the trade war chaos, that's a realistic expectation? Feel free to let us know in the comments section below!
P.S. I am attaching a snapshot below in case the waves aren't displayed properly on the chart above:
-------------------------------------------------------------------------------
** Please LIKE 👍, FOLLOW ✅, SHARE 🙌 and COMMENT ✍ if you enjoy this idea! Also share your ideas and charts in the comments section below! This is best way to keep it relevant, support us, keep the content here free and allow the idea to reach as many people as possible. **
-------------------------------------------------------------------------------
💸💸💸💸💸💸
👇 👇 👇 👇 👇 👇

Bitcoin Signal for Short Lets Make Some Real GameThis is an educational trading setup for Bitcoin (BTC/USD), focusing on a short position opportunity between the $82,000 and $80,000 price levels. The analysis is based on technical indicators, price action strategies, and current market sentiment. Please note: this is not financial advice, strictly for learning purposes!
📉 Trade Concept:
Entry Zone: $82,000
Target Zone: $80,000
Setup Type: Short / Sell
Timeframe: Short-term / Intraday
Market Context: After an extended bullish rally, BTC/USD is showing signs of exhaustion near key resistance. High probability retracement expected towards the $80,000 support area.
🔍 Educational Insights:
Technical Indicators: Overbought RSI levels, bearish divergence, and candlestick reversal patterns around $82,000 zone.
Psychological Levels: $80,000 is a major psychological number where buyers may step in.
Risk Management: Always use stop-losses and proper risk-reward ratios in live trades.
💡 Purpose of Sharing:
This setup is shared purely for educational purposes to help traders understand how to spot potential short opportunities in volatile markets like Bitcoin. Learn how to analyze resistance zones, manage risk, and read price action effectively.
📢 Disclaimer:
This is not financial advice. For educational purposes only. Always do your own research and consult with a professional before making financial decisions.
#Bitcoin #BTCUSD #CryptoAnalysis #ShortTrade #BitcoinSignal #PriceAction #Educational #TradingStrategy #TechnicalAnalysis #CryptoEducation #LearnTrading #RiskManagement

It could be worse for Gold and Bitcoin, right? Apple alone has shed nearly $640 billion in market capitalisation over just three days. The S&P 500 has fallen more than 10% during the same stretch—its worst performance since the onset of the COVID-19 pandemic. In Asia, the selloff is even more severe, with Japan's Nikkei 225 down nearly 8%, South Korea’s Kospi 200 off almost 6%, and Taiwan equities falling close to 10%, triggering circuit breakers.
In comparison, Bitcoin and Gold, while under pressure, appear to be weathering the downturn with relatively less panic.
Bitcoin has declined around 10%—a notable drop, but not unusual by crypto standards. Trading near $76,000, it has returned to pre-election levels, breaching both short- and long-term support zones.
Gold is tracking its worst three-day performance in over four years. Although some positive forecasts are emerging. Deutsche Bank has revised its year-end gold price forecast upward to $3,350, citing rising recession risks and renewed safe-haven demand.

BTCUSD: Can this M2 supply signal trigger a massive rally?Bitcoin has neutralized the previously oversold levels on its 1D technical outlook (RSI = 35.383, MACD = -1887.100, ADX = 31.814) as it is making a strong technical rebound on the 1W MA50. Today's analysis features the Global M2 supply, which is a leading indicator for Bitcoin. Both in July 2024 and November 2022 (the last two major bottoms for the market) when the M2 started to rise aggressively, Bitcoin declined and consolidated. It followed the bullish trend of the M2 with a rise of its own much later. This is similar to what the market has been experiencing since January 2025, when the M2 started rising but Bitcoin peaked on its ATH and started a decline that continues to this very date. If the pattern gets repeated then by end of April - start of May we are in for a strong Bitcoin recovery (if not earlier).
## If you like our free content follow our profile to get more daily ideas. ##
## Comments and likes are greatly appreciated. ##

You Won't Believe Who Saved Bitcoin: GMEThis last week was interesting to say the least but the most interesting thing to watch was the incredibly influx of volume into INDEX:BTCUSD
As the week progressed into Thursday and Friday and equity markets sold off big the volume of trading in Bitcoin more than doubled... yet the price remained stagnant.
A month ago I did a study of correlation and relative movements between stocks and Bitcoin to answer the question: "What would happen to Bitcoin if Stocks Crash?" The TL;DR was that 75% of all weeks exhibited a positive correlation with nearly 50% a "high" correlation. Also, when equities have sold off big over the past decade Bitcoin had sold off at least two times or more.
Correlations are not an absolute and can change but this week something unique was clearly going on. If the standard correlation had been allowed to play out on Thursday INDEX:BTCUSD would have fallen more than -8% and Friday more than -11%. It would have triggered mass liquidations. But that did not happen.
This was a critically important Support for Bitcoin to hold and someone knew it... enter Ryan Cohen.
Michael Saylor with NASDAQ:MSTR is definitely NOT the one deploying cash to prop up Bitcoin.
His buys have been entirely NOT-Strategy-ic and has mostly bought highs. He has made a virtue out of being a really bad "trader" uncaring about price and timing. That plan has not worked to push Bitcoin to new a new All Time High nor saved it from the bear trend in 2025.
Cohen, however, is a renowned trader/investor that should know market structure and would have the sense to deploy cash at the perfect time. Just this week two things happened: Cohen took out a loan backed by his NYSE:GME shares and GameStop completed a convertible note offering, like Microstrategy has done, to raise 1.4 Billion in cash to buy Bitcoin. That gave him lots of cash at the critical point at the end of the week.
So do they get to win? Very possible. It depends on equities. If stocks rise in the coming week then the Bitcoin correlation may resume and INDEX:BTCUSD be lifted. If the U.S. economy enters a recession, the stock market route deepens, or if they used all of their available cash to exhaustion then the plan could fail and Bitcoin will fall in sync.

Bitcoin at MAJOR SUPPORT! Intraday Update: Bitcoin has hit major support at the 74000 level (today's lows at 74420) which should allow for a move back above the 80K level. A move below 74K level could put the 68848 level in view,

Will BITCOIN prove to be resilient amidst this market crash??Bitcoin (BTCUSD) just hit its 1W MA50 (red trend-line) for the first time since September 06 2024, while completing the first 1D Death Cross since August 09 2024. This is a critical double combo development as last time those conditions emerged it was a bullish signal.
Despite the theoretically bearish nature of the Death Cross, the last one on 1D was formed just four days after the market's previous major long-term bottom of August 05 2024. That bottom was exactly on the level that the market hit today, the 1W MA50.
The 1W RSI sequences among the 2 fractals are identical and if it wasn't for the abysmal negative market fundamentals regarding the back-and-forth tariffs, that would be an automatic long-term buy entry, the 3rd on of this Bull Cycle.
The only condition we can technically rely on right now, amidst the stock market crash, is for the weekly candle to close above the 1W MA50, as it did on August 05 2024. In that case and of course if and only if the trade war gets under control (and/ or the Fed makes an urgent rate cut), we can expect a new long-term Bullish Leg to begin towards $150k and above.
Failure to address those concerns and a 1W candle close below the 1W MA50, can result into a stronger sell-off towards $50000 and the next long-term technical Support level of the August 05 2024 Low (49150). That would also be a major Support cluster as the 1W MA200 (gray trend-line) is just below that level (and holding since October 16 2023) and by the time of the drop, the market may test that as well.
So what do you think? Will BTC turn out to be resilient amidst this market crash or will it follow suit and decline towards $50k? Feel free to let us know in the comments section below!
-------------------------------------------------------------------------------
** Please LIKE 👍, FOLLOW ✅, SHARE 🙌 and COMMENT ✍ if you enjoy this idea! Also share your ideas and charts in the comments section below! This is best way to keep it relevant, support us, keep the content here free and allow the idea to reach as many people as possible. **
-------------------------------------------------------------------------------
💸💸💸💸💸💸
👇 👇 👇 👇 👇 👇

LTCUSD Litecoin OH NO TARIFFS! Everyone SELL NOW!The market reacted to the tariffs negatively as expected. I don't think these tariffs will last long. Countries will cave and remove their tariffs. Bottom line is they need us more than we need them. Once global free and easier trade starts you're going to see a boom cycle like never before. This is the bottom and the beginning of the biggest bull run you'll ever see. I don't get involved in politics but this move that Trump made with the tariffs is going to be a major positive for the USA and the world moving forward. This isnt 1929, we live in a much more advanced world now. Collapses and depressions are a thing of the past in my opinion.
As for Litecoin I see it coming down to test around $70 dollars by the middle of April. This is also timed almost perfectly to the 2017 run Litecoin had, coincidentally trump was starting his first term in 2017 as well. Also timed perfectly to when tax day is over for USA.
Many have capitulated and sold everything thinking a giant recession is coming, or a war, or a collapse, or aliens, or you name it people are scared of their own shadows lately. Like a plague of Grackles where one gets spooked and the whole lot of them get scared and take off when they dont even know why. This is how the markets work though, most will make the wrong decision so the few who made the right decision can profit from their mistakes. Once the market starts to run again those who sold will think its just a fake pump or dead cat bounce and wont buy in. Then the market will continue to rise and rise and finally when its near an all time high those who capitulated and sold early will fomo back in and buy the top to provide liquidity for those who were called crazy for buying the bottom. Its a cycle thats been happening since markets started.
So Im sticking with my predictions for Litecoin, I am not falling for this bear trap crap. Im doubling down. This is not financial advice. This is just my opinion.
Bitcoin: 76K Test Watch For Reversal.Bitcoin has broken the 81,500 minor support and is now in the process of testing the recent swing low 78K to 76K AREA. With the lower high structure at the 88K area (see arrow) in place, a lower low is likely to follow in the coming week. The question is how much lower? One reasonable estimate is a test of 73K (the previous all time high before November). The current area between 79 and 76K does present a buying opportunity on multiple time horizons (investment, swing trades, day trades) but the key to timing this WAITING for confirmation.
From the investing perspective, this is an attractive low because this may establish a reversal formation (double bottom) which may be the bottom of Wave 4. IF this turns out to be true, Wave 5 can potentially begin here. Price can probe as far as 64K before overlapping with Wave 1 of this impulse. Stepping into this our placing a limit order at a lower price is reasonable, but managing risk on this time horizon has a lot to do with your sizing strategy (I have explained this on many streams). Keep in mind price can BREAK and test 73K or lower and you must consider that possibility into your sizing strategy.
As far as swing trades, its the same idea except this is where a defined risk (stop) and profit objective has to be assigned (Trade Scanner Pro shines here). While the level is ideal for a double bottom or failed low (see illustration), there is NO confirmation. So it is still highly risky to step into this, especially in light of the stock market situation, etc. Wait for a bullish pin bar, engulfing candle, etc. You can define risk from there and utilize at least a 2:1 or greater profit objective.
For day trades, its the same process just on smaller time frames, (1 min to 15 min). Just on the day trade time frame, at this time, SHORTS can still be attractive on minor retracements because momentum on these time frames is CLEARLY bearish. If 79K breaks, there is a greater chance momentum continues toward the 76K AREA low.
I realize there must be some news catalyst in play to spark such a move. DO NOT react to the news, this is often a mistake. It doesn't matter what it is because this is a game of recognizing herd mentality behavior and identifying potential opportunities in this context. You want to anticipate an inflection point, WAIT for price behavior to confirm. At that point you can identify risk, and profit expectations. THIS is a MORE objective process compared to "thinking" you know how the news will affect a market. Keep decision making as simple as the "IF this, then that" framework which gives you a more accurate view of market intent since it encourages a more passive view rather than asserting your own irrelevant opinions.
Thank you for considering my analysis and perspective.

BITCOIN - Price Could Be Heading Towards 60K...After multiple rejections at higher price levels, the most recent major rejection—followed by a break of the lows—suggests that the corrective move we've seen since the end of February may have concluded.
In this video, I outline the key reasons why a larger upside move no longer appears likely.
With the potential end of the corrective wave combinations now in sight, I'm shifting to a bearish outlook, targeting a potential move down to $61K. To validate this view, we need to see a break below $81,222, confirming the start of a deeper breakdown.
As it stands, I can no longer support a short-term bullish scenario unless we see a strong break above $84,715. However, given the recent sharp move to the downside, this seems unlikely and may, in fact, mark the beginning of a larger downward trend.


Bitcoin volume exploding todayBitcoin volume is exploding today. The Maxi's are trying to close it green on the day to advertise it as a "Safe Haven Asset." We are watching an All-In to keep it above 79k Support.
Will they win?

BTCUSDT BuyBitcoin is ready to start uptrend and retest 93k level. Stop area is 77k. Consolidation between 82 - 93 levels is still active.

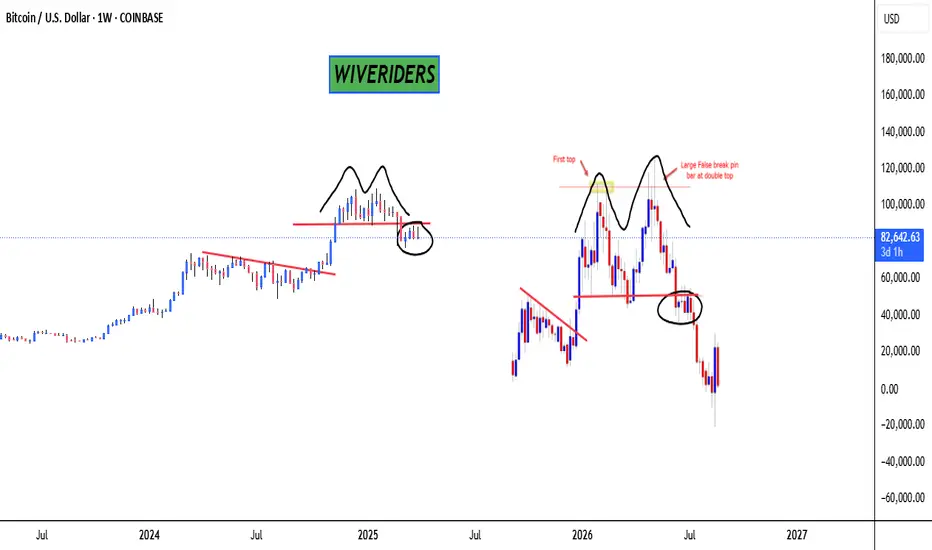
BTC Weekly Chart Update📉 CRYPTOCAP:BTC Weekly Chart Update
It looks like a double top pattern is clearly forming on the BTC weekly chart — and honestly, doesn't it remind you of a similar structure we’ve seen before? 👀
Patterns like these often signal potential trend reversals, so this is definitely a chart to watch closely.
Do you see the similarity with the previous one? Let me know your thoughts in the comments 👇
🔴 Bearish scenario could continue unless we break above key resistance.
BITCOIN Do you really want to miss this rally???Bitcoin / BTCUSD remains supported by the 1week MA50 just like it has been through the whole 2020/21 period after the COVID crash.
In spite of the massive bearish pressure of the polical developments (tariffs), the fact that the market is holding the 1week MA50, means that it is respective Bitcoin's Cycles.
In fact this is like the May-June 2021 accumulation on the 1week MA50, following the first Bitcoin Top of April 2021.
Similarly, we've had a peak formation in December 2024- January 2025 and the market corrected.
In addition to that, the 1week RSI is testing the 42.00, which isn't just where the August 2024 and September 2023 bottoms were priced, but more importantly the June 2021 one.
The symmetry between the last two Cycles is uncanny, both trading inside the long term Channel Up, with identical Bear Cycle and (so far) Bull Cycle ranges.
If all ends up repeating themselves, expect a value of at least $160000 by September.
Follow us, like the idea and leave a comment below!!

Bitcoin BTCUSD The Move Down Is OverI posted this chart in February 2027, I was unable to update it. This is playing out exactly how I predicted. Bitcoin loves these double tops and the corrections are textbook almost every time. Bitcoin may double bottom but on a closing basis on the 5 day I am predicting that Bitcoin will NOT close lower than the measured move. Wicks below sure but on a cloing basis which the Line chart shows we are right on track. I think that by the middle to late April we are above the previous high and en route to new all time highs. There is no bear market coming any time soon. Bitcoin is going to astronomical numbers, numbers most cant fathom. None of this is financial advice this is just my opinion. Like and follow for updates. Thank you
