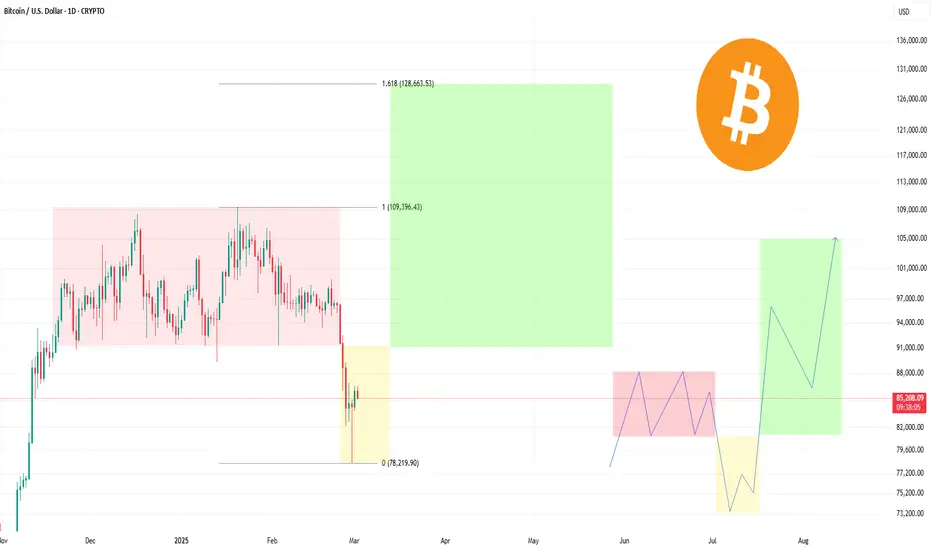
PO3 and Fibonacci: The Path to $128,000I've always been an advocate of analyzing data deeply and finding patterns where others see chaos. And today I want to share my perspective on one of the most exciting opportunities that are taking shape right now.
PO3 is not just an indicator, but a real key to understanding how the market shapes its moves. When you combine it with Fibonacci levels, a unique picture opens up in front of you that gives you a glimpse into the future. This is exactly the case when the data speaks for itself. Now, analyzing the current dynamics, I come to the conclusion that we can expect a significant rise in price to the level of 128,000 dollars. PO3 shows a clear direction and Fibonacci levels confirm the potential for such a move.
So, my prediction: $128,000 is not the limit of dreams, but a realistic goal that we can achieve. And those who understand this trend have a unique advantage.
Alex Kostenich,
Horban Brothers.
Bitcoin-btcusd
Bitcoin - Just Objectively Look At The Chart.Bitcoin ( CRYPTO:BTCUSD ) remains very bullish lately:
Click chart above to see the detailed analysis👆🏻
Many traders are actually calling the top on Bitcoin but if we objectively look at the chart, situation is entirely different. First, Bitcoin just broke above the previous cycle high with a massive candle and second, we still have a valid rising channel acting as a major support.
Levels to watch: $70.000, $300.000
Keep your long term vision,
Philip (BasicTrading)

Bitcoin, Mind The Gap (85,720) The massive move initiated from Trumps tweet Sunday about the Crypto Strategic Reserve has left a massive gap on the Bitcoin Futures Chart. Gaps tend to get fill sooner rather than later, with a high 90% hit rate on gaps getting filled.
We could see a pullback this week to fill the gap with another run up following back above 90k to save the weekly close ... again.
We see confluence with the golden pocket (0.6128 - 0.65 Fib) here on that retracement and also the most amount of volume (VPVR) being traded there.
A final test of the demand below 90k, which if shown as support, will lead us back into the range of 90k to 110k.

BITCOIN (BTCUSD): Time For Correction
Bitcoin looks bearish after a bullish rally on the weekend.
The price reached a significant daily resistance and now is going to retrace.
Goals: 90000 / 88000
❤️Please, support my work with like, thank you!❤️

BTC.D Elliott WaveBitcoin Dominance Chart.
We have entered Altseason. First, altcoins will slowly recover. Then some coins will show surprise pumps.

Major Levels & Breakout Zones!🚀 Bitcoin's Q1 2025 Cycle is Here – Major Levels & Breakout Zones! 💎🔥
The delayed cycle I spoke about in early February is now kicking in hard, and Bitcoin is on the move! 📊 The market followed the chart before the news—a perfect example of why we trade based on technical setups first!
📉 Key Support Levels
✔ Checked support: $79,717 – Held strong, confirming the bounce.
✔ Short-term support: $91,000 - $91,353
✔ Potential retracement level: $91,206
🚀 Where to Next?
💡 Major Resistance & S/R Cluster: $111,000 - $113,000
📍 If we clear this zone, Bitcoin could head toward $120,000+ in a strong breakout!
📍 Expect consolidation or rejection at this level before further price expansion.
🔥 News Driving the Market
JUST IN: $330 Billion was added to the crypto market in the last 4 hours! 📈
💥 Trump’s Crypto Strategic Reserve Announcement is fueling the bullish momentum, reinforcing Bitcoin's long-term narrative!
This setup is textbook delayed cycle price action, playing out exactly as expected. Keep an eye on these levels and trade smart!
One Love,
The FXPROFESSOR 💙

Did Bitcoin Just Trick the Bears? RSI Says Yes!Bitcoin's recent price action suggests a potential bear trap, as the price sharply dipped below a key support zone before rebounding. The sudden breakdown may have triggered panic selling, but the rapid recovery and bullish divergence on RSI indicate that this could have been a false breakdown designed to shake out weak hands before a stronger upward move.
The price is now reclaiming levels above the previous demand zone, signaling a possible reversal. If Bitcoin sustains momentum and reclaims the $90,000 region, it could invalidate the bearish breakdown and push toward new highs.

Bitcoin key levels to watchBitcoin's sharp drop has been driven by a combination of factors all coming into play at the same time. These include profit-taking after Bitcoin surged to above +$100K mark in short order, the absence of more regulatory support, tariffs and the broad tech-sector weakness, among other factors.
But it is now approaching some key support levels where dip buyers might step in.
First up is $80K, which is a key level, and should the crypto be able to hold its ground here, we could see a rebound towards $90K in the coming days. i know it has broken below this level intraday, but let's see how it will close the session.
However, a decisive break below $80K would bring into focus the long-term support area between the March 2024 high of $73,835 to November 2021 high of $69,000. This area is where I would expect to see at least a sizeable bounce if we get there.
By Fawad Razaqzada, market analyst with FOREX.com

Bitcoin on 2h chart Hello, dear friends! Welcome to my page🫶
Today, let's take a look at the Bitcoin chart on the 2-hour timeframe. There is a fascinating pattern emerging that I'd like to discuss. 🧐
I've drawn long-term support and resistance lines that have been forming since February and March of this year. Today, Bitcoin is attempting to break through a descending trendline. For many, this might seem like a bullish signal, but let's not jump to conclusions just yet. On the 2-hour chart, we can see that the price continues to form a rising wedge, which is typically considered a bearish signal, often resulting in a downward breakout.
At this moment, I see the possibility of the price rising into the blue zone, followed by a sharp decline. To provide a clearer picture, I'll also include a more long-term chart so you can better understand my analysis.
What are Your thoughts? How are You feeling about the market? Where do You think the price will go next? Share Your insights in the comments, I'm looking forward to hearing from You.
Thanks for Your attention💋
Always Yours, Kateryna💙💛

Bitcoin's Symmetrical Triangle Hi friends, whenever I have a moment of free time, I immediately come to share my thoughts on Bitcoin's price movement with You🩷
Since February 24th, Bitcoin has been forming a technical pattern known as a symmetrical triangle, often seen as a sign of market indecision. This pattern is characterized by the price oscillating between converging support and resistance lines, indicating a balance of buying and selling pressures.
Currently, Bitcoin's price is fluctuating within this triangle, gravitating towards the upper resistance line. As the apex of the triangle approaches, the market's uncertainty could culminate in a decisive move. Given the historical behavior of similar patterns, it is plausible that we may witness a sharp price decline soon, potentially reaching levels as low as $60,000 to $58,000.
This anticipated move aligns with the technical analysis principles, where symmetrical triangles often precede significant price breakouts or breakdowns. Traders should monitor these key support and resistance levels closely and consider the broader market context and potential external factors that could influence Bitcoin's price action.
What do You think? What can we expect after the formation of this triangle? It's certain that there will be a strong movement, but will it go up or down?
Thanks for Your attention 🫶
Truly Yours, Kateryna💋

$BTC sideways for now, long-term uptrend intactI’m waiting for CRYPTOCAP:BTC to tap 102k again, or for the yearly open at 93k. Not much happening at the moment, but I see it moving higher.
Most likely, we’ll trade within January’s candle and form an inside bar. The inflection point will be at the extremes of that candle for short-term trades. If it decides to break January’s low, I’d see that as a potential re-entry point.
So, in short:
Continuation above 102k
First possible entry at the yearly open (I think many are watching that area)
Second entry at January’s low (optimal for me)
For now, it’s just consolidation.

Bitcoin Update: Critical Support & Elliott Wave Levels To WatchBitcoin here is the thing...
1. For now drop is not impulsive, so can be correction
2. 4th wave pullbacks will ideally stabilize near 50/38.2%. Just testing the important zone 77k-85k
3. Old high and unfilled gap are crucial to cause a bounce, otherwise the major high is in
4. You don't want to see this fourth wave breaking the lowest base channel line, otherwise top is in.
5. Bullish resumption for wave 5 when/if 93700 overlaps
6. This market wont go up unless risk-on is back
GH

What Would Happen to Bitcoin if Stocks Crash?I have read different speculations on what might happen to the price of Bitcoin if the stock market were to crash. I am going to answer this using statistics, correlations, and examples of events from market history. This post will not speculate on the current nor future price movements of Bitcoin and Stocks; only their connection. I will be using the Tradingview Bitcoin Index INDEX:BTCUSD and the S&P500 Index ETF AMEX:SPY
What is a "Crash?"
I use a common definition of a stock market "crash" as a short or long duration decline of -30% or more. I distinguish this from "correction" which I define as a -5% to -10% movement. I'll look at the true crashes but also include significant corrections for comparison.
Time Range
I chose the time range from 2014 to present for this study. Bitcoin did not reach a comparable level of maturity nor public awareness until after the 2013 bull cycle. Also the 2013 Stock Market was ridiculously bullish.
How Often Do Bad Weeks Line Up?
I took particularly down weeks for Stocks, -2.5% or more, and compared them to the same week for Bitcoin. 2 out of 3 Weeks where the stock market was down big... Bitcoin was down big. Furthermore, the average magnitude of Bitcoin's down move was more than twice that of Stocks.
How Correlated is Bitcoin to Stocks?
The Correlation Coefficient measure the way in which two instruments move together. A value 1.0 means that they move identically up and down while a value of -1.0 means they move exactly opposite. The correlation of Bitcoin to Stocks varies from week to week. However, Bitcoin is far more often and to a greater degree positively correlated to Stocks.
At the extreme Bitcoin is more highly correlated to Stocks than it is ever negatively correlated (0.93 versus -0.76)
Bitcoin is move often positively correlated to stocks. 75% of weeks Bitcoin and Stocks are positively correlated
0.70 is considered "high correlation" and 33% of weeks exhibit high correlation
On the contrary, less than 2% of weeks are ever highly negatively correlated
Historical Crashes
Now we will go into some narratives around historic events surrounding large down moves in Stocks and how Bitcoin reacted.
2021
2021 was a bad year for both Stocks and Bitcoin. The decline of Bitcoin began prior to the then All Time High of Stocks but both decidedly went through a bear market together. Of note; while Stocks declined -27.47% from the high to low over that same period Bitcoin declined -61.83%.
COVID
COVID was a major but short "risk-off" event in both markets. Stocks declined -35.45% from prior high to subsequent low and Bitcoin declined -63.09% from its respective high and low.
2018
Going back further in time we can look a less severe Stocks declines in 2018. The 2018 market narrative was dominated by rate decisions with the Fed raising rates 4 times that year. The initial correction at the beginning of the year happened within Bitcoin's decline from its 2017 All Time High. Within this context while Stocks gave up -11.76% Bitcoin fell by more than half.
Later in the year as Bitcoin began to trade in a very tight range Stocks had a -20.47% decline. While the two did not coincide in their start times it is within the context of the longer Stocks crash that Bitcoin broke lower for another -53.62%
Conclusion and Analysis
I want to note here that Bitcoin was created AFTER "the big one" of 2008. There has never in Bitcoin's history been a true multi-year bear market for Stocks to compare. However, we have ample evidence to suggest that given a crash in Stocks it is a near certainty that Bitcoin will decline as well to a magnitude of double or more.
This happens because the market as a whole views Bitcoin as a risk asset with much higher volatility than Stocks as a whole. When there is ample liquidity and positive sentiment they both perform well. When liquidity is constrained and there is negative sentiment they both perform poorly. Liquidity and speculation are what drive them both. This connection has not changed in recent times and has likely increased due to the introduction of the Bitcoin ETF and publicly traded companies exposing their share prices to the volatility of Bitcoin.
Trade wisely.

#BITCOIN #BTC 4HAccording to the chart and Elliott wave counting, wave 4 of 5 is likely to have formed as a flat, and according to Fibonacci, we are probably at the end of this correction and we can expect to move towards a new high from this point.

86K is holdingBitcoin (BTC) is currently trading at $87,180, hovering near a key support level at $86,050.99. The price recently broke down from a rising wedge pattern, a bearish setup that often hints at further declines. That said, if buyers defend the $86,050.99 support, we could see a bounce toward the 50-hour moving average (MA) around $88,519, with a potential stretch to the next resistance at $96,177.18. On the flip side, a break below $86,050.99 with solid volume might send BTC tumbling toward $84,000. These levels are your guideposts... support acts like a floor, while resistance is the ceiling where price often reacts.
Technical indicators are tilting bearish but leave room for a shift. The RSI sits at 39.17, below the neutral 50 mark, showing momentum is soft. The MACD has a bearish crossover in play, pointing to downside pressure. However, BTC is playing with the 50-hour MA, and a strong move above it could turn things bullish. Volume’s holding steady, watch for a spike to confirm any breakout or breakdown. A rebound with rising volume and an RSI above 50 could signal strength, while heavier selling volume would lock in the bearish vibe.
Market sentiment feels cautious, with BTC stuck in a consolidation range between $86,000 and $96,000 lately. External factors like ETF approvals or regulatory news could jolt the market either way, good news might fuel a rally, bad news could deepen the dip. Set alerts at $86,050.99 and $96,177.18 to stay on top of it, and keep an eye on volume for confirmation. Volatility’s up, so protect your trades: use stop-losses below $86,050.99 if you’re long, or above $96,177.18 if you’re short. Wait for the market to tip its hand before jumping in.

What's next for Bitcoin? Chop into end of March, then 165kI believe we are in the last leg of the cycle here.
I expect another sideways chop to form a bull flag pattern into end of march, then a 3 wave move up to tap 164-165k before entering a 12month + bear market.
Fear is at an all time high, alt coin traders are completely obliterated (I have been through it too, a lot of my previous attempts to call bottoms on some coins were invalidated due to a weaking broader market), however, I believe many alts now have put in bottoming structures such as POPCAT, FARTCOIN, MOG etc.

Bitcoin Q1 2025- Up for a Delayed Cycle?🚀 2025 kicks off with Bitcoin’s big picture in focus. This is Part 6 of our "Where Can Bitcoin Go?" series, where we explore long-term Bitcoin price dynamics and key levels to watch.
🔍 Key Levels to Watch:
1️⃣ $94,629 – Current support within the 30-minute channel.
2️⃣ $102,150 & $111,192 – Resistance levels likely to be tested again soon.
3️⃣ $79,717 – The level Bitcoin hasn’t tested as support yet. A massive buy opportunity if it gets there! (...If!)
4️⃣ 160k to 192k – Yearly target for 2025, with a 30% chance of reaching higher toward $313,000.
🧐 Big Picture Analysis:
The current bull market doesn’t feel like one, due to macroeconomic factors: inflation concerns, Fed rate policies, and a maturing crypto market. Will revert in detail in due time.
This could mark the end of traditional Bitcoin cycles as we know them, with less seasonality and new norms emerging.
Despite the noise, Bitcoin remains bullish long-term.
📈 What’s Next?
Bitcoin has tested structural resistance twice. A third test is expected in February or March 2025.
A breakout above $111,192 would signal a new all-time high.
If Bitcoin drops to $79,717, prepare to go long like there’s no tomorrow!
💡 “Cycles are evolving as the market matures. More investors understand Bitcoin's seasonality, halving, and structure. This could be the most interesting and volatile year yet.”
🌟 Let’s stay patient, trade smart, and watch these levels closely. Step by step, we’ll navigate this exciting market together. Here’s to a beautiful year ahead!
One Love,
The FXPROFESSOR 💙
Video:

BTCUSD Buy Limit OrderHey guys...
I've expected bitcoin to fall, and now I think its the time and I think this area is the area that it would have a stop for a pull back and I'm gonna set an order.
I'll update the TPs later.
Dear traders, please support my ideas with your likes and comments to motivate me to publish more signals and analysis for you.
Best Regards
Navid Nazarian

Bitcoin INTRADAY below psychologically important 91900 level The Bitcoin (BTC) price action sentiment appears bullish, supported by the longer-term prevailing uptrend. However, since the spike to an all-time high of 109,000 on 20th January 2025, the BTC price action is starting to display some signs of bearish behaviour by potentially forming a double-top reversal pattern.
The key trading level is at the “Neckline” 91,900 level, which is the current swing low. A corrective pullback from the current levels and a bullish bounce back from the 91900 level could target the upside resistance at 100,650 (20-day moving average) followed by the 105,590 and 109,460 levels over the longer timeframe.
Alternatively, a confirmed loss of the “neckline” 91,900 support and a daily close below that level would negate the bullish outlook opening the way for a further retracement and a retest of 85,275 support level followed by 79917 and 75060 (200-day moving average).
This communication is for informational purposes only and should not be viewed as any form of recommendation as to a particular course of action or as investment advice. It is not intended as an offer or solicitation for the purchase or sale of any financial instrument or as an official confirmation of any transaction. Opinions, estimates and assumptions expressed herein are made as of the date of this communication and are subject to change without notice. This communication has been prepared based upon information, including market prices, data and other information, believed to be reliable; however, Trade Nation does not warrant its completeness or accuracy. All market prices and market data contained in or attached to this communication are indicative and subject to change without notice.

Ichimoku: Bitcoin Bull Trend EndsFor years I have been publishing on Tradingview the Ichimoku Cloud trend analysis for Bitcoin. It is now time to update the analysis as a major event has occurred recently.
Most analysts and students of Bitcoin price cycles agree that the bull trend is likely to end in 2025. Well, it is that year now. Optimists seem to have thought that it would be later in the year and slightly higher. I don't think that is going to be. Despite rumors of government Bitcoin bailouts (aka Strategic Bitcoin Reserve) each proposal has been struck down in state Congresses. I do not think it was a serious plan to begin with; just election hype.
Back to what matters; the Technical Analysis. First, we will list the rules for Ichimoku Cloud Breakouts as I use them:
Bullish Trend Begins
Price is above the cloud
Lagging Span (or Chikou in Japanese) is above the cloud
Bearish Trend Begins
Price is below the cloud
Lagging Span is below the cloud
When price is inside the cloud it is considered neutral. Only when the reverse of these conditions happen can we say that the trend has reversed. That means if we do not have both conditions the prior trend remains active.
An example of when the original bullish trend of the current price cycle began was on January 12, 2023:
Bitcoin has had many bearish cycles ranging from losing -78% to -90%. The true strength of this strategy is keeping investors out during Bitcoin's bearish cycles. The last example began December 4, 2021.
With any trading strategy one should validate the results so I encourage everyone to do the work and test these signals. I have done this over the years to save readers' time. Here are the results if we began on the signal that occured April 13, 2011:
When compared to buying 1 Bitcoin and "HODL" or never selling an investor would have more than 5 times the value and Bitcoin at the end of 14 years.
Like any strategy this one has weaknesses. Because it is a trend following strategy it will have many incorrect signals during periods of time when price has very little movement. However, over the long run avoiding the long periods of large drawdowns will make the strategy outperform.
My long term plan will be based on the past Bitcoin bearish cycles which have been between -75% and -94%. Somewhere starting at 25,000 I will begin looking to get bullish again as the cycle will continue. I remain heavily short NASDAQ:MSTR via Puts for that scheme to collapse entirely over the next 2 years.
Thank you for reading and trade wisely!

BITCOIN Is this a healthy Bull Cycle pullback or new BEAR CYCLE?Bitcoin (BTCUSD) has broken below the $90k barrier, reaching so far today 89000. The market is undeniably bleeding and this is roughly a -19% price decrease from January's All Time High (ATH). Talks about the end of this Bull Cycle have resurfaced again, but is this the start of a new Bear Cycle or simply a usual technical pull-back during a Bull Cycle?
Well we can find the answer by examining the 3 most recent Bull Cycles. As you can see, such declines are common during Bull Cycles, and they've been very well present on the current (2023 - 2025) Bull Cycle as well.
Going back to the 2015 - 2017 Bull Cycle, we can see four -40% corrections, with an average Cycle decline of -35.28%. The average in the following Bull Cycle (2019 - 2021) declined to -26.12% with many -30% corrections this time. On the current Cycle, the average is so far -23.60% with the vast majority of corrections being around -20%, which is exactly what we are up against at the moment.
As you realize, the corrections have been greater in the past, which is natural as so were the total Cycle gains, so the higher the rallies, the stronger the corrections have been. As Bitcoin started to normalize, become mainstream and adopted, the Cycles returns started to diminish, offering subsequently smaller/ more manageable pull-back phases.
As a result, it is very likely for BTC to be experiencing at the moment a typical Bull Cycle pull-back and equally probable not to diverge much from the -20% mark of the current Cycle standard.
But what do you think? Is this the start of a new Bear Cycle or just a Bull Cycle pull-back? And if it's the latter, will it stop around the current -20% levels? Feel free to let us know in the comments section below!
-------------------------------------------------------------------------------
** Please LIKE 👍, FOLLOW ✅, SHARE 🙌 and COMMENT ✍ if you enjoy this idea! Also share your ideas and charts in the comments section below! This is best way to keep it relevant, support us, keep the content here free and allow the idea to reach as many people as possible. **
-------------------------------------------------------------------------------
💸💸💸💸💸💸
👇 👇 👇 👇 👇 👇

BITCOIN Drops Below Major Support - Is $93,000 the Next Target?COINBASE:BTCUSD has decisively broken below a key support level, signaling a potential shift in momentum. The recent price action shows a rejection at this broken support, now acting as resistance, indicating that sellers are regaining control. This rejection reinforces the bearish outlook, as failed attempts to reclaim the level suggest continued downside pressure.
If bearish momentum persists, BTC could extend its decline toward the $93,000 support zone, a key level where buyers may attempt to step in. However, a sustained move back above the resistance zone would invalidate the bearish setup, signaling a potential shift in momentum. In this scenario, buyers could regain strength, possibly driving the price higher and negating the bearish bias.
Traders should remain cautious and monitor price action around these key levels to confirm directional bias before committing to a position. Risk management remains essential, given the volatility of BTC/USD.

Bitcoin on 20weekly MAWhat ever bitcoin is doing this week should close weekly candle above 20MA which is about $92000 to stay on bull market
