BTCUSD: Falling Wedge close to breaking to $105.5kBitcoin is marginally bearish on its 1D technical outlook (RSI = 44.917, MACD = -782.200, ADX = 41.331) but neutral on both 1H and 4H, as it is close to conclude a Falling Wedge. Today the price held the 1H MA50 for the first time after a test of the pattern's top, which increases the chances of a bullish break out. Buy only if the break out happens and target the 2.0 Fibonacci extension (TP = 105,500), which happens to be just under the R1 level.
## If you like our free content follow our profile to get more daily ideas. ##
## Comments and likes are greatly appreciated. ##
Bitcoin-btcusd

Bitcoin is mimicking gold: Fractals are bullish!Bitcoin is following gold in its pattern formation. Fractal analysis of gold and Bitcoin reveals similarities in both charts. While gold is slightly ahead of Bitcoin, the same pattern is emerging on Bitcoin’s chart. If Bitcoin follows gold’s performance, it is likely to break out of this widening wedge pattern and reach new all-time highs, aligning with my previous analysis.

BITCOIN This is what happened on the last 1D MA100 double test.Bitcoin (BTCUSD) hit yesterday its 1D MA100 (green trend-line) for the second time in 6 days and is reacting on a bullish note early today following basically 4 straight flat 1D candles.
We mentioned the importance of the 1D MA100 as a Bull Cycle demand level on previous analyses. What we didn't discuss though is how BTC behaved the last time we had a 1D MA100 double test on such short time-frame.
As you can see, the last time Bitcoin had a 1D MA100 Double Test within a 1-week time-frame was on October 10 2024 and the one before that on May 08 2024. The common characteristics of both those fractals was that the 1D RSI held the 43.00 level (just like it's doing today) and the price rebounded to hit the respective Resistance Zone from the previous High. Channel Up patterns emerged on both occasions, the difference is that in May 2024 BTC got rejected on the Resistance Zone, while on October 2024 it broke to the upside aggressively following the U.S. elections.
As a result, we can target at least $108k on the short-term. Since long-term Accumulation Phases like March - October 2024 only take place two times at most during each Cycle (and we've already had this twice already), we give more probabilities to an extended rally like November - December to a new All Time High. Long-term traders may seek to sell these positions when the 1D RSI approaches the 85.00 profit taking level (overbought).
But what do you think? Is BTC starting a rally to at least $108000? Feel free to let us know in the comments section below!
-------------------------------------------------------------------------------
** Please LIKE 👍, FOLLOW ✅, SHARE 🙌 and COMMENT ✍ if you enjoy this idea! Also share your ideas and charts in the comments section below! This is best way to keep it relevant, support us, keep the content here free and allow the idea to reach as many people as possible. **
-------------------------------------------------------------------------------
💸💸💸💸💸💸
👇 👇 👇 👇 👇 👇

Bitcoin Short - Let's ManiuplateI'm overall bullish, however kinda betting on some f*ckery before we potentially move further up.

Why Bull Market Is Not Over For Bitcoin BTC?Hello, Skyrexians!
Recently we have see the drop on BINANCE:BTCUSDT to $91k. We can't understand why it caused so much fear and negative in crypto communities. This is still next to ATH but fear and greed index dropped into the fear territory. This is great sign for bull run continuation and now we will explain you this statement with the technical analysis.
Let's take a look at the weekly time frame. Before December we had a great probability
that anticipated growth from $50k to $100k could be the final wave 5 of the bear market, but price action has broken the potential Awesome Oscillator's bearish divergence. It gives us the confidence that this move was just the wave 1 in wave 3. It means that the most impulsive growth ahead. The minimal target is 1.61 Fibonacci at $140k, maximal at $200k. We believe more in $200k, but watch out our updates because targets can be recalculated.
Best regards,
Skyrexio Team
___________________________________________________________
Please, boost this article and subscribe our page if you like analysis!

Alt SZN about to start bruvs...Say no more. Position yourselves properly in the market and hold tight to it till October-November 2025

$BTC x $GOLDCRYPTOCAP:BTC , the largest store of value after TVC:GOLD and NASDAQ:XAG , historically follows TVC:GOLD movements!
2025 looks set to be epic for #Bitcoin

BTCUSD: Is it about to explode while the Dollar tanks?Bitcoin remains bullish on its 1W technical outlook (RSI = 62.733, MACD = 8478.500, ADX = 61.463) but neutral on 1D, which suggests that it is a buy opportunity long term. What can really help the price explode from this point onwards though, is a strong drop on the DXY, which has already shown signs of peaking. Based on the last 2 Cycles, it is out of the Accumulation Phase and is has completed the fake-out, which traps investors into thinking that higher prices are coming. This is where a bearish reversal has taken place in the past, lasting 399 days until its bottom, which is where BTC tops. Get ready for a full 2025 Bitcoin rally.
## If you like our free content follow our profile to get more daily ideas. ##
## Comments and likes are greatly appreciated. ##

Sell Bitcoin and Altcoins during 2025 and don't look back!Hello Everyone,
This is my first public post since the last one, which I published on Sep 28, 2022, and you can see that here:
My cycle analysis (TA) proved spot-on the last time I accurately predicted Bitcoin’s behavior. To avoid overcomplicating things, I’ll keep this brief.
As the yearly chart indicates, we’ve seen a consistent pattern: a three-year bull market followed by a one-year bear market. History appears poised to repeat itself, and we’re now entering the final phase of the current bullish cycle. This year will likely be your last opportunity to exit the crypto market strategically, as historical fractals suggest a bearish downturn is due next year.

Trading opportunity for BTCUSDTBased on technical factors there is a Buy position in :
📊 BTCUSDT
🔵 Buy Now
🪫Stop loss 95300.00
🔋Target 105000.00
📏 R/R 2
💸RISK : 1%
We hope it is profitable for you ❤️
Please support our activity with your likes👍 and comments📝

Bitcoin Q1 2025 - Delayed Cycle (Part 2) Chart🚀🔥 Bitcoin’s Next Big Move: Delayed Cycle or Just Another Test? 📈⚡
The market has been consolidating, and Bitcoin is at a critical inflection point. After a major breakout in February 2024, we are now facing massive structural resistance at the same trendline that has dictated previous cycle tops.
🔹 Key Levels to Watch:
📌 109,928 - Major resistance (3rd test)
📌 90,641 - 97,519 - Support zone & potential liquidity grabs
📌 79,657 - Untested (previoys breakout) breakout level
Delayed Cycle in Play?
Traditionally, Bitcoin follows a 4-year cycle, but this time, things could be different.
1️⃣ The halving took place on April 19, 2024.
2️⃣ A breakout before halving was an unusual move.
3️⃣ The Q1 2025 structure suggests either a delayed bull cycle or an early maturity phase.
What’s Next? March Breakout or Rejection?
📊 If Bitcoin breaks above 110K, we could see a parabolic move toward 120K+ and ultimately new all-time highs later in 2025.
⚠️ But if resistance holds, we might see a retest of the 90K or even 79K levels before the next leg up.
Macroeconomic Wildcards
🌍 Trump, Tariffs & Rate Cuts - The market is uncertain, and politics are playing a role. However, with rate cuts likely incoming, liquidity could flood back into Bitcoin, fueling the next breakout.
📅 The Next Few Weeks Are Critical! Stay sharp and trade wisely.
One Love,
The FXPROFESSOR 💙

BITCOIN is 'Back on Track'?🚀🔥 Bitcoin’s Next Big Move: Delayed Cycle or Just Another Test? 📈⚡
The market has been consolidating, and Bitcoin is at a critical inflection point. After a major breakout in February 2024, we are now facing massive structural resistance at the same trendline that has dictated previous cycle tops.
🔹 Key Levels to Watch:
📌 109,928 - Major resistance (3rd test)
📌 90,641 - 97,519 - Support zone & potential liquidity grabs
📌 79,657 - Untested (previoys breakout) breakout level
Delayed Cycle in Play?
Traditionally, Bitcoin follows a 4-year cycle, but this time, things could be different.
1️⃣ The halving took place on April 19, 2024.
2️⃣ A breakout before halving was an unusual move.
3️⃣ The Q1 2025 structure suggests either a delayed bull cycle or an early maturity phase.
What’s Next? March Breakout or Rejection?
📊 If Bitcoin breaks above 110K, we could see a parabolic move toward 120K+ and ultimately new all-time highs later in 2025.
⚠️ But if resistance holds, we might see a retest of the 90K or even 79K levels before the next leg up.
Macroeconomic Wildcards
🌍 Trump, Tariffs & Rate Cuts - The market is uncertain, and politics are playing a role. However, with rate cuts likely incoming, liquidity could flood back into Bitcoin, fueling the next breakout.
📅 The Next Few Weeks Are Critical! Stay sharp and trade wisely.
One Love,
The FXPROFESSOR 💙

Bitcoin Q1 2025 - Delayed Cycle (Part 2)🚀🔥 Bitcoin’s Next Big Move: Delayed Cycle or Just Another Test? 📈⚡
The market has been consolidating, and Bitcoin is at a critical inflection point. After a major breakout in February 2024, we are now facing massive structural resistance at the same trendline that has dictated previous cycle tops.
🔹 Key Levels to Watch:
📌 109,928 - Major resistance (3rd test)
📌 90,641 - 97,519 - Support zone & potential liquidity grabs
📌 79,657 - Untested (previoys breakout) breakout level
Delayed Cycle in Play?
Traditionally, Bitcoin follows a 4-year cycle, but this time, things could be different.
1️⃣ The halving took place on April 19, 2024.
2️⃣ A breakout before halving was an unusual move.
3️⃣ The Q1 2025 structure suggests either a delayed bull cycle or an early maturity phase.
What’s Next? March Breakout or Rejection?
📊 If Bitcoin breaks above 110K, we could see a parabolic move toward 120K+ and ultimately new all-time highs later in 2025.
⚠️ But if resistance holds, we might see a retest of the 90K or even 79K levels before the next leg up.
Macroeconomic Wildcards
🌍 Trump, Tariffs & Rate Cuts - The market is uncertain, and politics are playing a role. However, with rate cuts likely incoming, liquidity could flood back into Bitcoin, fueling the next breakout.
📅 The Next Few Weeks Are Critical! Stay sharp and trade wisely.
One Love,
The FXPROFESSOR 💙

BITCOIN Pure 2-month symmetry targets $102.5k and $108k.Bitcoin (BTCUSD) has been practically consolidating for more than 2 months (since November 22 2024) within a Rectangle pattern and what's more striking is the amazing symmetry it has been displaying.
Right now the price has broken above a Lower Highs trend-line following the February 03 2025 Low near the Rectangle's Bottom and every time it has done so within this pattern, a rally towards the Higher Highs trend-line started.
It is interesting to mention that so far the range from the first High to the last High of this trend-line has been 101 4H candles (roughly 25 days). Since on the new (blue) phase that started on the February 03 High, we had our first, we can expect it to conclude near the top of the Rectangle by February 26.
This technical symmetry can help us set our next short-term Targets. Target 1 is at $102500, just below Symmetrical Resistance Zone 1 and Target 2 is at $108000, just below Symmetrical Resistance Zone 2 (top of the Rectangle as mentioned). Needless to say, the current 4H RSI pattern resembles the bullish break-outs above both of the previous first Lower Highs fractals.
Do you think this symmetry will play out in the same way once again? Feel free to let us know in the comments section below!
-------------------------------------------------------------------------------
** Please LIKE 👍, FOLLOW ✅, SHARE 🙌 and COMMENT ✍ if you enjoy this idea! Also share your ideas and charts in the comments section below! This is best way to keep it relevant, support us, keep the content here free and allow the idea to reach as many people as possible. **
-------------------------------------------------------------------------------
Disclosure: I am part of Trade Nation's Influencer program and receive a monthly fee for using their TradingView charts in my analysis.
💸💸💸💸💸💸
👇 👇 👇 👇 👇 👇

BITCOIN You can't get a more bullish symmetry than this.Bitcoin (BTCUSD) marginally breached its 1D MA100 (green trend-line) two days ago and immediately rebounded in a mirror price action like last year's bounce of January 23 2024. We analyzed this on our previous publication but what we bring you today is the amazing RSI based symmetry of the two fractals.
The dominant long-term pattern remains a Channel Up and this is what will most likely guide BTC to the finish line and the Top of this Cycle. This pattern displays two (blue) Accumulation Channels, which is the formation we're currently at.
In fact Bitcoin has most likely started the process of breaking above this Channel as the January 23 2024 1D MA100 bounce was the starting point of the Bullish Leg (green) that made a Higher High at the top of the long-term Channel Up.
As mentioned, what's incredibly interesting is the 1D RSI symmetry between the two Accumulation Channels. As you can see on the current Accumulation Channel, the time between the 2nd RSI Lower High (blue circle) and 3rd (yellow circle) was 25 days and between the 3rd and 4th (red circle) was 32 days. The respective ranges on the previous Accumulation Channel were 25 and 34 days, which showcase a striking degree of symmetry.
The Bullish Leg peaked on the 2.618 Fibonacci extension from the last High (red circle) and as a result, we can expect the new rally to follow an equally symmetric/ proportional rise and target the new 2.618 Fib at $145000.
Can this be the case by March/ April 2025 or is it to soon? Feel free to let us know in the comments section below!
-------------------------------------------------------------------------------
** Please LIKE 👍, FOLLOW ✅, SHARE 🙌 and COMMENT ✍ if you enjoy this idea! Also share your ideas and charts in the comments section below! This is best way to keep it relevant, support us, keep the content here free and allow the idea to reach as many people as possible. **
-------------------------------------------------------------------------------
💸💸💸💸💸💸
👇 👇 👇 👇 👇 👇

$BTC - Value AreaThis bounce might just be shorts covering and/or hedges – a kind of mechanical reaction following a liquidation event.
If we are going to consolidate within the current value area (96.5k-104k), I wouldn't be surprised if we get an upthrust retesting 103.8k-104k range before rotating back to take out the swing low.
A potential level for shorting, but I'm only interested in shorting on signs of weakness or a strong rejection at that level.
Possible targets:
94k - 93.5k
90k- 88.5k
84k-80k

Bitcoin's Bullish Momentum Holding Strong
Bitcoin has reached the $94,500 entry point outlined in the previous idea and showed a strong bullish reaction. This confirms the level as an area of interest. However, there is strong potential for price to revisit $94,500 once more, presenting a great buying opportunity for the next leg up.
As long as market conditions align, we can look for confirmations to target $126,500. Patience remains key, but the setup is developing well.
Will Bitcoin offer another perfect entry before continuing its bullish breakout?
🔗 Check the original idea:

BITCOIN Can a 1D MA100 rebound reverse the 'Tariffs narrative'?Just a week ago (January 27, see char below) we made a case of why it was essential for Bitcoin (BTCUSD) to test and rebound on its 1D MA100 (green trend-line), if the market was to find the necessary Support to move it forward through the rest of the year and the Bull Cycle:
Well BTC went on to confirm our expectation and hit the 1D MA100 for the first time in almost 4 months (since October 11 2024).
That analysis was focused on the current Bull Cycle (2023 - 2025) and the recurring 1D MA100 rebound sequence within the 2-year Channel Up, which has so far provide its Higher High both times.
Today's analysis examines if this is a pattern that emerged and held during the previous Bull Cycles as well. The results are eye opening.
During the last two years of each of the past 3 Bull Cycles, a 1D MA100 contact has most of the times (9) met with an incredible rebound, making it the most efficient buy entry on such basis. It was only 3 times this failed to initiate an immediate rebound (April 2024/ ETF led rally corrected, April 2021/ Musk led rally corrected, March 2020/ COVID flash crash), all valid reasons fundamentally.
Is this new all-out Trade War another one of those events? Not impossible, but this chart shows that it is 3 times more probable for this 1D MA100 contact to produce an aggressive rebound. If we narrow the sample to just the last year of the Bull Cycle, it was only once that a 1D MA100 failed to produce an instant rally.
As a result, it is now more probable to see a rally similar to the one that followed the January 2024 or October 2024 1D MA100 contacts, which were within a +85% / +90% range. Even the 1D RSI patterns among the Cycle fractals at the start of each final Bull year are similar.
So what do you think? Do you expect this technical 1D MA100 contact to reverse the dismal Tariffs sentiment? Feel free to let us know in the comments section below!
-------------------------------------------------------------------------------
** Please LIKE 👍, FOLLOW ✅, SHARE 🙌 and COMMENT ✍ if you enjoy this idea! Also share your ideas and charts in the comments section below! This is best way to keep it relevant, support us, keep the content here free and allow the idea to reach as many people as possible. **
-------------------------------------------------------------------------------
💸💸💸💸💸💸
👇 👇 👇 👇 👇 👇
BTCUSD Sell RiskHi it looks like BTCUSD has continued to show some selling. There is risk of possible continued selling.
Thanks please follow me thanks.
@ilyaskhan.1994 #btcusd #bitcoin

Bitcoin: Price Bounce Back To 100K Area?Bitcoin has rejected the 105K AREA resistance (wrote about this for two weeks see previous). Risk for longs was very high in that area, if you bought, now you pay. The 100K support was cleared but there is some minor support around the mid to high 96Ks (see arrow). There may be a brief retrace from here back to the low 100Ks over the next day or two. IF the 95K area is cleared, the 90K support can be tested quickly. This is a very high momentum environment, the key to navigating this is paying more attention to the bigger picture and adjusting risk by sizing smaller.
Knowing your environment is key to adjusting effectively. For example, in the recent weeks, price action on smaller time frames has been extreme, moving 500 points in less than a minute. While this may sound great on paper, the problem is getting caught in noise will be very expensive, since the whole point of working on smaller time frames is to utilize larger size. This is where zooming out and getting smaller with the plan of averaging into a position can help to better control risk while minimizing getting caught in noise.
On the daily chart, pay attention to the levels and how price reacts on time frames like the 4 hour (swing trades). Notice the pin bar (arrow) off the 96K area recently. This serves as a point of reference for longs. A reversal candle or strong close on a smaller time frame like 4 hour or 1 hour can prompt you to take a smaller position with a much wider than usual stop (like 2 to 3K points). If Bitcoin fails, and price action stays bearish, you get stopped out but you never add to the position. You lose on small size. IF Bitcoin shows strength off this level instead you can justify an add, and aim for at least 2 to 3K profit objective (100K to 102K area).
The point is you are adjusting your risk to the environment. If there is any skill to this game, it is knowing how to adjust your style, size, risk as the environment changes.
The market gives the clues and that is the best source to acknowledge them from. Bitcoin has been in a consolidation since mid December with the 108K AREA being the high and the 90K AREA being the low. While the general trend is bullish, there are going to be numerous swing trade opportunities within the range, especially at the extremes. In ranging environments BOTH support and resistance levels can hold UNTIL the range eventually breaks. You are better off adjusting to the price action around the major and minor levels within this range rather than trying to forecast the breakout to 200K.
Thank you for considering my analysis and perspective.

Will Bitcoin Deposit 30,000 Forever?As you can see, Bitcoin is heading to the lower trend line
Will he break the last line of defense and go back to the $400 box?
Or will he continue his career to 128000 dollars?
Indicators in oversoldness, 6 days left to discover the truth
Note: There is a possibility of right or wrong

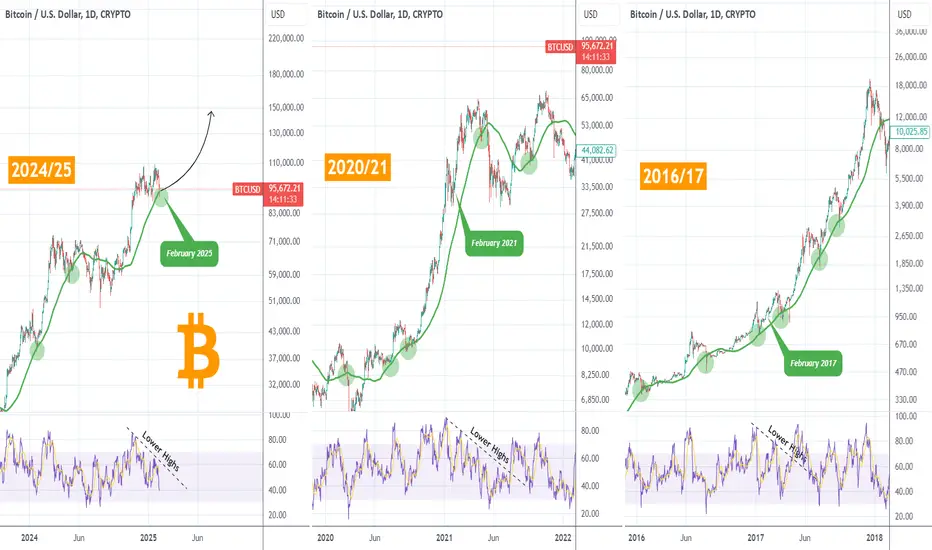
BITCOIN This where things get interesting for the greedy..Bitcoin / BTCUSD has entered its parabolic rally mode, as we are in the final year of the Bull Cycle.
We are 812 days after the Bear Cycle bottom and on this chart we applied that range on the previous Cycle to get an idea of were we are in relation to the past.
As you can see we are just after a 1week LMACD squeeze, which in March 15th 2021 turned into a bearish cross that delivered a strong correction while in March 20th 20217 a smaller technical pull back.
In both cases the EMA Bollinger Bands Baseline (green) came to support.
This Cycle however draws more similarities with 2017.
It needs to be said that when BTC is in parabolic rally mode, it tends to spend more time above the BB Upper band (blue).
What this indicates is that any pull back towards the baseline should be bought as Bitcoin is now more likely to make higher highs above the Upper Band.
We project a smoother uptrend compared to past Cycles towards the end of 2025.
Be greedy, buy every pull back below the blue line and take profit a bit above it. Repeat until September-October.
Follow us, like the idea and leave a comment below!!

#Bitcoin Road to enthusiasm!bitcoin parabolic run seems to be far away from the local top, which matches the probability of seeing a local top in October 2025, as I mentioned in my previous studies.
