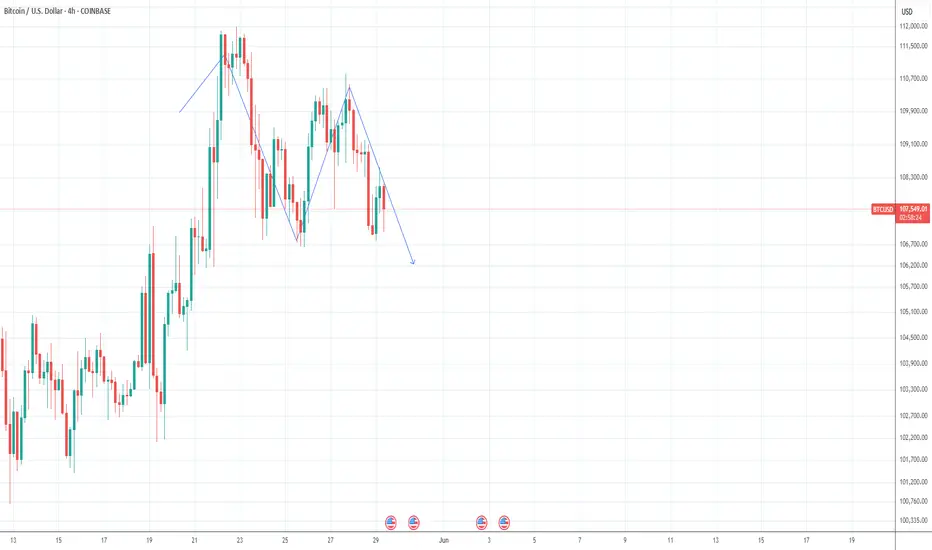
my prediction is on bitcoin downward correction is onprevious post i told you guys bitcon need a downward correction. now see the results already its' going down.
Bitcoin-btcusd
GameStop goes crypto: what 4,710 BTC means for the chartGameStop has disclosed a $500 million investment in Bitcoin, marking its first significant move into the crypto space.
The video game retailer is sitting on $4.76 billion in cash and hasn’t disclosed a limit on future purchases.
GameStop shares fell 10% following the announcement, while Bitcoin pulled back toward $107,000. A 14% rally would be needed for BTC to reach the 127.2% Fibonacci extension at $122,000, while $103,800 could be a key support level where we previously saw consolidation.
CEO Ryan Cohen addressed the Bitcoin 2025 Conference in Las Vegas via pre-recorded video Wednesday too, citing macroeconomic concerns as a key driver behind the company’s decision. These likely include rising U.S. debt levels and trump tariffs.

recap - " Bitcoin reversal confirmed ?! "BITCOIN reversal confirmed?! 👀
BITSTAMP:BTCUSD
How did this idea develop? 🤔
🥇Recap of the idea(s) from March 14, 2025 (see right 👀 under “Related Publications”)🎯
Hello ❤TradingView Community 👋
After the sell-off/correction ended on April 7, 2025' - Bitcoin reached an absolute low of $74434. This was followed by a nice rally and the complete fulfillment of the price targets from the idea of March 14, 2025 (push the play-button 😍).
Everything important is in the chart!
💡 This idea is closed at this point ✔
👉 All targets have been achieved 🎯💪
💥Follow me to stay up to date and be the first to receive these important updates/news & not miss anything! ⏰🔔
Furthermore, any criticism and suggestions etc. are welcome. - Feel free to share this idea.
Have a nice day & happy trading folks 🔥💪
M_a_d_d_e_n ✌
NOTE: The above information represents my idea and is not an investment/trading recommendation! No guarantee & exclusion of liability!
👉 BITCOIN roadmap/outlook (from 27th february 2024) 💡

Is Bitcoin Ready for Its Next Leg Up? Here’s What We Know So FarBitcoin BITSTAMP:BTCUSD is so back — not just back like “we recovered the dip,” but back like “new all-time highs, let’s go shopping for Lambos on moons” back.
If you’ve been following our Top Stories coverage, you’ll know that the OG token vaulted past $109,500 last week, then kissed $111,900 in “Tom Cruise falling off a building” style. Only that there wasn’t a fall to the ground. Instead, Bitcoin prices got stuck near $110,000 and are now waiting for the next catalyst.
Where are we in the cycle? The memes are pumping. Maxis are chest-thumping (this one’s for you, Saylor ). And the market? Well, it’s trying to figure out if this rocket still has fuel, or if we’re hovering at apogee before gravity reminds us it’s still a thing.
Let’s break down what’s really going on — with numbers, context, and just enough forecast to keep it spicy.
🚀 Bitcoin Goes Bionic
Call it what you want — a breakout, a blowoff, or a moonshot — Bitcoin just rewrote the record books. The OG coin is up 48% since its April lows, a run that’s as explosive as it is poetic.
Remember the bearish chants echoing when BTC dipped near $74,000 in early spring? And all those Bitcoin permabears saying it’s all going to zero? Yeah, those are suddenly hard to hear over the rocket engines.
This is the moment Bitcoin believers have been waiting for. Institutional interest continues to show inflows are strong. Adoption is real and making solid progress. And price action is loud — loud enough to drown out the skeptics still quoting tulip bubbles from 1637.
💥 Why the Breakout? A Perfect Storm
Looking at the fundamentals and the technicals — this wasn’t a fluke. It was a perfect cocktail of macro tailwinds, regulatory green lights, and unrelenting digital gold fever.
ETF flows? Exchange-traded funds are collecting record levels of fresh capital — all eleven of them .
Institutional demand? Climbing faster than Saylor can tweet.
Macro backdrop? Soft dollar, muted inflation, and a shiny 90-day trade truce between the US and China paired with one between the US and the EU .
Regulatory mood? A lot less hostile than the Biden administration, with a stablecoin bill clearing the Senate’s procedural vote and Texas passing a law to hold Bitcoin in its reserve fund.
Bitcoin didn’t ride the wave — it was the wave. And with volatility finally working for traders, not against them, the rally gained real traction.
📉 Not All Risk is Behind Us
Now before we start naming stars after Satoshi, let’s pump the brakes (just a little). The flagship crypto might be chilling around $110,000, but this asset class has the emotional range (and discipline) of a toddler. We’ve seen rallies like this before. We’ve also seen how quickly they unravel.
Upcoming economic data could throw a wrench in the gears. Here’s what to watch for this week:
Wednesday: Fed minutes
Thursday: GDP figures
Friday: Core PCE inflation
Any surprises here — especially hotter-than-expected inflation or hawkish Fed sentiment — could rattle the risk-on party. Bitcoin loves liquidity. If the Fed hints at tightening, the rocket might need to refuel mid-air.
🧭 Key Levels to Watch
Technically, the $111,900 print is your short-term ceiling. It’s the new line in the sand — the price everyone’s watching, waiting for a clean break or a hard rejection.
On the downside, $105,000–$106,000 is developing as support. Break that, and $100,000 becomes the psychological safety net. Below that? Well, let’s not talk about it unless we have to.
Until then, price is consolidating. Think of it like a pit stop — a chance for bulls to breathe, for bears to panic quietly, and for traders to argue about Fibonacci levels.
🛰️ Is $120K Next? Or Is This the Top?
But let’s dig into it a little bit. The real question is whether this rally still has legs. Some traders are calling $120,000 a “magnet level.” Others are treating current prices like the top and selling into strength.
The answer? Probably both.
Momentum is still there — just cooled off a bit. Volume’s down slightly. Social buzz is still high up there. The market’s in a classic “wait-and-see” phase, prepping for a bigger move in either direction.
What could break the stalemate?
A blockbuster inflation report (bullish if soft).
Another policy win from Washington.
Or the most powerful force of all: a dovish stance from the man who moves markets with a simple “Good afternoon” (bonus points if you guess who that is!)
📢 Final Word: Celebrate, But Stay Sharp
If you’ve been long since the dip, this is your moment. Pop some virtual (or real?) champagne. Screenshot that green PnL. Post a gif of Elon and Trump dancing.
But if you’re entering now, zoom out. Yes, momentum is bullish. Yes, fundamentals are stronger than ever. But Bitcoin doesn’t do straight lines for long. And your stop-loss isn’t going to set itself.
Whether $120K is next or we pull back to reset, the next few sessions will be crucial.
Your move : Are you buying this breakout? Waiting for confirmation? Or just enjoying the view from orbit? Let us know how you’re playing this Bitcoin beast — because one thing’s certain: it’s never boring up here.

BITCOIN repeating every Cycle's final rally!Bitcoin (BTCUSD) has been on a strong rally since the April 2025 bottom on the 1W MA50 (blue trend-line) and that's perfectly aligned with the 1W MA50 rebound it had on the previous two Cycles in June 2021 and June 2017.
As you can see, those (blue circles) where the All Time High (ATH) Pivot trend-line test before the final (parabolic) rally of the Cycle started, which was its most aggressive part.
In 2017 it was much stronger and the price rallied much higher, which is natural as the market was much less mature (institutionally) than today, but it is not improbable to get a rally similar to July - November 2021.
Can that be enough to push BTC to $150k and beyond? Feel free to let us know in the comments section below!
-------------------------------------------------------------------------------
** Please LIKE 👍, FOLLOW ✅, SHARE 🙌 and COMMENT ✍ if you enjoy this idea! Also share your ideas and charts in the comments section below! This is best way to keep it relevant, support us, keep the content here free and allow the idea to reach as many people as possible. **
-------------------------------------------------------------------------------
💸💸💸💸💸💸
👇 👇 👇 👇 👇 👇

BTCUSD: Urgently needs to break above this trendline!Bitcoin is bullish on its 1D technical outlook (RSI = 65.624, MACD = 4011.100, ADX = 25.476) but not overbought anymore as the aggressive weekly rallies since the 1W MA50 rebound have been decelerated. The next heavy obstacle is the HH trendline that runs on top of the January 20th 2025 and December 16th 2024 Highs and got hit last week. So far the price hasn't crossed above it but it needs to urgently in order to avoid a rejection with snowball effects.
The last time Bitcoin faced a similar HH trendline Resistance was on the October 23rd 2023 1W candle and it succesfully smashed through it, completing a +79.23% rise before consolidating again. If it breaks again above it, we expect the same minimum rally, which gives us a TP = 133,500.
## If you like our free content follow our profile to get more daily ideas. ##
## Comments and likes are greatly appreciated. ##

Bitcoin - Approaching the all time high!Bitcoin - CRYPTO:BTCUSD - will break out again:
(click chart above to see the in depth analysis👆🏻)
It has been quite some time since we saw such a strong move on Bitcoin. But finally - not totally unexpected to be honest - Bitcoin is following its destiny and about to create another new all time high. Patience is key and strategy, risk and mindset will help you master the volatility.
Levels to watch: $100.000
Keep your long term vision!
Philip (BasicTrading)

BTC Crypto Futures Trade Plan 2025-05-26BTC Crypto Analysis Summary (2025-05-26)
Comprehensive Summary of Each Model
Grok/xAI Report
BTC at $109,553, trading above all major MAs (20/50/200 SMAs, 9/21 EMAs) → strong bullish trend RSI 67.02 (approaching overbought), MACD positive but slight bearish divergence Volume declining → possible consolidation or reduced buying interest Funding rate low (0.0002%) → not overleveraged long Trade suggested: long at $110,000, SL $107,000, TP1 $113,000, TP2 $115,000, size 1% equity, confidence 80%
Claude/Anthropic Report
Confirms price above all key MAs, RSI approaching overbought, MACD divergence Price near upper Bollinger Band → resistance Concludes short-term momentum weakening → moderately bearish bias Recommends no trade (confidence 72%), waits for break above $111,800 or below $105,000
Llama/Meta Report
Bullish MA alignment, RSI slightly overbought, price near upper BB Funding rate neutral, sentiment generally positive Trade suggested: long on pullback to SMA20 at $105,295.59, SL $103,000, TP $110,000, size = 2–3% equity, confidence 80%
Gemini/Google Report
Strong bullish trend (EMA9 > EMA21 > SMA20 > SMA50 > SMA200), RSI 67, BB upper ~$111,724 MACD bearish crossover → potential short-term pullback Recommends long at ~$109,550, SL $107,700, TP $113,100, size 1 BTC, confidence 75%
DeepSeek Report
Price near upper Bollinger Band, MACD bearish crossover, RSI divergence Countertrend short trade: entry $109,553, SL $111,725, TP $105,295, size 1 BTC, confidence 75% Areas of Agreement and Disagreement
Agreement
BTC is in a strong uptrend, trading above all major moving averages RSI ~67 suggests rising momentum but nearing overbought MACD shows a bearish divergence or crossover, warning of short-term momentum loss Price is close to the upper Bollinger Band → stretched conditions
Disagreement
Directional bias: Grok, Llama, and Gemini bullish; Claude is cautious/no-trade; DeepSeek bearish countertrend Entry levels: ranges from pullbacks to 105k (Llama) to market price ~109.55k (Gemini/Grok) Risk appetite: varying leverage and position-sizing recommendations Trade/no-trade: Claude advises holding; others recommend active positions Conclusion and Trade Recommendation
Overall Market Direction Consensus
Moderately Bullish: the dominant trend is up, supported by MA structure and recent performance, despite short-term momentum warnings.
Recommended Trade
Direction: Long BTC futures Entry Range: Near current market (109,500–109,600) or immediate retest of EMA9 (~109,550) Stop Loss: 107,700 (below EMA9 and minor support) Take Profit: 113,100 (just above recent swing highs/upper BB) Position Size: 1 BTC (adjust per account to risk ~1–2%) Confidence Level: 78%
Key Risks and Considerations
Momentum Divergence: MACD bearish crossover and RSI near overbought may trigger a pullback Volatility Spikes: leverage can amplify slippage and liquidation risk Broader Crypto Moves: altcoin correlation or market-wide news can quickly shift prices Funding Rate Shifts: a sudden spike could accelerate long-side liquidations
TRADE_DETAILS (JSON Format) { "instrument": "BTC", "direction": "long", "entry_price": 109550.0, "stop_loss": 107700.0, "take_profit": 113100.0, "size": 1, "confidence": 0.78, "entry_timing": "market_open" }
📊 TRADE DETAILS 📊 🎯 Instrument: BTC 📈 Direction: LONG 💰 Entry Price: 109550.0 🛑 Stop Loss: 107700.0 🎯 Take Profit: 113100.0 📊 Size: 1 💪 Confidence: 78% ⏰ Entry Timing: market_open
Disclaimer: This newsletter is not trading or investment advice but for general informational purposes only. This newsletter represents my personal opinions based on proprietary research which I am sharing publicly as my personal blog. Futures, stocks, and options trading of any kind involves a lot of risk. No guarantee of any profit whatsoever is made. In fact, you may lose everything you have. So be very careful. I guarantee no profit whatsoever, You assume the entire cost and risk of any trading or investing activities you choose to undertake. You are solely responsible for making your own investment decisions. Owners/authors of this newsletter, its representatives, its principals, its moderators, and its members, are NOT registered as securities broker-dealers or investment advisors either with the U.S. Securities and Exchange Commission, CFTC, or with any other securities/regulatory authority. Consult with a registered investment advisor, broker-dealer, and/or financial advisor. By reading and using this newsletter or any of my publications, you are agreeing to these terms. Any screenshots used here are courtesy of TradingView. I am just an end user with no affiliations with them. Information and quotes shared in this blog can be 100% wrong. Markets are risky and can go to 0 at any time. Furthermore, you will not share or copy any content in this blog as it is the authors' IP. By reading this blog, you accept these terms of conditions and acknowledge I am sharing this blog as my personal trading journal, nothing more.

Bitcoin to 140k - 170k (26MAY2025)On monthly timeframe we have few trendlines which show us, 140 to $170,000 is likely according to the 100% of Fibonacci Extension as well, but above that is unlikely IMO.

Bitcoin H1 | Overlap support at 50% Fibonacci retracementBitcoin (BTC/USD) is falling towards an overlap support and could potentially bounce off this level to climb higher.
Buy entry is at 106,479.20 which is an overlap support that aligns with the 50.0% Fibonacci retracement.
Stop loss is at 104,000.00 which is a level that lies underneath a swing-low support.
Take profit is at 110,363.00 which is a pullback resistance that aligns close to the 61.8% Fibonacci retracement.
High Risk Investment Warning
Trading Forex/CFDs on margin carries a high level of risk and may not be suitable for all investors. Leverage can work against you.
Stratos Markets Limited (tradu.com ):
CFDs are complex instruments and come with a high risk of losing money rapidly due to leverage. 63% of retail investor accounts lose money when trading CFDs with this provider. You should consider whether you understand how CFDs work and whether you can afford to take the high risk of losing your money.
Stratos Europe Ltd (tradu.com ):
CFDs are complex instruments and come with a high risk of losing money rapidly due to leverage. 63% of retail investor accounts lose money when trading CFDs with this provider. You should consider whether you understand how CFDs work and whether you can afford to take the high risk of losing your money.
Stratos Global LLC (tradu.com ):
Losses can exceed deposits.
Please be advised that the information presented on TradingView is provided to Tradu (‘Company’, ‘we’) by a third-party provider (‘TFA Global Pte Ltd’). Please be reminded that you are solely responsible for the trading decisions on your account. There is a very high degree of risk involved in trading. Any information and/or content is intended entirely for research, educational and informational purposes only and does not constitute investment or consultation advice or investment strategy. The information is not tailored to the investment needs of any specific person and therefore does not involve a consideration of any of the investment objectives, financial situation or needs of any viewer that may receive it. Kindly also note that past performance is not a reliable indicator of future results. Actual results may differ materially from those anticipated in forward-looking or past performance statements. We assume no liability as to the accuracy or completeness of any of the information and/or content provided herein and the Company cannot be held responsible for any omission, mistake nor for any loss or damage including without limitation to any loss of profit which may arise from reliance on any information supplied by TFA Global Pte Ltd.
The speaker(s) is neither an employee, agent nor representative of Tradu and is therefore acting independently. The opinions given are their own, constitute general market commentary, and do not constitute the opinion or advice of Tradu or any form of personal or investment advice. Tradu neither endorses nor guarantees offerings of third-party speakers, nor is Tradu responsible for the content, veracity or opinions of third-party speakers, presenters or participants.

Bitcoin Lines- What you can see if you remove Bars and replace them by Lines ?
- Congratulation, you just removed the noise in the chart.
- Everything is in graph.
- Covid19 Black Swan included.
- Not a price prediction.🤷♂️.
Happy Tr4Ding !

BITCOIN can aim as high as $300k on this CycleBitcoin / BTCUSD is trading inside a Channel Up since the December 2017 High.
This pattern is running through 2 Cycles already and technically is targeting for the top of the Channel Up.
A new +2119% rise until the top, can exceed $300k.
Follow us, like the idea and leave a comment below!!

BITCOIN Will Keep Growing! Buy!
Hello,Traders!
BITCOIN is trading in an
Uptrend and the coin made a
Great breakout of the previous
ATH which makes us super
Bullish biased so as BTC is
Making a local bearish correction
We will be expecting a bullish
Rebound from the rising support
And a further bullish move up
Buy!
Comment and subscribe to help us grow!
Check out other forecasts below too!
Disclosure: I am part of Trade Nation's Influencer program and receive a monthly fee for using their TradingView charts in my analysis.

BTCUSD: 1D Golden Cross signals more upside to 155k.Bitcoin dropped below the overbought barrier on its 1D technical outlook (RSI = 69.592, MACD = 4447.700, ADX = 32.855) following today's Trump led pullback. On the long term though, this is nothing but a technical reaction to fundamentals and not enough to invalidate the bullish trend as not only did we make new ATH this week but also just completed a 1D Golden Cross. This is the first such pattern since October 27th 2024, which validated the previous bullish wave that peaked on the 2.0 Fibonacci extension. According to that, Bitcoin should extend the current uptrend with TP = 155,000.
## If you like our free content follow our profile to get more daily ideas. ##
## Comments and likes are greatly appreciated. ##

Golden Cross? No Thanks. Here’s How to Get In Early.” – Part 2📉 “Golden Cross? No Thanks. Here’s How to Get In Early.” – Part 2
By FXProfessor
First of all — thank you for the likes, comments, and support on Part 1. It means a lot. 🙏
Let’s take it a step further today and fill in the gaps.
🔄 Quick Recap:
Last time, we exposed the Golden Cross for what it is —
📉 A lagging tool
📉 A confirmation at best
📉 The afterparty, not the entry
I showed you how EMAs are better than SMAs…
…but structure and trendlines still come first in my world.
⚙️ The FXProfessor Method (In Order):
Trendlines (my style)
Fibonacci Wedges
Structure – channels, ranges, pressure zones
EMAs
Divergences
Other indicators (case-by-case)
📉 Live Example – BTCUSD 1H:
Trendline rejection: We shorted the third touch 💥
Structure zone: Repeated tests + rejection = confidence
Divergences: I use an amazing divergence tool (min divergence = 3)
Result: Market turned exactly where structure and divergence aligned
🧠 A Little Secret:
I have a separate layout just for divergences.
Sophisticated. Tailored.
But even this simplified version shows 3 bearish divergences....
That’s not coincidence. That’s precision. And it comes Fast!
📌 Key Insight:
EMAs can be useful, but they come after the story is already unfolding.
Even if they support the price, by the time they cross — the trade is halfway done.
So remember:
Structure and pressure give us the first clues.
Indicators confirm what structure already told us.
This is what I call:
💡 Trading Rethought.
You don’t need to wait for lagging signals.
You can see the move forming, if you know where to look.
More content coming soon — and yes, it’s going to take your trading to another level.
One Love,
The FXProfessor 🧠📈

BITCOIN is attempting to converge with past Cycles!Bitcoin (BTCUSD) is experiencing the weakest Bull Cycle in its history, a natural product of the Theory of Diminishing Returns (TDM).
This chart couldn't have put it better as we show all Cycles since BTC's first day, one on top of the other. Naturally the first Cycles were the most aggressive, witnessing extraordinary gains as the upside potential of a fresh market was enormous in its early days.
The 2015 - 2017 (blue trend-line) and 2019 - 2021 (black trend-line) Bull Cycles have been harmonized to a more traditional capital market state and this is obvious on their trend-lines, which exhibit similar parallel price action. Whenever the two diverged, they converged at some point during the Cycle.
The current Cycle (2023 - 2025) following the late February 2025 divergence, is now attempting to converge again with its strong rebound in the past 6 weeks. Being however within a Channel Up throughout the entirety of the Cycle, it appears that it will do so in a structured way and as the TDM suggests, will offer weaker gains.
What we can project, as we've shown on previous studies in great detail, is the timing of the Cycle Top. Based on past Cycles, it should be within October - December 2025. Timing your exit strategy can perhaps be more effective than assigning a certain Target, even though the peak is expected to be anywhere within the $150k - $200k range.
So do you agree that the rise we're witnessing is the Cycle's attempt to converge with past ones and close the gap before it tops? Feel free to let us know in the comments section below!
-------------------------------------------------------------------------------
** Please LIKE 👍, FOLLOW ✅, SHARE 🙌 and COMMENT ✍ if you enjoy this idea! Also share your ideas and charts in the comments section below! This is best way to keep it relevant, support us, keep the content here free and allow the idea to reach as many people as possible. **
-------------------------------------------------------------------------------
💸💸💸💸💸💸
👇 👇 👇 👇 👇 👇

Bitcoin H1 | Pullback support at 23.6% Fibonacci retracementBitcoin (BTC/USD) is falling towards a pullback support and could potentially bounce off this level to climb higher.
Buy entry is at 109.174.00 which is a pullback support that aligns with the 23.6% Fibonacci retracement.
Stop loss is at 105,800.00 which is a level that lies underneath a multi-swing-low support and the 50.0% Fibonacci retracement.
Take profit is at 113,948.50 which is a resistance that aligns with the 100.0% Fibonacci projection.
High Risk Investment Warning
Trading Forex/CFDs on margin carries a high level of risk and may not be suitable for all investors. Leverage can work against you.
Stratos Markets Limited (tradu.com ):
CFDs are complex instruments and come with a high risk of losing money rapidly due to leverage. 63% of retail investor accounts lose money when trading CFDs with this provider. You should consider whether you understand how CFDs work and whether you can afford to take the high risk of losing your money.
Stratos Europe Ltd (tradu.com ):
CFDs are complex instruments and come with a high risk of losing money rapidly due to leverage. 63% of retail investor accounts lose money when trading CFDs with this provider. You should consider whether you understand how CFDs work and whether you can afford to take the high risk of losing your money.
Stratos Global LLC (tradu.com ):
Losses can exceed deposits.
Please be advised that the information presented on TradingView is provided to Tradu (‘Company’, ‘we’) by a third-party provider (‘TFA Global Pte Ltd’). Please be reminded that you are solely responsible for the trading decisions on your account. There is a very high degree of risk involved in trading. Any information and/or content is intended entirely for research, educational and informational purposes only and does not constitute investment or consultation advice or investment strategy. The information is not tailored to the investment needs of any specific person and therefore does not involve a consideration of any of the investment objectives, financial situation or needs of any viewer that may receive it. Kindly also note that past performance is not a reliable indicator of future results. Actual results may differ materially from those anticipated in forward-looking or past performance statements. We assume no liability as to the accuracy or completeness of any of the information and/or content provided herein and the Company cannot be held responsible for any omission, mistake nor for any loss or damage including without limitation to any loss of profit which may arise from reliance on any information supplied by TFA Global Pte Ltd.
The speaker(s) is neither an employee, agent nor representative of Tradu and is therefore acting independently. The opinions given are their own, constitute general market commentary, and do not constitute the opinion or advice of Tradu or any form of personal or investment advice. Tradu neither endorses nor guarantees offerings of third-party speakers, nor is Tradu responsible for the content, veracity or opinions of third-party speakers, presenters or participants.

BTC hits ATH – But this hidden signal could ruin the rally!Bitcoin (BTC) has been in a steady and impressive uptrend over the past two months, with nearly seven consecutive weekly green candles forming on the chart. This sustained bullish momentum signals strong buying pressure and growing confidence among market participants. Such a consistent rally is rare and often indicates a broader shift in sentiment, suggesting that Bitcoin may be entering a new phase in its market cycle.
Price discovery
Recently, BTC broke through its previous all-time high (ATH) of 110K on the lower timeframes, a significant technical development. This breakout means BTC is now trading in price discovery territory, where there is no historical resistance to guide price action. While this opens the door for further gains, traders should remain cautious. Upcoming daily and weekly candle closes will be critical in determining whether this breakout is sustainable. For the move to be confirmed, Bitcoin needs to close multiple weekly candles above the previous ATH. If instead, the price falls back below the ATH on either this weekly close or the next, it could introduce downward pressure and potentially signal a failed breakout.
As we navigate this pivotal moment, it's crucial not to get swept up in the euphoria. While the price action is undoubtedly bullish, certain technical indicators warrant close monitoring to avoid complacency. In particular, the weekly Stochastic RSI and the weekly RSI are now at levels that deserve attention.
Stochastic RSI
The weekly Stochastic RSI is entering overbought territory, even before this week’s candle has closed. This suggests strong bullish momentum is currently driving the market. However, history shows that when the Stochastic RSI enters the overbought zone, it often marks areas where it was wise to take partial profits. If the blue and orange lines on the Stochastic RSI begin to cross back below the 80 level, it could indicate a weakening of momentum and the possibility of a short-term correction. That scenario becomes more likely if Bitcoin fails to continue making higher highs in the weeks ahead.
Relative Strenght Index (RSI)
Meanwhile, the Relative Strength Index (RSI) is approaching a critical resistance trendline. In previous market highs, we’ve seen the RSI top out at 89, followed by a high of 80 despite new highs in BTC’s price, a classic case of bearish divergence. If Bitcoin fails to push significantly higher in the coming weeks and the RSI does not break above the 80 level, we could be looking at a potential triple bearish divergence. This would be a strong warning signal that momentum is waning, and it could lead to a broader correction.
For this reason, it is crucial that Bitcoin continues to push upward with conviction. The RSI must break through its historical trendline and post a new high above 80 in order to invalidate the threat of bearish divergence. Should the market fail to do so and instead roll over, we may experience increased volatility and downside pressure as we move into the summer months.
Conclusion
In conclusion, while Bitcoin is exhibiting powerful bullish behavior and appears poised for further gains, the sustainability of this rally hinges on continued momentum and strong technical follow-through. Specifically, Bitcoin must maintain closes above its previous all-time high, avoid a bearish cross on the Stochastic RSI, and see the RSI break above its recent highs to neutralize the threat of bearish divergence. If these conditions are not met and momentum fades, the market may face a period of consolidation or correction in the near term. Staying vigilant and objectively monitoring these indicators will be essential for navigating what comes next.
Thanks for your support.
- Make sure to follow me so you don't miss out on the next analysis!
- Drop a like and leave a comment!

BITCOIN (BTCUSD): The Next Resistances
As Bitcoin is trading in the no man's land again,
violating a resistance cluster based on a previous ATH,
here are the next potentially strong resistance to watch.
Resistance 1: Narrow area based on 115000 level - the closest strong
psychological level.
Resistance 2: Narrow area based on 120000 level - the next
psychological level.
Resistance 1 is going to be the next goal for the buyers
and will most likely reached soon.
Its breakout will push the prices to Resistance 2.
❤️Please, support my work with like, thank you!❤️

Bitcoin: 106K Breakout To 113K Resistance.Bitcoin is attempting to break out of a minor consolidation which is a typical momentum continuation pattern. The updated wave count illustrates the potential (113K area) IF this breakout follows through over the coming week. While the structure is clearly bullish, I suspect this is a 5th of a 5th wave relative to the wave structure dating back to the 2017 peak (weekly chart). For traders this offers plenty of opportunities particularly on the long side, BUT for investors this means the higher it goes, the GREATER the risk. In other words, a break out to new highs should be considered an opportunity to take profits or reduce risk. Wave 5's typically appear to be the "best" time to get involved in a market, but offer the LEAST potential and the greatest risk.
I was not able to write my analysis over the previous week because I was hosting the ICTC 2025 (link in signature). My analysis the week before that was still bullish but I was anticipating a broader retrace which never materialized. Again the key in this game is ADJUSTING, not getting stuck on opinions. IF the 106K is compromised, and the daily candle closes strong, the breakout is more likely to follow through. This can lead price back to the 109K all time high. Since Wave 5's typically go higher than the Wave 3 peak, the next price objective is the 113K area which is proportional to Wave 1 on this impulse (similar length) when projected from the consolidation breakout (see illustration).
It is possible that Wave 5 can extend further, because the broader price structure is bullish. The mistake to avoid is thinking "it's just getting started". The further it goes, the greater the risk. Longer term investors are MOST vulnerable in situations like this because they are more likely to follow the "hype" that surrounds such moves while be completely ignorant to the shrinking shorter term potential. Wave 5's often characterize the idea that the majority of participants who were going to buy have bought, which means there will be much less potential demand in the near future.
This concept is NOT to be confused with long term fundamentals which often don't change. What changes is the sentiment and sentiment is what motivates price. The recent corrective move to the 76K low also illustrates this phenomenon. Fundamentally there was no reason for price to be pushing such lows. Such a move was provoked by the "perceived" risks brought on by the tariff drama which we know now was nothing more than a knee jerk reaction and an enormous buying opportunity for those who have the ability to see through the hype (read my analysis of that time).
In my opinion the best way to navigate this market is on smaller time frames. Anywhere from 1 minute to 4H offers more precise price references to mitigate risk from. Another consideration is if you plan to trade the broader time frame, use smaller than usual sizing if you plan to dollar cost average into higher prices. The trend is clearly BULLISH which means support levels are more likely to hold while resistances are likely to break. Expect more from longs and LESS from shorts. Short setups, while tempting are going to be lower probability. This should only be done by more experienced traders who understand how to manage the elevated risk. This is the mindset I will maintain UNTIL the market proves otherwise.
Thank you for considering my analysis and perspective.

BITCOIN made new ATH but still much time left before a Cycle topBitcoin (BTCUSD) is about to enter the final week of May, with the month mostly likely to close on a strong green candle, the 2nd straight. Though it made yesterday a new All Time High (ATH) above 109k and many are already talking about a bearish reversal, this chart shows that there is still plenty of time left before the current Bull Cycle tops.
If fact a simple measurement of the Bottom to Bottom and Bottom to Top ranges of the last 3 Cycles is enough to present all the evidence that are needed for this case.
As you can see, the previous 2 Bull Cycles lasted for 35 months (1065 days) from Bottom to Top. Similarly, the Bottom to Bottom (Bear Cycle to Bear Cycle) measurement has been 47 months (1430 days).
This amazing symmetry suggest that BTC is more likely than not to repeat this feat on the current Cycle as well. A 35 month range from Top to Top indicates that the Bull Cycle is expected to peak on October 2025, while a 47 month Bottom to Bottom range indicates that the next Bear Cycle should bottom in October 2026! As far as a potential price top is concerned, various of the previous analyses we've conducted show that $200k is a fair maximum, but the current study focuses on the timing of profit taking and not specific price levels.
So are you willing to book your profits by this October? Feel free to let us know in the comments section below!
-------------------------------------------------------------------------------
** Please LIKE 👍, FOLLOW ✅, SHARE 🙌 and COMMENT ✍ if you enjoy this idea! Also share your ideas and charts in the comments section below! This is best way to keep it relevant, support us, keep the content here free and allow the idea to reach as many people as possible. **
-------------------------------------------------------------------------------
💸💸💸💸💸💸
👇 👇 👇 👇 👇 👇

BITCOIN MASSIVE BREAKOUT|LONG|
✅BITCOIN is trading in an
Uptrend and the coin finally
Made a bullish breakout of
The previous ALL-TIME-HIGH
Of 109,200$ level which
Was a strong resistance
Level and the coin is now trading
Almost 3% above the previous ATH
Which reinforces our bullish bias
In a powerful way and after a
Potential pullback we are quite
Likely to see some further
Growth on Bitcoin
LONG🚀
✅Like and subscribe to never miss a new idea!✅
Disclosure: I am part of Trade Nation's Influencer program and receive a monthly fee for using their TradingView charts in my analysis.
BTCUSD / BITCOIN | 4H | WAIT BREAKOUT Good morning, my friends
Bitcoin support level is $96,900.00, while the resistance level stands at $104,600.00.
Right now, I'm just waiting for an upward breakout. Once that happens, I'll provide a clear target.
Don't forget to hit the like button so you don't miss any updates on this analysis.
My dear friends, your likes are the biggest motivation for me to keep sharing my analyses. I truly appreciate everyone who supports my work with their likes—thank you so much!
With respect and love.
