Bitcoin Ethereum Bitcoin Cash Litecoin 4H 1/9Bitcoin Ethereum Bitcoin Cash Litecoin 4H, Everything is being bought in 3x the market volumes in OTC trades, large institutions are either buying or looking to buy and hedge the market with crypto.
Shorting here is a mistake, any open shorts are in danger.
Won't take much for this market to regain buyers, the next move will be akin to 2017.
Bitcoin-cash

Updated Bitcoin Cash Bull Flag (30% Gain)Entry .04
Target .0535
Stop Loss .0375
Bull Flag Pattern and .5 Extension of ABC


BCH/USD 4h - Little spike before the Blood ForkHello,
I think BCH could spike a little bit because people wants to profit from the free meal the fork could offer.
Then, it will go much lower if the blockchain splits.
Thank you !

BITCOIN CASH - SHORTDo to upcoming Bitcoin Cash Fork it's pumping, no idea why...(you wont get free coins or tokens) Probably will hit previous resistance/support level and drop down.

$BCH #BCHZ18 - Bouncing BitcoinCash Trade - Day Trader ExplainsHello Lads and Ladies,
Welcome back to the TJs TA Session, today we will be taking a glance at BitcoinCash and why this might be a good LONG position.
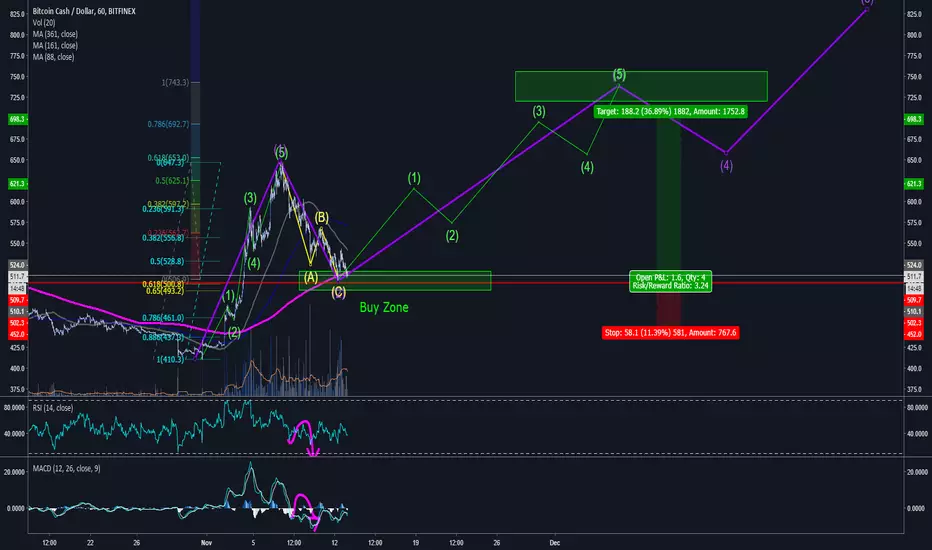
After multiple signs of a turn in trend and a massive 35% retracement on BitcoinCash, we seem now to have found a decent level of support. Here we are as well experiencing a lot of action which is giving us a nice possibility to make good and well planned leveraged trades.
The first thing that I want to talk about is the fib lines. This is one of the best examples one might find for using fibs. We have here a very clear downtrend, as well as a clear bottom. Meaning by that we can simply apply the 1 at the top and 0 at the bottom. Fibs is showing us a possible retracement/bounce after a short term trend (depending on your timeframe).
Since we are in the middle of the fight, you can adjust the fibs a little and not catch the very last and lowest spike at the bottom, sine the 23.6% fits better at that point.
Now lets take a look at our RSI and StochRSI indicators.
RSI is down to 31 points and showing us a mini bullish divergence on the 6h chart.
StochRSI is looking very very flat for a long time and now slowly starting to turn and break back upwards.
We have the all time BitMEX low at 631 and we went down to 632, basically retraced fully to the very bottom.
Especially with a day left till the hard fork of BitcoinCash, we might still see a nice pump.
AAAANNND A MASSIVE DUMP WHILE DOING IT HERE :D
Still valid, still good, simply stagger up longs till support and then run the bounce.
Based on all of the above I will make my trade like following:
BCHZ18 LONG
7.5x - 15x
Buy -> NOW - 560 - 545 - 525 - 495
Targets (longer term) are our fibs -> 723 - 772 - 811 - 850
Targets (short term) -> 631 - 650 - 687 - 700 - 722 - 753 - 777
Stop Loss -> 480

BCHUSD finished correction and now pump into 3. wave BCH is going up again, just set the orders and enjoy.
Bitcoin cash close to the brakeout!
Bitcoin Cash looks like is trying to brake to the upside!
we have a triangular pattern formed at the resistance line.
if we get the third wave that will push us above the resistance and hopefully getting support on the EMA

Bullish Short term on BCCEasy 10-15% setup on binance, Falling wedge into a reversed Head & Shoulders. Could also pump and go over 30%


BCH Bitcoin Cash Bulls give up!Looks like a drop to me but if they don't hold 580$ level it will drop back to 540$.

BCH bitcoin possible drop!BCH lost it strength. it might be a shake out but bulls need to push or price will fall back to 600ish level.
Wedge Target: 610$


just a idea from a unexperienced trader about BCHjust a idea from a unexperienced trader about BCH
i tryed to fit in tw count any suggestion ideas and tips about mistakes i propably have made are welcome

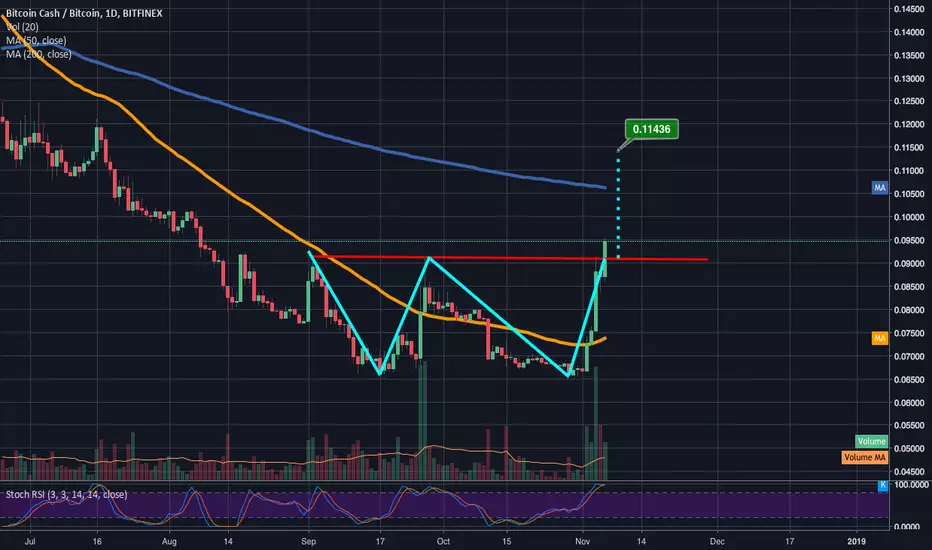
BCCash's double bottom has triggered!As I had predicted in my previous bit coin cash idea on here we reached the neckline of the double bottom on BCash and have finally triggered the breakout...the price target I have listed here is a great palce to limit sell, although we may run into decent resistance at the 1 day 200ma(in blue). We may also start to wick down just before this target too so a pip ro 2 below it as a limit sell isnt a bad call either...of course there's also a chance that fomo could allow us to send a bull wick a couple pips above this target as well. Whether or not your limit sell triggers as long as you got into this trade near the neckline a market sell will still get you plenty profit. *not financial advice*