#Bitcoin – What’s Really Happening? Daily Structure + Macro#Bitcoin – What’s Really Happening?
Daily Structure + Macro Setup = Big Move Loading
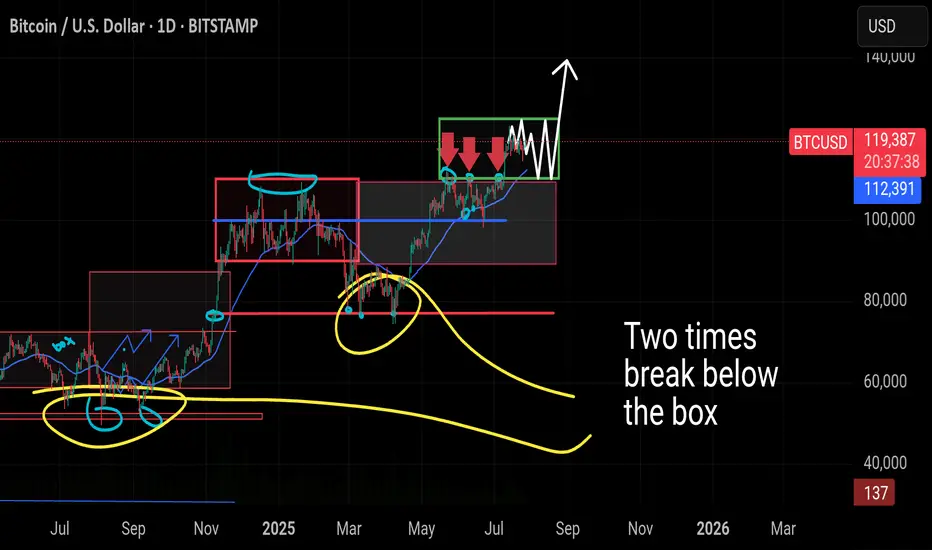
🔸 1D Chart: CRYPTOCAP:BTC Range-Bound Between $125K–$110K
Bitcoin is currently trading inside a tight sideways range, marked by resistance near $125,000 and support around $110,000. This is now the third time we've seen price consolidate in this green zone.
🔸 In the previous two attempts, BTC briefly dipped below support before quickly reclaiming the level — classic fakeouts, not real breakdowns. The current price behavior mirrors that same structure.
🔸 What If CRYPTOCAP:BTC Drops Again?
A dip below $110K or even toward $100K should not trigger panic. Historically, these wicks below the range are liquidity grabs — not signs of weakness. As long as the 200 MA holds and price doesn’t sustain under $100K, the macro trend remains bullish.
🔸 Key Zones:
– Immediate support: $112,398
– Major support: $100K psychological level
– Structure invalidation: Sustained loss below $100K (not expected)
🔸 Macro Outlook: Still Bullish
While BTC chops sideways, the broader environment is heating up:
🔸 Trump-EU Mega Trade Deal
Markets just got a major catalyst — a massive U.S.–EU agreement that includes:
– $750B in U.S. energy exports
– $600B in EU investment
– $150B in energy purchases from U.S.
This clears out tariff fears and opens the door for stocks and crypto to run. Risk appetite is returning fast.
🔸 Whale Activity Panic = Noise
Galaxy Digital wallet movement spooked the market temporarily, pushing BTC to $114,500. But zoom out:
– ETF inflows still dominate daily sell volume
– BlackRock continues absorbing supply
– Long-term whales haven’t sold — they’re holding
This was not a breakdown. It was a shakeout. Accumulation is still happening.
🔸 The Real Fuel: M2 Money Supply
Here’s where things really align for the bulls:
– In 2020, a 25% rise in M2 → BTC 800% rally
– In 2025 so far: +2.3% increase, and we’re still in “tightening”
– Largest M2 spike: +0.63% in June
Given BTC typically lags M2 by 60–90 days, the June print is setting up for a 15–17.5% upside over the coming weeks. That puts us on a clear path toward $130,000+
🔸 Bitcoin is sideways, not weak. Range-bound price action is accumulation, not distribution. Macro signals are aligning, M2 is expanding, and whale panic was short-lived.
We’re not just holding a range — we’re coiling for the breakout.
You’re early. Stay ready.
#bitcoin
Bitcoin-chart
Bearish Money Flow looking for 101kPer 2hr chart I can see a bearish divergence as smart money is unloading. This is is a liquidity grab by the whales. I eventually see Bitcoin retracing back to 98k. I will layered my charts gradually for you to review... disclosure I do have a short position active.

The BIG swing play!Been tracking BTC on monthly with Andrews pitchfork. Seems to be right on track. Note the moving average with buy/sell arrows and color coded line. Buy arrow and green line along with a green pitchfork is a solid buy. That's triple conformation. Swing trading, for me at least, seems to be the best way to avoid market maker traps and outrageous trading fees. DCA also works out nice in the long run.
On a side note. Mr. Andrews was the original developer of the idea behind the pitchfork trend lines. This modified version with Fibonacci buy/sell fields is great but one has to give credit where credit is due! That's why I will always call it the Andrews Pitchfork.
March on Friends!

BTC/USDT CHART ANALYSIS#BTC after a big drop we experienced recently, we expect to have wave (5) of growth up to 70-80 thousand dollars which I can reach by 2023, where to reach this value BTC must first go above $45-50k and hold on to it, after this last cycle we may experience a big drop to take a path to $150-200k, but we will see how BTC will act in time.
CHART: 1W
LONG-MID TERM

Bitcoin to 120,000 ?Bitcoin to 120,000 ? Weekly Cup & Handle pattern + Above the average line 150 + After a fourth crossing event. Only an idea and not a recommendation for trading!

NYAN/USDT NEW INCREASE VOLUMENYAN/USDT shows the low time frame possibility for new volume which can affect the price for an uptrend. ( depend all on high chance) There are no guarantees in the markets.
The new increase volume updates always start with interest if there is a confirmation to follow and if there is a building with a hold for a time.
90% of coins this time are not building coins. Some % also show a start fake trend and return to where it started. time frame confirmation + high levels building is important for a healthy coin.
We are in a main market where panic is active.
When this coin can confirm we will follow it further for trend follow.
This update and all our updates are not trading advice, Trading can always be risky.
Let's hope the best trades for everyone❤️

G/USDT NEW ATH POSSIBLITYThe last data shows that G/USDT has a good chance to create a new volume in the coming time frames, we will follow up to see if this coin is able to have confirmation in the coming time frames.
G/USD has a history of breakdown trends, we will follow the coin to see if this is the reversal trend.
There is possibility for new ATH

Bitcoin Charting & TA I hope you guys enjoyed the video and learned something; if you have any questions or comments feel free to ask.

BTC BITCOIN_march 25 2024IMAGE: bitcoin chart showing possible movement of Bitcoin based on past information including orange triangles to help relate the past prices compared to the present. The way Bitcoin looks now and the way Bitcoin performed in the past doesn't add up. The chart appears to be capable of lasting way longer (right side orange triangle) than what seems possible right now for Bitcoin based on the way the past values appear to spike up above the orange (left-up) triangle for a short while. Not sure what to make of this, I am. Of course, since not being in control of a trillion dollar network of funds all I can do is wonder about it but instead of having a staring contest at the same image I decided to do this one.
03/17/19 3994 18 days
04/04/19 4974 24.50%
04/04/19 4974 31 days
05/05/19 5774 16.00%
05/05/19 5774 1 day
05/06/19 5714 -1.00%
05/06/19 5714 6 days
05/12/19 7219 26.30%
05/12/19 7219 37 days
06/18/19 9341 29.30%
6 lines 93 days 133.87%
06/08/20 8156 21 days
01/29/20 9390 15.10%
04/30/20 8792 89 days
07/28/20 11071 25.90%
4 lines (bottom) 202 days 35.74%
10/23/20 13001 58 days
12/20/20 23816 83.10%
12/20/20 23816 7 days
12/27/20 26444 11.00%
12/27/20 26444 42 days
02/07/21 39244 48.40%
02/07/21 39244 33 days
03/12/21 57863 47.40%
03/12/21 57863 31 days
04/12/21 60028 3.70%
04/12/21 60028 2 days
04/14/21 63593 5.90% all time high
7 lines 173 days 389.14%
08/21/21 49331 47 days
10/07/21 55342 12.10%
2 lines 47 days 12.10% end of cycle
19 lines 936 days 2.61 years total cycle
13 lines 580 days 1.59 years new cycle
11 lines 916 days time between double lines bear cycle


BTC - Market Structure Setup 📚Hello TradingView Family / Fellow Traders. This is Richard, also known as theSignalyst.
I find BTC chart interesting as it has been following the basic laws of market structure.
So let's keep it simple => K.I.S.S. Keep it simple, samurai ;)
📈 As long as support at 28750 holds, we can anticipate a bullish movement on BTC. This bullish scenario would be confirmed by a break above the last minor high in red, approximately at 29300."
📚 Always follow your trading plan regarding entry, risk management, and trade management.
Good luck!
All Strategies Are Good; If Managed Properly!
~Rich


Bitcoin in symmetrical triangleHello Fellow Traders
Greetings from team trading the tides !
lets discuss bitcoin which is inside a Symmetrical triangle , volume is pretty low waiting for the break out to enter position for long or short but I am more interested to wait till it reaches 31-32 k level which is a major resistance area and a good distribution point if we see the history .
potential area to initiate short : 31-32 k levels
according to the market conditions 22 k level is also very likely because there's a cme gap and btc inflows from wallets to exchanges are rising !
happy trading !

1D - APRIL 3 MOVING AVERAGES
100 and 200 are far below so there is room for price to be pulled down towards them.
Color coded 50 and 15
15 sma and 50 sma are green and moved up but there is a resistance at $29k. This may be the reversal point.
DAY- CHART PATTERNS AND TREND LINES
Up sloping support and resistance.
DAY - DIVERGENCES
A bearish divergence. It looks like we may have one more short move up and head down.
DAY - RSI, STOCHASTIC AND VOLUME
For the update on these indicators watch my video update.

Down, up to 35.k in weeks ahead,& down again-$BTC Chart AnalysisIt looks like we received the pump we have on Bitcoin for a number of reasons- but the two most obvious to me is that 1) the price traded sideways outside of a channel, and 2), the 786 fib level of the overall move of the price was touched.
Now that we are where we are, we can observe the previous price levels above that have been tested, and the only one that hasn't been so far is the 35k range. Coincidentally, this range lines perfectly with the inverse 618 fibonacci level, and just below it, so does the 50% fibonacci level with yet another untested price range.
I am seeing this same pattern amongst all the alt coins, and even in the COIN stock itself. It seems if this is the move, and we've got quite a bit of confluence to back up this theory. That said, I expect a cool off for the next couple of weeks, another push upward to our targets for some weeks, and then downward before summer.. sooner rather than later, for sure.

Bitcoin bullish?! MaybeWeekly chart show some bullish signal that market trend will change before new year.
#chart #bitcoin #trade

USOIL TodayPlease note,
pay attention to the decision to raise interest rates and the decisions of the Federal Central Bank, as well as news and wars, and also pay attention to your capital when you trade

BITCOIN long term technical analysis Two important trend lines, you can see on my chart, what I think is we're gonna see more of bearish market!
I believe we're gonna test the 17000-17500 soon enough.


Bitcoin in Daily timeBitcoin has been in a bearish flag for weeks, which continues to react well to its limits. Also, the blue ranges are very important in supply and demand, and the price has had many reactions in these ranges.


Bitcoin price can sideway or...Hello cryptofolks
Market is full of FUD is hard to determinant wich direction will take
The sure thing is any pump over $30k can be a bull trap
Bears have full control, any support can turns into a new resistance
Be careful
-Goodluck
