Bitcoin-dominance

BTC.D - Exit the distribution zone I noticed that many altokines are ready to grow faster than bitcoin. Dash ZEC WAVES and many others showed excellent growth on this wave.
The dominance of bitcoins continues to decline.
Trend is broken (marked with a blue line)
EMAs indicate a continued downward trend.
you need to look at this indicator.
when the dominance looks weak. the altocoins look strong.
Friends, thanks for your likes and comments!
Good luck with trading!

LONG TESLATHE ENTIRE STOCK MARKET IS ABOUT TO PUMP. I dont know if its going to be a dead cat bounce or have continuation. Its a good idea to reanalyze the situation when the INDEXES start to show weakness in automotive and energy sectors. I think this is going to coincide with a crypto pump to be had tomorrow. Like I mentioned before. I think the goal here is to make is appear as though there is a correlation between legacy markets and digital assets. We will just have to watch this in the following days.
God Speed

DANGER ZONESomething feels really wrong here.. Fundamentals would tell you this looks incredibly bullish but to be honest there is alot going on here and I may get on to make a youtube video about it soon. That being said... I hope I am wrong. We need to pump up above 10G birds and FAST to be on the safe side.
God Speed

Alt Season Is Over?For all of you who are keeping alts and hoping they pop back up, please be aware of this chart.
It's extremely likely at this stage that at the minimum few weeks BTC Dominance will be on the rise.
Watch the yellow trendline and the 140 MA on the 3D chart - if they both get broken - then perhaps we are in for a major alt season as BTC Dominace makes its way down to the 50% level.

BTC.D / Cross or Kiss?So BTC dominance is entering a critical time zone. Check the 50 and 200 wma's meeting into the halving. Get ready for the race!
My boy thinks they'll kiss but miss. What do you think?

Bitcoin Dominance - Continues To Drop...How Low Can We Go...Got that warm feeling inside yet? Holding altcoins and they are going up in value?
It's a nice feeling, right? Feels good to know that direction is affected by how the market is doing.
One main element of this is knowing that Bitcoin dominance is coming down.

BTC.D >> Bitcoin Dominance targets in 2020-2021Hi everyone,
I believe this space (cryptoland) is becoming very interesting as dominance slowly is shifting away from Bitcoin into some major alts whose projects have excellent execution and increasing/promising use cases as time progresses. Bitcoin continues to be a great store of value yet some alts are beginning to steal the show. It is my conviction that Bitcoin dominance is in a multi-year ABC correction (beginning 2017) having completed the A wave in 2018 & B wave (relief bounce) in 2019 & has begun the C wave a number of weeks ago.
Important note: With bitcoin dominance generally being in a downtrend over the coming year or two, this does NOT mean at all that the Bitcoin price won't appreciate. On the contrary: As its market cap dominance decreases, Bitcoin will continue to increase in price and adoption. It is a common misconception that Bitcoin price is positively correlated dominance needs to increase in order . Truth is: the correlation is very low.
Anyway, back to the chart: we present 4 targets for Bitcoin dominance which we think will play out in 2020-2021. Breaking the 50-53% level triggers another roaring alt season, not unlike the one of EOY 2017. By that time, Bitcoin would have likely surpassed $20k (its previous ATH) and so investors and traders would begin diversifying their bitcoin gains heavily into the Altcoins.
The targets presented are very technical, actually, based on multiple Fibonacci retracement analyses. We believe the end of the C wave would show an ATL Bitcoin dominance of 25%. AT that point, you can be almost sure that the bull cycle has ended and cryptoland is entering another multi-year winter (bear market).
Cheers,
Leb Crypto

ALT SEASON IS HERE - YOUR WINDOW OF OPPORTUNITY Looks like at season is here.
Unless you stacked up on alts when I posted this analysis back in December:
Most likely in the next few days there will be a small retracement (most likely BTC will dump 5-10% to help with this) and this would be your best moment to buy some alts!
If interested here is a list of alts I am thinking about getting for myself in this alt season: ETH, LINK, KNC, WAVES, HOT, BCH, XTZ, ATOM, MKR, BAT, ICX, REP, ZRX, SNX, THETA, ZIL, RLC, NRG and other...
** NOT FINANCIAL ADVICE ** of course ;)

bitcoin dominance - correlation or total nonsense?im just poking and hoping here, but that 10th feb sure looks interesting for the corn...

29b$ since my idea!(the reason i shared BTCUSD chart is that people look at these idea rather than TOTAL2 or BTC.D, sorry for that!)
in my idea :
i pointed out a time resistance that may be mark the beginning of trend reversal. these time resistances proofed to be right if you put them in a right way.
ok now alts are booming and it's sitting at 87b$ and up almost 29b$ (Wow!!) from where i pointed out a reversal.
people just dont pay attention i called the bottom on bitcoin in this analysis:
i predicted the bottom with 100$ tolerance. i said it would be in 3320$ but it bottomed at 3215$. so far so good, people should see these things. i'm helping you people with nothing in return!
ok go back to analysis:
as you can see here in this picture :
we are almost above 38.2% fib level since last top to last bottom it is a positive sign. is think it means we are headed to test 61.8% which is a psychological and even number, 100B $ it would be the first stop for altcoins(i think).
looking at BTC.D :
it seems we are breaking down at bitcoin dominance.
so what now?
in a simple word if bitcoin dominance continues to dump and if TOTAL2 continues to rise i think buying altcoin even at this point would be a good idea to look at alt market i would like to look at majors and take a look at bitcoin comparative charts.
here we have ETHBTC chart:
ETHBTC still bearish as it is below 0.02309902 so above that level it is reasonable to change bitcoin to ethereum. but i thing the bottom is in for ETH and we will see price appretiation.
in this chart :
XRP need to break 3770 satoshi level to be bullish on so wait for that to happen even if you trade USD pair. i think btc pair is important to be bullish.
Litecoin:

Possible Bounce (BEWARE)Nice pump we had in the Alts and I certainly made out well however this is a MAJOR significant level if we zoom out to the weekly. So we need to watch everything at this point to see what happens when BTC starts to pump off of this consolidation.
God Speed,
Mr. Lucifer

Dominance: Big chance for Bitcoin Kids?! 👶Bitcoin Dominance is breaking symmetrical triangle and heading towards my H&S target which I explained in previous idea:

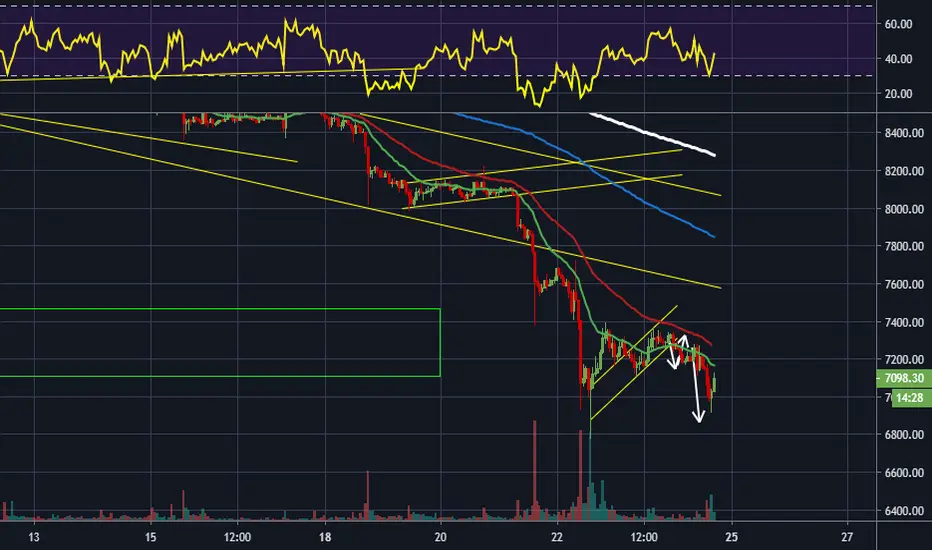
SHORT DOMIts been lagging for two weeks now but it looks like it finally flagged out as I stated in my previous video on youtube if you'd like to check. I thought this would happen much sooner but the fact that it has taken this long for a flag to show itself on the daily rather than the 4hr makes the RSI cool off even more than I previously thought making the likelihood that its gonna blow the bottom of the weekly channel trend-line. Might be a good idea to add more to my existing speculative trades.
God Speed,
Mr. Lucifer

Bitcoin Dominance Bounce back from Support#BTC Dominance Update:
#bitcoin Dominance Exactly Bounce Back from our Support 66.29% and Now 68%.
If hold 68% then next 70%. ( #Altcoins more dump)
so keep an eye on every update.
Please like follow and Share
Thank you for appreciating

Bitcoin Has Lost Dominance, But Only TemporarilyHello traders! Today we will talk about Bitcoin, its dominance and ALTcoins.
For the beginning we want to point out that most of cryptocurrencies, even some of ALTs nicely and strongly recovered in the start of 2020, which can be easily a signal for the bottom and a reversal into a bullish mode again, but only against the USD pairs (XXX/USD).
However, as you can see, the major Crypto BTCUSD is not so strong. It's actually rising, but in a much slower pace than some of ALTs and that's what we are going to talk about today.
It's all about dominance in the Crypto market, sometimes BTC is the leader, sometimes ALTs and this can be clearly seen in the BTC dominance chart, which is telling us where XXX/BTC cross pairs can be headed, but of course not all of them. So, we want to to show you how this look like from Elliott Wave perspective.
In the first chart above we can see that BTC is losing dominance since September of 2019, but according to the EW corrective a-b-c structure, this may come to an end soon. We are tracking a regular flat correction in wave 4, so seems like the final move up for wave 5 is still missing.
If we take a look at the examples below, ETHBTC can be also trading in a corrective a-b-c-d-e triangle pattern, so once BTC dominance returns, and once it fully completes a bearish triangle, this is when we can expect a break into new lows for the final wave 5.
It's very similar with EOSBTC, the only difference is that EOS is currently stronger than ETH, which means that EOS made a bigger recovery against the BTC, but it also looks an a-b-c corrective rally in wave 4, especially because of a triangle in wave »b«, so don't be surprised if EOSBTC faces limited upside around the 0.00048 resistance area.
All what we want to say is that yes, most of Cryptos is turning bullish, but be very careful with cross pairs against the BTC (XXX/BTC), because most of these ones may not have reached the bottom yet, especially those which are still trading near the lows like ETHBTC and EOSBTC, while the other ones that made a bigger recovery, may just face a deeper corrective decline.
Be humble and trade smart!
If you like what we do, then please like and share the idea.
Disclosure: Please be informed that information we provide is NOT a trading recommendation or investment advice. All of our work is for educational purposes only.

Bitcoin Dominance update (based on previous EWT)First of all, before you read this analysis, please read the previous analysis about bitcoin dominance on the related idea to help you understand more about it
Hello fellas, welcome back to the bitcoin dominance update. we have seen some manipulation has occured in the past few days, especially when we saw the price surged from $6500 region to roughly $7500 region. This $1000 movement occured only in 10 hours. Some analysts might think that the bearish market structure has ended and the bottom's already in. But, I really think that the the price is even far from the bottom for now.
Just look at the chart, I've modified the levels on the chart and the fibonacci retracement method that I'm using comparing my last analysis. I use the body to body connecting method on weekly chart to measure the fibonacci retracement levels because I think this condition can give me more confluence reasons and of course excluding the trap region which are the wick on the higher time frame can give us more conservative view on this chart.
Based on the elliot wave prespective, the dominance level has spiked up exactly after I gave my last analysis. it's currently at 70% levels and this region is however becoming a strong resistance for bitcoin dominance. This 70% level is the area of broken support that is now become resistance. Beside this, this is a golden pocket zone.
We've seen the first rejection of current resistance level and there is a potential of ABC pattern too. So, it may be the top of bitcoin dominance right now. And if I wrong about this, I see the 71% as the maximum region for the dominance to top.

NANOBTCAs of now the bias across the board on ALTBTC pairs is bullish and is indicated on the most recent video on youtube (youtu.be). As of now a new weekly candle is going to be starting which will determine the probabilities for making either a short or long trade. As of now there is no obvious long positions that have a favorable RR ratio for futures account however my bias is long to the point of initial divergence which is one of my rules indicated on the chart. If the week starts on a bearish note that only means that it is saving its RSI strength for the end of the week much like it does on the 1&4hr charts on MANY different pairs. We must just apply the same market theories that we see manifested regularly on the higher time frames and apply them to the daily and weekly charts. This is why its important to know how and where things start relative to previous price action to be able to map the markets as indicated here. That being said I dont see am immediate obvious futures trade but would hold the "physical" just in case the dominance is indeed ready to take a dump. Its going to be an interested next couple of weeks in the alt market if my bias is vindicated. Check back in several days and comment to see if the bias was correct and how accurate the mapping was.
God Speed Gents,
Mr. Manbearpig

Bitcoin Dominance | Reversal StructureDominance showing pattern which can be recognised as Head and Shoulders.
Projected target from neckline should be near 63-60% dominance. Projected period for decrease until March of 2020, with peak bottom at February 2020.
Also targets match retracement levels of Fibonacci.
Finally, Shitcoins Time?!

EOSBTC SHORTThis is a hedge against altbtc longs. The daily chart on the dominance is ending with higher lows however there is still some indication that might be over on the 4hr chart.
God Speed,
Mr. Manbearpig

Bitcoin Dominance. Going Up Again... More Alts To Perish?It's a rough one if your holding majority alt-coins. Certainly not the time to do so if you are in a mess to look at your BTC value in your wallets.
It will come down eventually...

Bitcoin Dominance Support LevelsLets whatch where it'll stop. 60% is the key support which could show the long term trend.