Tesla analysisTesla market analysis is simple but effective
We wish you a successful trading week and always remember how to manage your capital and create your own strategy
Bitcoin-gold

SHIBusdt 4H Dynamic and Static support In the 4-hour time frame, we are in the important range of static support and trend line support, which we expect the price to increase after the support, otherwise the declines will continue.
Its not Buy or Sell SIGNAL
DYOR
BY : M.TeriZ - @AtonicShark

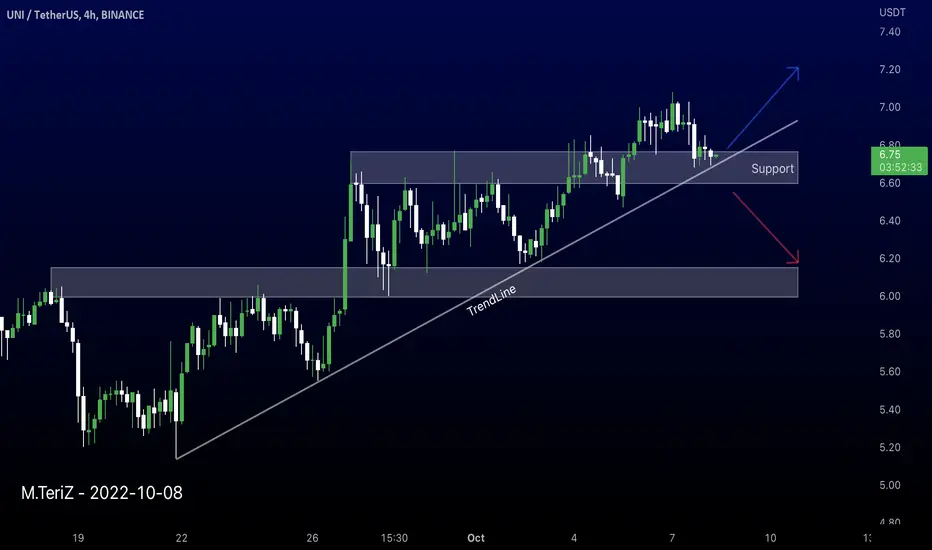
UNIusdt 4H TrendLine support According to the trend line, we expect the price to increase from the specified level, otherwise, the fall will become stronger with the failure of the support zone.
Its not Buy or Sell SIGNAL
DYOR
BY : M.TeriZ - @AtonicShark
ETHEREUM 4H S&R zones I specified the support and resistance range in the chart.
Its not Buy or Sell SIGNAL
DYOR
BY : M.TeriZ - @AtonicShark

BITCOIN 1H support & resistance In the 1-hour time frame, I specified the support and resistance range in the chart.
Its not Buy or Sell SIGNAL
DYOR
BY : M.TeriZ - @AtonicShark

CHZusdt 3D Triangle patternBy checking the chart, we can see the triangle pattern, if the price supports the upward trend line, it will be broken, otherwise we expect correction.
Its not Buy or Sell SIGNAL
DYOR
BY : M.TeriZ - @AtonicShark

BNBusdt 4H ascending channelWe can see the ascending channel in the 4-hour time frame, if the bottom of the channel is supported, we expect to rise to the top of the channel.
Its not Buy or Sell SIGNAL
DYOR
BY : M.TeriZ - @AtonicShark

ETHEREUM 12H TrendLine Scenarios As we can see in the chart, I specified the possible scenarios according to the trend line.
Its not Buy or Sell SIGNAL
DYOR
BY : M.TeriZ - @AtonicShark

SHIBusdt 6H Downward Channel We see the descending channel in the 6-hour time frame, and if it is unable to break the upward channel, we expect it to fall to the bottom of the channel.
Its not Buy or Sell SIGNAL
DYOR
BY : M.TeriZ - @AtonicShark

$DXY US Dollar has more room to grow
US Dollar has more room to grow..
Looks like U.S Dollar index heading toward the 2000-2002 record (119$)
How does this affect the Bitcoin/Gold price? See my previous idea

ETHusdt 12H testing Support Zone Due to the price chart, the support area is testing that we will lose more with losing this area, and of course the uptrend line has been broken.
Its not Buy or Sell SIGNAL
DYOR
BY : M.TeriZ - @AtonicShark

AHHHH PLEASEE EXPLAIN?? Never seen anything like this charting.... Any explanations or answers please.

Bitcoin Gold `` RR/4.8xLooking forward to price bouncing from trendline.
If it however breaks it, set-up will/should be reviewed.

ETHEREUM 3D TA: in the channelWell, in the 3D time frame, as we see in the chart, the price is on the descending channel, which is now approaching the channel ceiling, and if this important range is broken up. So now we expect to fall after this area, and when this channel is broken, the analysis will be updated.
Its not Buy or Sell SIGNAL
DYOR
BY : M.TeriZ - @AtonicShark

BITCOIN SCALP BUY NOW!Hi Team
Analysis to follow in comments - Scalp buy for Bitcoin right now, don't want you to miss it!
Good Luck, Trade safe
DrBear

DOGEUSDT Can Bullish again?I specified the possible scenarios according to the trend line and support points. If the support range of the trend line and static price support is lost, a falling trend will be formed and we will have a valley lower than the previous one.
Its not Buy or Sell SIGNAL
DYOR
BY : Mohamad Teriz - @AtonicShark

ETCUSDT 1H TA; Resistance Zones According to the chart, in the one-hour time frame, we see the reaction on the trend line, which has caused the price to rise to the resistance ranges. I specified the resistance areas in the chart, and if the trend line breaks below $30, the analysis will be updated.
Its not Buy or Sell SIGNAL
DYOR
BY : Mohamad Teriz - @AtonicShark

ETHEREUM New Support; 6HAccording to the previous analysis, Ethereum broke the resistance range of $1,450 again with the pump, and now it is forming a pullback from the broken resistance, which is suitable for entry if the pullback is completed, otherwise, if it loses the trend line and support of the price stake It will be corrected.
Its not Buy or Sell SIGNAL
DYOR
BY : Mohamad Teriz - @AtonicShark


AVAUSDT 6H TA: Can Pump Again?Due to the chart, after reaching the support range, pump 80% avausdt, candle has reached the resistance area again, if the range is broken, it will be pumped again and otherwise it will be corrected, suggesting that Enter if the resistance is successfully broken.
Its not Buy or Sell SIGNAL
DYOR
BY : Mohamad Teriz - @AtonicShark

BTC/GOLD ratio Bitcoin will start to heavily outperform GoldWe looked into this correlation 3 weeks ago with the following analysis but on the reverse ratio of GOLD/BTC:
As you see that was right when the ratio tested the 7 year Lower Highs trend-line and the rejection so far is confirming our bias, which are sell Gold and buy Bitcoin for the next couple years. Gold's 4 straight week sell-off is basically sending a signal to the whole market.
Now back to this study, we view the ratio as BTC/GOLD to put it into a longer-term perspective. We are in the exact same bottom level the price was in December 2019 and January 2015. A conversion of some Gold wealth into BTCUSD for the next 2 years is highly recommended.
--------------------------------------------------------------------------------------------------------
Please like, subscribe and share your ideas and charts with the community!
--------------------------------------------------------------------------------------------------------

XAUUSD 1h TA : Another Bull Run?Low blue demand range is not consumed and the price can be expected to reach that...
Follow us for more analysis & Feel free to ask any questions you have, we are here to help.
⚠️ This Analysis will be updated ...
👤 Arman Shaban : @AtlasTED_5days
📅 06.28.2022
⚠️(DYOR)
❤️ If you apperciate my work , Please like and comment , It Keeps me motivated to do better ❤️

BNBUSDT 6H TA: TrendLineBNBUSDT After the fall of the market to the $ 185 area, we have a positive reaction and we are growing and reaching the resistance of the trend line in the range of $ 260, which if this line fails, we will increase the price to $ 300.
It is recommended to buy if trend line break and it is confirmed.
Its not Buy or Sell SIGNAL
DYOR
BY : Mohamad Teriz - @AtonicShark
