I recommend to sell AVAX #CRYPTOMy future view is that it will go down I recommend selling from the entry area and not buying above it because I have traveled through time and heard that it has gone down
Bitcoin-gold

Eth/Usdt 1H 22.03.22Hello everyone, if you like the idea, do not forget to support with a like and follow.
Eth/Usdt
long 13x short 13x 😉
Entry Price : 3000
Short :
T1 : 2808 %83
T2 : 2669 %143
Long :
T1 : 3205 %87
T2 : 3344 %149
📅 22.03.22
📌

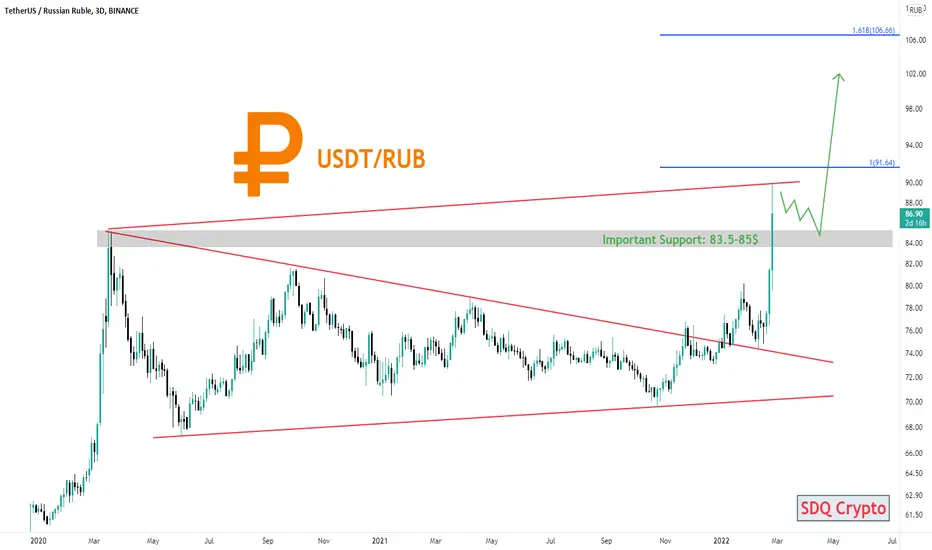
RUBLE (USDTRUB) TA: 22.2.24The ruble has broken the resistance zone of 83.5-85$ and has reached the price top of the channel. The 90$ range is the resistance of this currency, in case of failure of which the goals drawn in the chart can be seen
⚠️ This Analysis will be updated ...
👤 Sadegh Ahmadi: @SDQ_Crypto
📅 24.Feb.22
⚠️(DYOR)
❤️ If you apperciate my work , Please like and comment , It Keeps me motivated to do better
BTC/USDT TA: 22.3.7Bitcoin is moving in the downtrend channel, the bottom of which is the 37000-37500 static support. If the support is broken, the next supports are marked on the chart.
Bitcoin needs to break the 45000$ level and stabilize above this area to start the uptrend.
⚠️ This Analysis will be updated ...
👤 Sadegh Ahmadi: @SDQ_Crypto
📅 7.Mar.22
⚠️(DYOR)
❤️ If you apperciate my work , Please LIKE and COMMENT , It Keeps me motivated to do better❤️

BTC/USDT TA: 22.3.6Bitcoin failed to stabilize above this level after breaking the resistance of 39800 to 40500.
According to news from China and Taiwan, as well as the Fed meeting and the possibility of raising interest rates to 0.5%, buyers are cautious.
There are still no signs of smart money coming in.
According to these notes i think bitcoin can move to 29-30K.
⚠️ This Analysis will be updated ...
👤 Sadegh Ahmadi: @SDQ_Crypto
📅 6.Mar.22
⚠️(DYOR)
❤️ If you apperciate my work , Please LIKE and COMMENT , It Keeps me motivated to do better❤️

SHIBA can break downward trend or No?After reaching the important support range, it moved towards the trend line and reacted downwards. If this trend line is broken upwards, an uptrend will be formed. In case of failure and loss of support range, the analysis will be updated.
Its not Buy or Sell SIGNAL
DYOR
BY: Mohamad Teriz - @AtonicShark


BTC / XAU / DXY all up. Too good to be true?Please watch video for analysis.
Quick run through:
1. Over all crypto market cap sits at $2.05 trillion - up 14.1% over the last day.
2.Yet BTC dominance sits at 44% approx
3. DXY has gone up as well
BTC's move seems too impulsive to me. Even with Russia adopting cryptocurrency one needs to understand as a country Russia is not going to get into the BTC game at $44k. They will buy cheap.
This is just my opinion. Please DYOR. Trade safe and keep tight SLs in place. Market is to volatile!

Bitcoin REACHED TO $ 44,000 . 🚀 (Update)Bitcoin REACHED TO $ 44,000 . 🚀
We saw that the price exactly according to the previous analysis, managed to break its resistance level in 41K zone and reached to $ 44,000 target ✅. (This analysis will be updated after consolidation.) Note that the price has reached the most important Bearish Order Blocks.
Follow us for more analysis & Feel free to ask any questions you have, we are here to help.
⚠️ This Analysis will be updated ...
👤 Arman Shaban : @ArmanShabanTrading
📅01.March.22
⚠️(DYOR)
❤️ If you apperciate my work , Please like and comment , It Keeps me motivated to do better ❤️

BITCOIN THE WARRIORDue to the confliction between Ukraine and Russia , I decided to look back in to the history , and see what happened to Bitcoin , Gold and SPX when we had war or confliction.
Here is the list of the wars that I mentioned in the chart : ( I understand of the ongoing wars and some other I did not mentioned ! )
1 . Iran shoots down US drone aircraft
2 . Iranian General Assassinated
3 . Operation Martyr Soleimani
4 . Nagorno-Karabakh war
5 . Tigray War
6 . Fall of Kabul
According to my studies all of the war news has been bullish for the 3 assets ! (Except for one time for gold on Tigray War which can be ignored. )
Just to be said , this would be far different if we get in to a world war !
The question is : in case of starting a war between Russia and Ukraine , what would happen to cryptocurrencies ?
As a technical analyst , we always look backward and see what happened in history , then we get some information and that's where analysis starts !
So , we can say BTC and Gold are safe assets during the war , and also SPX ( focus on arms stock! they are to sell weapons ! ) Its just the same for fuel carriers and oil!
Be aware , this is not financial advise , It's just a study of what happened in the history and there is no guarantee for now.

ETH Short position 22.2.26ETH is on its resistance level and in case of breaking the trend line and pullback to this area, the short position is activated.
⚠️ This Analysis will be updated ...
👤 Sadegh Ahmadi: @SDQ_Crypto
📅 26.Feb.22
⚠️(DYOR)
❤️ If you apperciate my work , Please like and comment , It Keeps me motivated to do better

Dogecoin reversal zone 22.2.27Doge is on a downward trend. Important supports that the price can respond to are outlined in the chart. The uptrend will begin after the downtrend breaks.
⚠️ This Analysis will be updated ...
👤 Sadegh Ahmadi: @SDQ_Crypto
📅 27.Feb.22
⚠️(DYOR)
❤️ If you apperciate my work , Please like and comment , It Keeps me motivated to do better

Quantitative easing - inflation of the economyMany people simply do not understand economics; and why should they - it's Foooooking complex.
I hear and read, all the time. Bitcoin solves inflation - without any real sound logic as to why or how...
When you travel back in time, the monetary systems have changed and evolved but are moving further and further away from the "gold" standard. Now as a crypto maxi, you might see this as a good thing. However, it also has it's drawdowns. The reason Gold and silver has been used for thousands of years is that it cannot be made and holds a rare earth material (Value) this is not as simple as saying "a store of value" and this I feel is where the confusion comes in.
So let's explain how the governments use quantitative easing to cheat the public.
In simple terms this is a policy in which the central bank's try to increase the liquidity in its financial system, in order to inject money into the economy to expand economic activity. Or so we are told.
If you look at this chart going back to 1965.
You will see the QE levels of rapid supply of money - with nothing under pinning it. This is where the Gold standard is lost. However, the story does not end there for Gold & Silver.
Take a look at this;
This is the Qualitative economic impact of the quantitative easing. This shows, the asset price increases and then falls off a cliff. All whilst the Money (paper money) flattens out. So with the injection into the economy (wink wink) the demand increases, the price increases and with a slight of hand - we have more borrowed dollars, less tangible assets to support it.
This isn't just a US problem, nor a European issue - it's a global, corrupt government issue. This is why the rich get richer and the poor get poorer.
Take a look at countries such as Australia;
These curves are parabolic.
How's about Russia - could get even worse after this war;
In summary it can help an economy out of recession, but it can drive an economy to recessions also.
So why or how does Gold and Silver fit in? Well, as the value of money (cash) drops down, spending power is robbed, pensions depleted and costs sky rocket. The Dollars in circulation can buy less "store of value assets" - thus driving the price of said assets up. This is where many people get confused with the adoption of Bitcoin. They assume that with Bitcoin being decentralised (kinda) - you have to remember the rules and regulations imposed on money in and out of the system (KYC & AML) - on an immutable ledger; this is optimal for taxation, identification and traceability by the way. The main issue is the store of value is only driven by what's in circulation, how much demand and how accessible the supply. It is already stated that 91% of all of the BTC in existence is in the hands of the Elite. The value per coin is only the supply vs demand battle, it's similarities to gold means it can be lost, stolen or stored.
But it's the underpinning method the governments use to increase the value of gold - that makes it likely to remain "THE WAY" for the foreseeable future. If I am honest I see Bitcoin or another crypto taking over the cash/payment system - more than I see it as a digital gold.
Anyways - have a great weekend, I thought this would be an interesting topic for discussion.
Disclaimer
This idea does not constitute as financial advice. It is for educational purposes only, our principle trader has over 20 years’ experience in stocks, ETF’s, and Forex. Hence each trade setup might have different hold times, entry or exit conditions, and will vary from the post/idea shared here. You can use the information from this post to make your own trading plan for the instrument discussed. Trading carries a risk; a high percentage of retail traders lose money. Please keep this in mind when entering any trade. Stay safe.

This is big!!Maybe bitcoin is going to save us, this is the first time that we have cryptos in war time, is this a safe haven?

Bitcoin Double Bottom? TA: 22.2.23Bitcoin is back below the downtrend and there are signs of weakness in the movement. Bitcoin can retest 36500 support. The important point is that if the movement towards 36,500 is slow, it may form a double bottom, but if the movement is sharp, it may lose 36,500 support.
⚠️ This Analysis will be updated ...
👤 Sadegh Ahmadi: @SDQ_Crypto
📅 23.Feb.22
⚠️(DYOR)
❤️ If you apperciate my work , Please like and comment , It Keeps me motivated to do better

Ethereum (ETHUSDT) TA: 22.2.23As long as ETH is below 2750 resistance and inside the downtrend channel could reach 2300, 2,000 and 1,800 support. If the resistances are broken and their high price stabilizes, targets of 3300 and above will be activated.
⚠️ This Analysis will be updated ...
👤 Sadegh Ahmadi: @SDQ_Crypto
📅 23.Feb.22
⚠️(DYOR)
❤️ If you apperciate my work , Please like and comment , It Keeps me motivated to do better

Poligan (MATICUSDT) TA: 22.2.22Poligan is facing 1.05$ support in its downtrend. To start moving up, it is necessary to break and stabilize above the 1.75$ level
⚠️ This Analysis will be updated ...
👤 Sadegh Ahmadi: @SDQ_Crypto
📅 22.Feb.22
⚠️(DYOR)
❤️ If you apperciate my work , Please like and comment , It Keeps me motivated to do better

Solana (SOLUSDT) TA: 22.2.21Solana is above of 80-83$ support. Major support is in the range of 56-66$
⚠️ This Analysis will be updated ...
👤 Sadegh Ahmadi: @SDQ_Crypto
📅 21.Feb.22
⚠️(DYOR)
❤️ If you apperciate my work , Please like and comment , It Keeps me motivated to do better

BTCUSDT 1D TA : Next SUPPORTSAt the moment, with the loss of an important support range, the downtrend strategy has strengthened and I have specified the next support ranges in the chart that if supported, we can wait for the climb.
Its not Buy or Sell SIGNAL
DYOR
@AtonicShark

fundamental analysis Come together, let's think out loud
Now the 3 main markets are moving Asian ; European and American
Today and until now, these 3 markets have bought gold
And not at the expense of the dollar.. So the connection between the 3 markets is loose
Each market will deal in its own currency
Here, we will divide into two parts
currencies and gold
1- As for currencies, you need to focus on the currencies of each market and forget about the dollar a little
. I mean, Asian From 10 pm to 7 am GMT , you can trade an AUD , NZD ,JPY trade on them
. European From 8 am to 5 pm GMT , you can trade GBP , EUR and CHF trade on them
. American From 1 pm to 10 pm has a dollar you can trade it , and it is very difficult right now
2- gold Every market of them bought gold, and this means that every market has liquidity in gold and is able to move the gold price up and down according to the time of the market and its policy on gold .
I mean, for example, the Asian bought gold, therefore its price increased, so the price of gold reached the European period high
Here, Europe will decide its policy: if it will buy gold, the price will continue to rise, but if
it will sell, the price of gold will go down and delivered to the American market
Who will decide whether to fix the price, go up, or drop the price?
And hand it over to the Asian..and so on until the geopolitical matters became clear
What are you doing,, in these events? Work on the market according to its timing and secure your positions on the market as soon as the period of the market you are working on ends, because it is not a condition that the markets will walk at the same pace as today
Remember every market has strong liquidity, meaning
If you bought in the Asian market time and earned either you exit with your gains or put your stop loss at the entry and wait for the European policy , I know my words are difficult but I try to be with everyone
But I hope everyone will benefit

ETHUSDT 1D TA : NEXT TargetsETHUSDT In daily timeframe, with the defeat of the first trend line, it is advancing towards the targets. In case of reaction on the second trend line, the possibility of falling to the support range is not far from expectation. Of course, the reverse head and shoulder pattern can be the second sign of climbing in the chart.
Its not Buy or Sell SIGNAL
DYOR
@AtonicShark

10 Year Rate: Price keeps moving up!Quick Analysis on 10 Year Treasury Yield on a 1D Linear Chart.
1) The US 10 Year Treasury Yield has been respecting a falling channel for multiple decades going back to the 1980s.
2) It has broken out of the top trendline of the falling channel with a recent re-test of the S/R line.
3) The measured move of the falling channel would bring it back to Pre-2008 ranges (LONG-TERM). The measured move is noted.
4) There was a Bull Flag Pattern forming on the charts within the falling channel pattern, which helped the price move higher. The measured move for the SHORT-TERM is noted.
5) I discussed this breakout in the first week of December 2021 when the price was still at around 1.40ish. PAY ATTENTION!
What are your opinions on this?
If you enjoy my ideas, feel free to like it and drop in a comment. I love reading your comments below.
Disclosure: This is just my opinion and not any type of financial advice. I enjoy charting and discussing technical analysis. Don't trade based on my advice. Do your own research! #cryptopickk

Potential troubles for bitcoin? Looks like the gold keeper's wil get a better price for a bitcoin soon. 2 for 1 inbound?
