#BTC #BTCUSD #BTCUSDT #BITCOIN #SHORT & #LONG #Setups #Eddy#BTC #BTCUSD #BTCUSDT #BITCOIN #SHORT & #LONG #Setups #Eddy
BTCUSDT.P Short & Long Setups with Entry Points.
This Setups is based on a combination of different styles, including the volume,ict & Price Action Classic.
Based on your strategy and style, get the necessary confirmations for this short & long setups to enter the trade.
Don't forget risk and capital management.
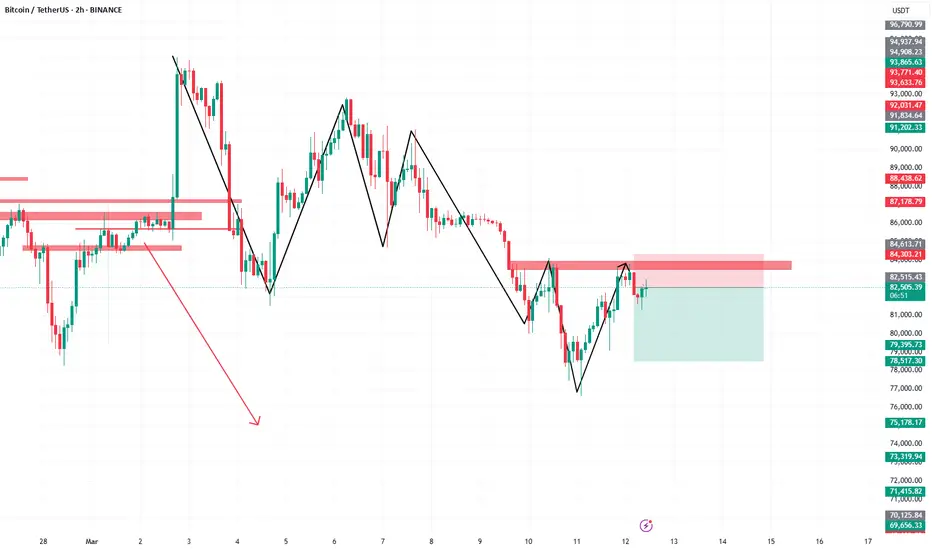
🔴 Short Entry : 86000 (( Already Activated ))
⚪️ SL : Available on chart
⚫️ TP1 : 75000
⚫️ TP2 : 70000
⚫️ TP3 : 62000
🟢 Long Entry : 61845.8
⚪️ SL : Available on chart
⚫️ TP1 : 250000
⚫️ TP2 : 500000
⚫️ TP3 : 999000
‼️ Futures Trading Suggested Leverages : 3-5-7
The World Let it be Remembered...
Dr. #Eddy Sunshine
4/13/2025
Be successful and profitable.
Please see my previous analysis on Bitcoin and proceed based on the second scenario.
My previous analysis on Bitcoin :
I also invite you to check my analysis on the Total 3 chart and proceed accordingly, and after it happens on the altcoins, enter swing long trades with the necessary confirmations.
My analysis of the Total 3 chart:
👆 Based on the analysis provided on the Total 3 chart, proceed and wait for another bearish lag for the Total 3 chart to reach the specified area. The divergence on the upper timeframe is most likely a market maker trap and the current bullish move is a fake. In my opinion, the main bullish move will begin after another 30-45% correction on altcoins and the Total 3 chart reaching the specified area and the orange POC line.
Bitcoin-short

BITCOIN BEARS ARE STRONG HERE|SHORT
BITCOIN SIGNAL
Trade Direction: short
Entry Level: 83,826.61
Target Level: 79,330.33
Stop Loss: 86,817.52
RISK PROFILE
Risk level: medium
Suggested risk: 1%
Timeframe: 3h
Disclosure: I am part of Trade Nation's Influencer program and receive a monthly fee for using their TradingView charts in my analysis.
✅LIKE AND COMMENT MY IDEAS✅

BITCOIN Is Very Bearish! Short!
Here is our detailed technical review for BITCOIN.
Time Frame: 12h
Current Trend: Bearish
Sentiment: Overbought (based on 7-period RSI)
Forecast: Bearish
The market is trading around a solid horizontal structure 82,277.86.
The above observations make me that the market will inevitably achieve 75,083.32 level.
P.S
We determine oversold/overbought condition with RSI indicator.
When it drops below 30 - the market is considered to be oversold.
When it bounces above 70 - the market is considered to be overbought.
Disclosure: I am part of Trade Nation's Influencer program and receive a monthly fee for using their TradingView charts in my analysis.
Like and subscribe and comment my ideas if you enjoy them!

BITCOIN BEST PLACE TO SELL FROM|SHORT
BITCOIN SIGNAL
Trade Direction: short
Entry Level: 81,548.46
Target Level: 78,143.52
Stop Loss: 83,839.84
RISK PROFILE
Risk level: medium
Suggested risk: 1%
Timeframe: 3h
Disclosure: I am part of Trade Nation's Influencer program and receive a monthly fee for using their TradingView charts in my analysis.
✅LIKE AND COMMENT MY IDEAS✅

BITCOIN Will Move Lower! Sell!
Take a look at our analysis for BITCOIN.
Time Frame: 30m
Current Trend: Bearish
Sentiment: Overbought (based on 7-period RSI)
Forecast: Bearish
The market is testing a major horizontal structure 79,880.44.
Taking into consideration the structure & trend analysis, I believe that the market will reach 78,453.18 level soon.
P.S
The term oversold refers to a condition where an asset has traded lower in price and has the potential for a price bounce.
Overbought refers to market scenarios where the instrument is traded considerably higher than its fair value. Overvaluation is caused by market sentiments when there is positive news.
Disclosure: I am part of Trade Nation's Influencer program and receive a monthly fee for using their TradingView charts in my analysis.
Like and subscribe and comment my ideas if you enjoy them!

BITCOIN SHORT FROM RESISTANCE
BITCOIN SIGNAL
Trade Direction: short
Entry Level: 84,003.04
Target Level: 81,357.30
Stop Loss: 85,763.63
RISK PROFILE
Risk level: medium
Suggested risk: 1%
Timeframe: 1h
Disclosure: I am part of Trade Nation's Influencer program and receive a monthly fee for using their TradingView charts in my analysis.
✅LIKE AND COMMENT MY IDEAS✅

BITCOIN Will Go Lower! Sell!
Take a look at our analysis for BITCOIN.
Time Frame: 6h
Current Trend: Bearish
Sentiment: Overbought (based on 7-period RSI)
Forecast: Bearish
The market is approaching a significant resistance area 84,393.94.
Due to the fact that we see a positive bearish reaction from the underlined area, I strongly believe that sellers will manage to push the price all the way down to 81,267.75 level.
P.S
Overbought describes a period of time where there has been a significant and consistent upward move in price over a period of time without much pullback.
Disclosure: I am part of Trade Nation's Influencer program and receive a monthly fee for using their TradingView charts in my analysis.
Like and subscribe and comment my ideas if you enjoy them!

BITCOIN BEARS ARE GAINING STRENGTH|SHORT
BITCOIN SIGNAL
Trade Direction: short
Entry Level: 84,174.20
Target Level: 80,643.17
Stop Loss: 86,519.44
RISK PROFILE
Risk level: medium
Suggested risk: 1%
Timeframe: 3h
Disclosure: I am part of Trade Nation's Influencer program and receive a monthly fee for using their TradingView charts in my analysis.
✅LIKE AND COMMENT MY IDEAS✅

BITCOIN Is Going Down! Sell!
Here is our detailed technical review for BITCOIN.
Time Frame: 4h
Current Trend: Bearish
Sentiment: Overbought (based on 7-period RSI)
Forecast: Bearish
The market is trading around a solid horizontal structure 83,714.88.
The above observations make me that the market will inevitably achieve 81,433.62 level.
P.S
Please, note that an oversold/overbought condition can last for a long time, and therefore being oversold/overbought doesn't mean a price rally will come soon, or at all.
Disclosure: I am part of Trade Nation's Influencer program and receive a monthly fee for using their TradingView charts in my analysis.
Like and subscribe and comment my ideas if you enjoy them!

BITCOIN SELLERS WILL DOMINATE THE MARKET|SHORT
BITCOIN SIGNAL
Trade Direction: short
Entry Level: 85,782.07
Target Level: 79,230.93
Stop Loss: 90,149.50
RISK PROFILE
Risk level: medium
Suggested risk: 1%
Timeframe: 12h
Disclosure: I am part of Trade Nation's Influencer program and receive a monthly fee for using their TradingView charts in my analysis.
✅LIKE AND COMMENT MY IDEAS✅

BITCOIN Will Go Lower From Resistance! Sell!
Here is our detailed technical review for BITCOIN.
Time Frame: 4h
Current Trend: Bearish
Sentiment: Overbought (based on 7-period RSI)
Forecast: Bearish
The market is trading around a solid horizontal structure 83,533.11.
The above observations make me that the market will inevitably achieve 79,022.44 level.
P.S
Please, note that an oversold/overbought condition can last for a long time, and therefore being oversold/overbought doesn't mean a price rally will come soon, or at all.
Disclosure: I am part of Trade Nation's Influencer program and receive a monthly fee for using their TradingView charts in my analysis.
Like and subscribe and comment my ideas if you enjoy them!

BITCOIN SHORT (EXPERIMENTAL)In a bear market scenario, Bitcoin might see extended periods of stagnation or decline, which could challenge its perception as a store of value or its role in a diversified investment portfolio. However, bear markets can also present buying opportunities for long-term investors, as they may view the price declines as temporary setbacks in Bitcoin's overall growth trajectory.

BITCOIN Is Very Bearish! Sell!
Please, check our technical outlook for BITCOIN.
Time Frame: 9h
Current Trend: Bearish
Sentiment: Overbought (based on 7-period RSI)
Forecast: Bearish
The market is approaching a key horizontal level 84,591.77.
Considering the today's price action, probabilities will be high to see a movement to 76,443.59.
P.S
Please, note that an oversold/overbought condition can last for a long time, and therefore being oversold/overbought doesn't mean a price rally will come soon, or at all.
Disclosure: I am part of Trade Nation's Influencer program and receive a monthly fee for using their TradingView charts in my analysis.
Like and subscribe and comment my ideas if you enjoy them!

HelenP. I Bitcoin may grow little and then drop to support areaHi folks today I'm prepared for you Bitcoin analytics. Some time ago, the price rebounded from the resistance level, which aligned with the trend line and resistance zone, attempting to rise. However, it failed and started to decline. Later, BTC dropped to the same resistance level again, broke through it, and then fell to the trend line, which coincided with the support level and support zone. After that, the price made an upward impulse to the resistance zone, followed by a quick correction before reversing and climbing back to the 91300 resistance level. The price consolidated around this level for some time before declining to the 78350 support level. Recently, it turned around and started moving upward again. Given this structure, I expect BTCUSDT to rise slightly before dropping to the support zone and breaking the support level. With this in mind, my target is set in this area - 76500 points. If you like my analytics you may support me with your like/comment ❤️

BITCOIN BEST PLACE TO SELL FROM|SHORT
BITCOIN SIGNAL
Trade Direction: short
Entry Level: 82,814.63
Target Level: 81,400.41
Stop Loss: 83,754.73
RISK PROFILE
Risk level: medium
Suggested risk: 1%
Timeframe: 1h
Disclosure: I am part of Trade Nation's Influencer program and receive a monthly fee for using their TradingView charts in my analysis.

BTC/USDT SELL/SHORTbitcoin can move down
In this analysis, we are observing the potential repetition of market history by comparing the current Bitcoin price action to the previous bearish cycle. By utilizing Fibonacci retracement levels, historical patterns, , we can formulate a hypothesis that the market might follow a similar trajectory if bearish sentiment prevails.
Bitcoin may reach resistance line and then drop to 83400 levelHello traders, I want share with you my opinion about Bitcoin. A few days ago, Bitcoin entered a descending wedge and began to decline within it. Soon after, the price dropped to the seller zone, which aligned with a resistance level, and eventually broke through. Following this move, BTC quickly fell to the 83400 support level, which coincided with the buyer zone, and even dipped below, breaking through the level. After reaching the wedge’s support line, Bitcoin immediately reversed and started moving upward. In a short time, the price reclaimed the 83400 level, performed a retest, and continued its upward movement. Later, BTC climbed to the resistance level and briefly entered the seller zone, where it consolidated near the wedge’s resistance line before dropping back to the buyer zone, breaking through 93600. Within the buyer zone, the price touched the wedge’s support line before making a strong impulse upward, breaking back above 83400. Currently, BTC is still moving higher, and I anticipate that the price will reach the wedge’s resistance line before reversing downward. Based on this scenario, my target is set at the 83400 support level. Please share this idea with your friends and click Boost 🚀

BITCOIN BEARS ARE STRONG HERE|SHORT
Hello, Friends!
Previous week’s green candle means that for us the BITCOIN pair is in the uptrend. And the current movement leg was also up but the resistance line will be hit soon and upper BB band proximity will signal an overbought condition so we will go for a counter-trend short trade with the target being at 78,724.
✅LIKE AND COMMENT MY IDEAS✅

BITCOIN/USDT Potential test of the 86k LevelsThe distribution of Bitcoin still in power, building top structure can potentially gets us to 86k Levels.

BITCOIN BEARS WILL DOMINATE THE MARKET|SHORT
Hello, Friends!
BITCOIN is trending down which is evident from the red colour of the previous weekly candle. However, the price has locally surged into the overbought territory. Which can be told from its proximity to the BB upper band. Which presents a great trend following opportunity for a short trade from the resistance line above towards the demand level of 93,774.
✅LIKE AND COMMENT MY IDEAS✅

BITCOIN BEARS ARE GAINING STRENGTH|SHORT
Hello, Friends!
BITCOIN is making a bullish rebound on the 1H TF and is nearing the resistance line above while we are generally bearish biased on the pair due to our previous 1W candle analysis, thus making a trend-following short a good option for us with the target being the 95,029 level.
✅LIKE AND COMMENT MY IDEAS✅

BITCOIN BEARS ARE GAINING STRENGTH|SHORT
Hello, Friends!
We are now examining the BITCOIN pair and we can see that the pair is going up locally while also being in a uptrend on the 1W TF. But there is also a powerful signal from the BB upper band being nearby, indicating that the pair is overbought so we can go short from the resistance line above and a target at 98,358 level.
✅LIKE AND COMMENT MY IDEAS✅

BITCOIN BEARS WILL DOMINATE THE MARKET|SHORT
Hello, Friends!
It makes sense for us to go short on BITCOIN right now from the resistance line above with the target of 96,962 because of the confluence of the two strong factors which are the general downtrend on the previous 1W candle and the overbought situation on the lower TF determined by it’s proximity to the upper BB band.
✅LIKE AND COMMENT MY IDEAS✅
