Beware of this BTC bull trap - First 50k then 15kHey Guys,
as always: My Elliot Wave Count plus all other informations affirming my thesis are attached on the Chart.
Bitcoin-short

Short bitcoin after fill the gapwe are still in major correction phase and i believe end of this minor bullish correction is around 50k

Bitcoin to drop to 40k / 38K before continuation of rallyDouble top on 6H RSI and lower highs on bitcoin point towards likely drop to 38-40K buy zone. Weekly green candle close of BTCUSDT is less than half of previous red candle's body, another sign of weakness.
Weak third consecutive SP500 weekly close is hinting that the 1.9T stimulus package is already factored in the price and a tumble on today's stock market open will serve as the catalyst for bitcoin's dump to 40k.
With serious buyers interest at 40k support we will likely continue from there to 55k+ and that bounce at 40k will be the best buying opportunity for alts too. I will post a long idea if the dump materialises.
Target 1: 40k
Target 2: 38,5k

It takes time to find the bottomJust a little thoguht experiment here based on a fractal of last bear market. looks pretty logical to me. I think we continue down from here with the possibility of going to 47k first.

Bitcoin - redistribution phase Wyckoff -> road to 20kBitcoin - redistribution phase Wyckoff -> road to 20k

the big dirty short- The big drop then 3 months of sideways action.
- Now thinking of placing a short off the 618 to the 236 or further.

Bitcoin Short Setup & IdeaBitcoin lingered a lot in this price zone, I don't think it's a logical situation to linger so long.
I think at the level of $ 41300, investors sold their goods and there are no new buyers for Bitcoin at these levels.
Earlier than that, the $41000 and $42500 range was a sell zone for bitcoin. I prepared a short setup because, thought it could not exceed the 41000 dollar levels.
Please manage your risk.

BTC Short to fill futures gap before advancing higherFutures Gap to be filled before advancing, Bearish until end of the year

BTC/USDT (1D) Expanding Triangle ? Midterm gameplanHi Traders,
hopefully You are enjoing summer after huge profits. ?
There is an Idea what we could see at BTC chart in next few days - weeks. Right now this could be least expected move from so called Whales. Most people are alredy Getting in. So lets squizzz them and scare the rest of HODLeers before big guys will fill their bags.
We will most Likley see Expanding Triangle, check the basic informations here:
worldcyclesinstitute.com
Hence Last wave ((v)) of A could go to 24K (if ((v)) = 1:1 to ((i)); or possibly 20K = 1:618 Extension.
Trade safe, let me know what your strategy for BTC right now.

Strong Downtrend Line Hit.Super strong trendline hit. Ties in with my bearish crab thesis. (See on my profile).
Bitcoin looking good to go way lower.

BitCOIN: Great SELL opportunityFollowing the previous updates, price has finally came to a key resistance and supply zone, and its most likely to be rejected harshly, which, if so, will send price all the way down to 18000.

BTC/USDT 30/07-31/07BINANCE:BTCUSDT
*need to take lvl. 37-38k, in this moment will see volume to go more down on 35-36k (to take liquidation)
or will grow up to 41-42k and after go back at 33-34k.
Simple idea, not financial advice.

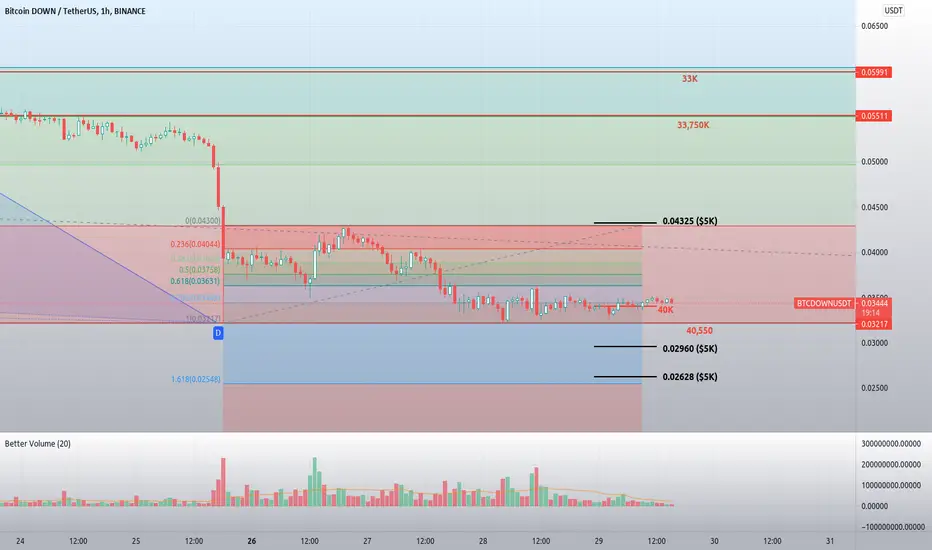
More Binance HK FUD as Exchange Sets CAP on BTCDOWN Token TradesSo this WAS my buy grid until I attempted to enter orders into the system and received a popup window stating that I would exceed some new limit they now have placed on the amount of BTCDOWN an account holder can accumulate. Total BS and apparently they've capped ALLLLL the DOWN tokens to $5K max citing "extreme risk" as their reason for doing so. I could go on a rant but why bother, the variable leverage and ease of use was why I chose to use this token over jumping through all the margin hoops to short straight vanilla Bitty. Also, Binance HK has further caved to regulators and set a new cap on exchange withdrawals to 0.06 BTC for lower tier verified accounts. The party will end at some nearing point now and the glory days of a "free market" for crypto will soon be gone. It was fu while it lasted though. www.binance.com

Intraday Short on BTC1. We are facing resistance of previous high and 100 MA
2. we are needing to fill the CME gap at 34.4k -33k
3. Zone lines perfect with fibo

BTC/USD (Short) Bearish Setup Bitcoin bearish continues till 25k. Looks like we gonna taste our new support level.
Educational purpose only. Not a investing advice.

NZDJPY - Key Area Approaching!NZDJPY approaching a key reversal area. We're in a series of impulse and corrections. Expecting the next impulse very soon.
We're expecting JPY strength = NZDJPY SHORT.
TP 200pips!
Broke this down completely in the VIP . Have a look at the links below.
Goodluck and trade safe!

BITCOIN SHOW RISING WEDGE.BITCOIN SHOWS THE RISING WEDGE IN 1 HOUR GRAPH. AND BITCOIN CONTINUOSLY RISE AND IS NOW TRADING AT 34,700 DOLLARS, THE HIGHEST LEVEL IN ALMOST 3 WEEKS.
I'M STILL INTERESTED IN SHORTING BTC, BUT AS I SAID BEFORE, I'LL BE CAREFUL DOING SO DURING THE BOUNCE.

Rectangular FlagIt seems that a rectangular flag harmonic pattern has been formed in the H1 timeframe chart, which due to the slope of the chart upwards, there is a possibility that the price will leave the floor of the rectangle and Bitcoin will fall. What is your opinion?

Bitcoin - Short Below Key Resistance Level Bitcoin has consolidated below support at $31,200 and continued to fall below the psychological $30,000 level. We expect the cryptocurrency to move lower if doesn't rebound strongly back above resistance at $31,200 in the coming trading sessions. Bitcoin has sustained it's downward momentum since the beginning of May on the back of Chinese crackdown and most recently negative investor sentiment. This is on the back of investor fears of the spread of the covid delta variant impacting the global economic recovery. Additionally, Bitcoin has continued to fall as inflation has risen 5.4% versus 4.9% forecast despite it previously being seen as an inflation hedge due to it's limited supply.

Head and Shoulders pattern on the 4HTarget is 31,150ish or it might wick down to 29k. before a bounce on 31.2k maybe?

Bitcoin Bearish confirmationA few days ago I said that bitcoin was undergoing a bearish confirmation, and the prediction was right. Longing BTC as of now is not a bad option for the long-term, however, do not be surprised to see BTC fall below 30k this week. Breaking back into the descending channel only confirmed my suspicion that BTC was being falsely pumped. 30k price retest incoming... If we fail, expect a visit to 19.8-20.5k range before the bull market returns.

Down the stairs we go for BitcoinAnother head and shoulders seems to be in play here. 20k would be our target area.
