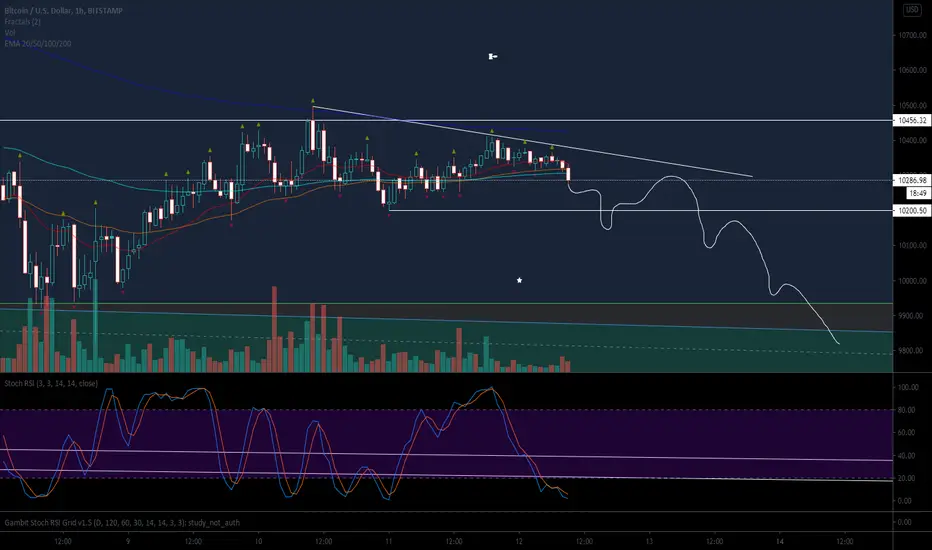
$BTC ~ Are bears getting ready to pick up sell pressure/momentum-Yurlo
Please HIT that like button for me if you appreciate my daily posts with updates for you guys 👍
Closing under $10,200 would be ideal on a 4 hour close.
Bulls should start to panic at that point and sell pressure should intensify for some time.
(I had a dream last night)
Cheers
-Yurlo
Bitcoin-short
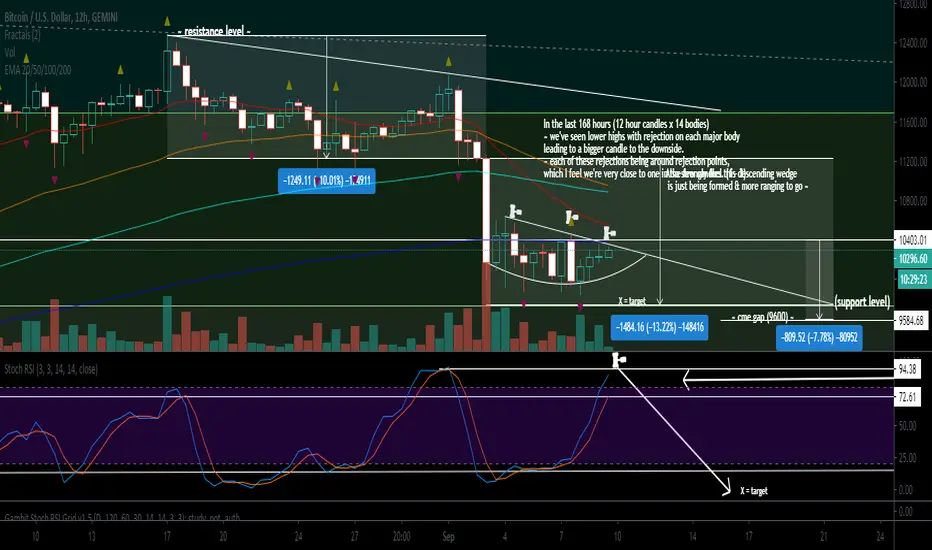
Descending wedge being formed on (Bitcoin) ~ Rejection from top-Yurlo (Please HIT that like button for me) 👍
In the last 168 hours (12 hour candles x 14 bodies)
~ we've seen lower highs with rejection on each major body leading to a bigger candle to the downside.
~ each of these rejections being around rejection points,
which I feel we're very close to one in the few candles. (1 - 3)
Also strongly feel this descending wedge is just being formed & more ranging to go ~
Will provide updates on this post likely tomorrow & in coming days.
Cheers ❤️
bitcoin 12h rsi void suggests more downsideit would be super bullish to see the rsi bottom out and price hold on the long term diagonal with a nice big azz divergence!

Btcusd bearish 15 min chartBtcusd short..10200.. stop loss 10400..
target 9800....
1:2 risk reward ration

$9950 IS THE SHORT TERM BEARISH TARGET ($9600 cme gap followed)Update will be provided after the picture & narrative has been painted.
Labour day weekend = fuckery long weekend.
(CME GAP) - $9600

damn bitcoin, we will see you lowerfractals hey, guess everyone will buy it down here or will everyone expect lower when lows come haha

PERFECT TIME TO FILL THE CME GAP (9600) - (AOI #1 hit liquidity)-Yurlo (Please give this post a thumbs up if you like the visuals) 👍
CME gap at 9600 has not been tapped since the 10k break (which we stayed above for well over a month) It only makes sense for whales to shake out the lose hands before the next massive green dildo into mars.
In order to be like a whale in the future - you have to psychologically try to think the same as one in regards to what YOU'D to if you could move the market to get rid of weak hands.
Below 10k is when panic and true chaos will start and I'm honestly excited.
LET THE CHAOS FUN START BOYS.
I'll see you at 9600.

BTC Head and Shoulders Pattern Opportunity to short!
BTCUSD graph formed a head and shoulders pattern which created opportunity to short.
I indicated the shoulders and head.
The minimum target is the vertical distance from the head to the neckline starting from breaking of the neckline.
Volumes are acting accordingly.
For BTCUSD, this is a good opportunity to short.
If you enjoy my graph, please make sure you like and follow. Your feedback will always be appreciated. Have a great day!


are you ready for SHORT position?i am waiting to see the GREEN move before reaching 13k
so i'm gonna wait for a better buy

BTC bitcoin. Hard correction soon. weekly indicators.just a thought. based on past events and signals

20200828 XBTEUR Short SetupHello everyone,
So here i describe the phases of a Wyckoff Distribution phase at 4HS.
Looks like we are standing on SOW, so whatch out!
Hope this helps you out!
Cheers!
-CharterX

again 11000Im THinking NOw in 11600 to 11800 is a Good ZOne for a again short..1-Look at Trend Line 2-Look MACD 3-Liik 38% on Fibo on BIG Wave

$BTC $XBT strong run - don't long now and shorts use stop loss$BTC $XBT - After shorting some too early then catching the small run to 11,675 I am going back into my shorts. This has had a strong weekend run up and hopefully for the shorters this gets a pullback down towards 11,250. If this crosses the lower trendline from the previous run (brown line) then it may keep running up. Looks like it should get a pullback down towards 11,2ish but don't be counting on it to heavily. The RSI on the 2hr may be getting towards a peak as well so we'll see.

BULLS NEED TO GAIN BACK 11600 IN A HURRY OR 10500 IS NEXTThis TA was made before we broke up OR down.
As you can see we broke down, and are somewhat following the arrows originally put in.
Bulls need to gain 11600 or 11000 will we wiped out, leading to 10.5k retest (BIG LEVEL)
Time will tell.
I've shared both sides for you, now we let the market move.

$XBT $BTC Bitcoin ShortNow that I am even more confident in the correction process we are witnessing. Check out the TA let me know what you think. I really can see a full massive correction happening or possible a half way correction. Whats your analysis?

BTCUSDT 1D | Bitcoin market overview: Local downtrendHello, dear subscribers!
In the last review we wrote that the bulls were testing the upper limit of the trade zone 11,800 - 11,900.
After the bulls failed to pass an important border, the price of Bitcoin dropped to the lower border of the trading zone - 11,100 - 11,200. This movement formed a local downtrend. In case the bears managed to break through the zone 11,100 - 11,200, the next stop will be 10,600 - 10,800. MACD and RSI indicators are in the decline zone, which confirms the downtrend.
Subscribe to the channel and stay with us!

Bearish BTC IDEA using ICT ConceptsBearish BTC idea... Using
The Inner Circle Concepts by Michael Huddleston... @i_am_ict

$BTC Short After reconsideration while looking over the daily chart all im seeing is another run down toward 10k. The RSI is still pretty high as well. Even if you fully dont believe it, its always good to have a hedge portfolio just incase btc starts losing value overall. I am not short longterm and expect it to bounce off 10k if it does make it there. Let me know what you think in the comments section.

Bitcoin Short ScalpLittle scalp here at the range high/B wave of the most likely running flat coming up. TP will be adjusted to front running the .618 for wave c.


bitcoin correction imminentback at the china/vays diagonal, brought up on low weekend volume, 12h POC and cme gap looms at 9500, everyone bullish, covid gaining momentum, you know what to do...

Link bullish as F a 4.4 ,4.2 and a 3.5% wick to the downside on the 3h makes us extremly bullish .On the daily, 10ema retest had very good response . As Link is trading again in our lower chanel we are expect some medium resitance at 9.88 . The big one is our higher green line around 10.02-10.04usd/link (binance chart) ....Once that breaks TP levels are 11 and 11.4usd/link.
LONG.
