BTC BEARISH PREPARE BERAS in control right now. Tapped the top supply zone and ready to dump and liquidation.exe bulas.
Be ready
KNIFE CUT = "The cycle should restart, usually start with a dump" cit. "lord Bera"
SB = "The red line is here, ready to melt faces" cit. "Lord Bera"
Do you contertrade me? you get liquidated
Bitcoin-short


Bitcoin - Short Below Key Resistance LevelWe still see Bitcoin moving lower despite it being relatively stable recently as long as it doesn't break and consolidated above the key resistance level at $8571. Below this level we still see Bitcoin dropping towards $6536 in particular as it's doesn't appear to be as correlated to safe haven assets such as gold and the yen as it was earlier in the year.
The Bitcoin Train Is Over Amigos...Why, What, How dare you! I am sure some of you may be thinking that right now, let me explain. Bitcoin had a great run, it really did! But unfortunately the good times don't last.
We hit a yearly at $13920 which we had a massive rejection from. We have been distributing for the last 4 months decreasing this bullish momentum and preparing for our move down.
The Level I have proposed to short at ($9745) was picked from the 2 Week chart.
Trend has already reversed on the daily, and 2D.
It's only a matter of time... :)

BTCUSD Divergence baissière cachéePremier objectif le plat de la Kijun H4 pour les prix qui correspond au point de contact entre la lagging span et et cette même Kijun H4 au passage elle emprunte le passage fin du nuage : 8254
Deuxième objectif le plat de la SSB H4 : 8133
Invalidation du scénario en cas de cassure du quadruple support (plat de Kijun H1, Tenkan H1 SSB H1 et Kijun H4) : 8425

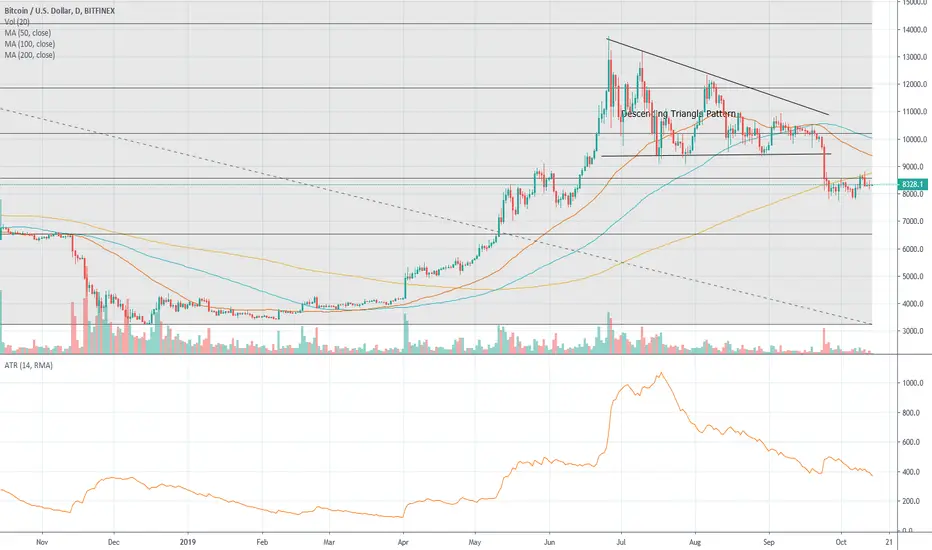
New descending triangle for BTCAs we all saw the last triangle break out to the lower 7700s, we are now confronted to a new triangle in the hourly chart, that is very similar to the previous and that risks to have the same outcome.
Join us in all our channels:
Site: bitwolfcapital.com
Facebook: www.facebook.com
Twitter: twitter.com
Telegram: t.me
Instagram: www.instagram.com
Medium: medium.com

Bitcoin - Short Despite ReboundBitcoin has risen over the past couple of trading session but below the resistance level of $8571 we see the cryptocurrency moving lower towards the $6500. If Bitcoin consolidates above $8571 we can see prices moving higher towards the $10000 psychological level.

Bitcoin (XBTUSD) short.All description on the chart.
Please, don't forget to like and follow.
Thank you.

Bitcoin - Short Below Key Resistance Level We see Bitcoin moving lower towards support at $6536 as long as it stays below the key resistance level at $8571. Our view is re-enforced by Bitcoin not rising on the back of a fall in the stock market over the past few trading sessions due to fears of a global recession as it has been argued in the past that the cryptocurrency can be seen as a safe haven.

Bitcoin - Short - Continued Downward Momentum We see Bitcoin moving lower as it breached the support level at $8571 after breaking the base of the descending triangle. We now see further downside towards the beginning of May lows at $6536 unless there is a sustained rally in the cryptocurrency coming days.


-20% DROP IN BITCOIN. YOU DON'T WANT TO MISS OUT FROM THIS Taking a vivid look at Bitcoin from all Time frames it is clear to see that the chart are showing bearish move on all time frame. Lets start from the monthly time frame, we can see that price has rejected the 1.618 FIB Extension and market should head back down. Now, taking a look at the daily time frame price seems to be holding back and much has to do with the present upward trend line, which price just broke below and this signify that the bears are still in control of this market.

Opportunity for selling BTCUSD!!!We can see a very beautifull descending traingle being formed on the 4-hour chart which most of the time indicates that the market will go down. Have a safe trade guys :)!

Bitcoin Top has already been put in....atleast for now. The buyers are getting exhausted and will wait for lower prices before committing more cash. In the short term,
we will retest the 9486 then break to 8000.

BTC Short 4HRIt seems like we are gearing up for another week of bearish divergence. I am predicting for a dump to the lower $9,000s soon and hopefully a break of the counter trend-line ($9,600). My stop is $10,100 as we see we have a new resistance around $10,050. We should be in for a good short all the way down to $8,500-$8,00 respectively.

Bitcoin (XBTUSD) short.All description on the chart.
Please, don't forget to like and follow.
Thank you.


XBTUSD Possible Scenario - NANPFor more follow links in profile
Entry @ 10326
TP @ 10218
SL @ 10332
THIS IS NO FINANCIAL ADVICE

Short Term UpdateThere have been no big news since the last update in early August, deviation levels and kama verage remained unchanged as well as remained unchanged the threshold of 8300$ that outlines the boundary between the bullish and bearish market.

9.1-9.4k on the table? Or it's a trap...?Hello everyone, ATZ Team is here.
What we see now is same pattern we had before.
For now we expect to hit 9.4k support before hitting 11.3k and 11.8k.
Volume is dropping which confirms our short-term bearish bias.
Nothing more to say because it's Monday and soon we will have more action on the market.

Swing short on Bitcoin from 12,000the only best setup i am looking at this one, at the current price i am not able to find us good R:r trades with us being hunted on the wicks.

BTC Daily Update With recent BTC dominance of 70%+, Price Action has shown little to no signs of major upward movement. Fundamentally we are overdue for a major correction before the New Year and we are itching closer for that to happen. We see major resistance at the .618 levels (11,200), Optimal Trade Entry in this setup is anywhere from 10800 to 11200 depending on desired RR, recommended is 20-40% of your position from 10800-11000 and the rest 11000-11200 if price allows. SL no higher than 11400-11500 for this setup to allow room for possible wick fishing/stop runs. Happy Trading!

NEW TARGET 11.8K?! Be careful...Hello everyone, our predictions playing well 3 in a raw!
So what is next?
If you noticed - price hit resistance zone $10726-10837.
Also, price hit Trend line (orange line).
For now We expect price to drop to $10087 level. before going uo to $11.2k.
More over, what we have found is that, there is around 40% chance to hit $11.8k level.
We do not recommend to short now, trend on lower TF remains bullish.
There are two possible options from where price can start grinding up again:
From current price (1D level support $10512) or from $10087.
Volume supports this move up, but now need cool off before next wave up.
More it will flat at $10512 - more it will gain power to confirm move to $11.2k.
