Bitcoin-short

BTC Shortboi Counter-trade me for free monies!Pls Obama i need it to go down ok? I give u a bagel thx.

BTC GOING BELOW $10,000? POSSIBLE RETRACEMENT TO THOSE LEVELSIt is looking more likely that BTC will go back down to that 10K region again and test the area of 382 on the fib...
I'd be careful. Currently held on the pivot point as support. It is also a weekend. Tomorrow is a key day on the opening of the stock market too...

BTCUSD - Bitcoin Daily Chart! Save money for the great bull!It's not a dream! Bitcoin will reach $19k before xmas.
Save your money for the big bull!

butterfly breakdown Bitcoinafter breakdown you can short
by logic
after the breakdown of the specified level, fly down
on my training I show how my strategies work

For short , Bitcoin testing again the uptrend line at U$ 10800. Another short for bitcoin , at the up trend line in a Daily and 4h timeframe

Bitcoin (XBTUSD) short.All description on the chart.
Please, don't forget to like and follow.
Thank you.

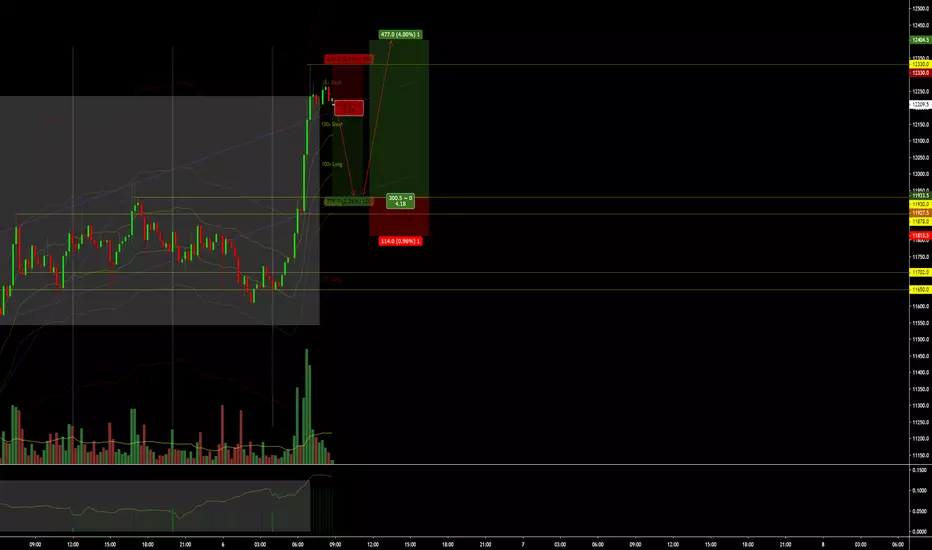
Quick Short ChartHad a good long from 9440 up to 11700 and closed today.
Not going to give a big explanation on this new trade. I've been building a short throughout the day since we've remained under the daily open. Going to see where it takes me. Very tight stop above daily open

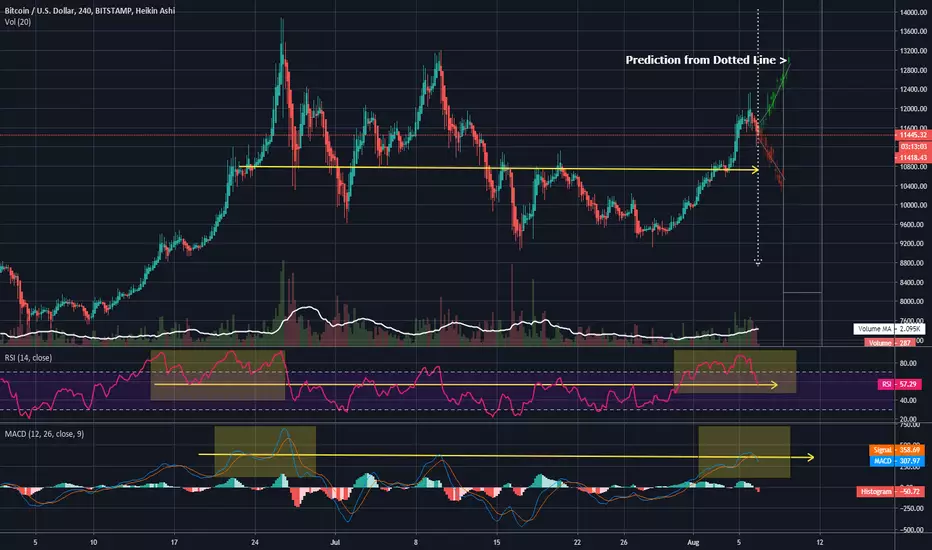
Can BTC repeat June 26th high? MACD & RSI may prove it.If we take a look at the last two bull runs of June 26th and July 9th , the MACD and RSI have similarities to todays bull run. Sure, RSI is over bought but this was the same case as the June 26th bullrun. As you can see the MACD resembles the MACD as of now on the 4HR chart, which means it could push further upward. The RSI peaked at 92 on June 22nd, came down to 67 on June 23rd than resumed upward to a peak of 93 when Bitcoin hit a high of $13,800.
The Differences and Concerns
Todays bullrun has a steeper MACD cross, as well as the sell off is steeper than the July 9th sell before peaking. The same can be said about the June 22nd selling. It was minimal but continued upward shortly after. When comparing the last two peaks, it seems that it reached the peak shortly after a sell off. This case, the sell off is deeper and peak curve downward is steepening.
Next, if we look at the Histogram, it may point that the sell off has just begun. There are almost no points that show the histogram turning bullish again after a peak. After every peak, the histogram went down. Both of these point towards a deeper sell off, but anything can happen.


Back Above Daily KamaThe market is still flat although the bitcoin has managed to return above the Kama average in a position of strength after several weeks below it.
A break above the resistance zone (above 12200$) would confirm the recovery of the trend.
From tomorrow i'm on holiday, see you in September, there will be updates only in case of emergencies:)

Bitcoin (XBTUSD) short.All description on the chart.
Please, don't forget to like and follow.
Thank you.

Bitcoin (XBTUSD) short.All description on the chart.
Please, don't forget to like and follow.
Thank you.

