BTC, Correction Protraction, Final Fibonacci-Determination Now!Hello,
Welcome to this analysis about Bitcoin, we are looking at the 4-hour timeframe perspectives. In my former analysis regarding this subject, I mentioned how Bitcoin developed this main Fibonacci-wave-count structure with the first major waves A and B already completed, if you did not see this analysis already I highly recommend it to watch to have a full-depth-overview. Regarding this, in recent times Bitcoin moved on with the ABC-wave-count to the downside and protracted the wave C in the schedule finally completing this local wave-count and expanding the lower boundary to the place it is now. Besides that, there are further determinations I discovered Bitcoin is forming that are important in upcoming times.
Structural Developments:
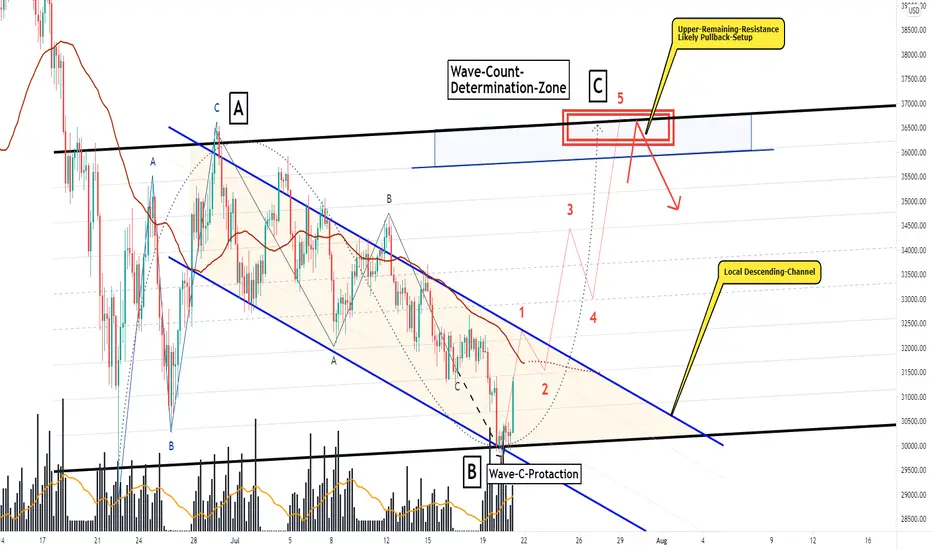
As when looking at my chart now we can watch there that Bitcoin besides the massive ascending-channel which I already mentioned previously has formed this local descending-channel that is marked in my chart in blue. Bitcoin exactly bounced now with the wave-C-protraction ending in the level where the ascending-channel and the descending-channel crossed giving a great reference-support-point in this zone. Furthermore, Bitcoin has shown up with some initially increased volatility which is a great sign and in most occasions indicates a continuation into the volatility direction which is also likely to happen here in a potential combination of an upside-channel breakout.
Upcoming Determinations:
Taking all these factors into consideration now Bitcoin is in a structure which finally defines the ending of the ABC-wave-count within the wave B and therefore the appropriate beginning of the major wave C and the impulse wave-count of which wave C consists. In this case now when Bitcoin manages to increase the bullish pace in the structure to finally breakout above the upper-boundary of the local descending-channel the impulse-wave-count will be in full development and Bitcoin will appoint the upper target-zone marked in my chart in blue, in this target-zone then also lies the main remaining-resistance-cluster marked in red from where a pullback will be highly likely. For now, we should consider the emerging wave-count firstly incoming after that it will be shown at what pace Bitcoin moves into the resistance and if then there comes an immediate strong bearish pullback or not.
In this manner, thank you for watching my analysis about BITCOIN, great when you support it with a like and follow or comment for more market insight!
"Good luck is when opportunity meets preparation."
Information provided is only educational and should not be used to take action in the markets.
Bitcoin-trading
BITCOIN, Current Similarities To The Corona-Crash-Developments!Hello,
Welcome to this analysis about Bitcoin, we are looking at the 4-day timeframe perspective. Since Bitcoin showed up with the heavy bearish breakdowns to the downside it is in a precarious situation however as there already developed important signs of an accumulation and ongoing reversal I discovered meaningful signs that have a very high similarity with the abnormal corona-crash-conditions and the developed recovery. As the market substantially recovered after the corona breakdowns and established lows there are high similarities to the current situation as I detected with highly related developments also from the momentum oscillator perspective, therefore I am looking at the main zones and upcoming developments we need to consider.
As when looking at my chart it is important here to look at on how the market developed during the corona-crash-breakdowns especially with the EMA-structure and the similarities to the current situation in which Bitcoin began to form alike establishments as it was already seen before. When looking at the EMA structure what is paramount here is the 20-EMA in black which actually marked the bearish breakdown beginning within the first breakdown and rebound phase in September 2019 with the 20-EMA crossing all faster-moving EMAs down till the last one as the 55-EMA marked in dark red, this was a false breakout because after that the market recovered with the 20-EMA crossing up above again.
After this first breakdown and rebound phase, the market normally should have been recovered and developed further bullishly above the EMAs however what followed was the next breakdown and rebound phase caused due to the corona-crash which was the source of this second abnormal breakdown and rebound phase. After this corona crash, the market recovered again and the 20-EMA crossed up again. Further important here is the main ascending-trend-line marked in my chart in blue which has its origins within the corona-breakdown-bottom in March 2020 which Bitcoin is still holding and recently bounced again.
Considering now also the Momentum Oscillator which I found shows some meaningful developments in the structure, in this case, the 0 value line marked in black is important because when momentum crosses below or above this line the market is likely to continue into the crossed direction. Also, a major indication is extreme points such as tops and bottoms which are moving below the previously established reference-conditions. It was already seen in the breakdown and rebound phases below that Momentum crossed the 0 line to the downside made a new significant low and after that rebounded to cross above the zero lines simultaneously with the price-action, a similar thing is happening at the moment as the Momentum formed an extreme low below the previous all-time-low and after that rebounded which is indicating the potential momentum and price-action low.
Collecting this information it will be decisive for Bitcoin on how it develops in the near future, therefore, when Bitcoin manages to bounce in the current structure and move on to test the 55-EMA in red this can be the origin and indication for the actual reversal as Bitcoin did the same in the previous breakdown and rebound phases as it first tested the 55-EMA from the downside and then managed to move above it. Together with the ascending-trend-line this can be a realistic approach in the upcoming times. Also from the local structure, this bounce should come sooner or later, what happens after it then will show if the phase can form anew like previously seen.
In this manner, thank you for watching my analysis about BITCOIN and the important similarities in the EMA structure to previous bearish breakdowns and how this can affect upcoming Bitcoin price-action-development, great when you support it with a like and follow or comment, all the best!
"The past, like the future, is indefinite and exists only as a spectrum of possibilities."
Information provided is only educational and should not be used to take action in the markets.

BTC Time For Some Cold Water In The Face, Fibonacci Approves!Hello,
Welcome to this analysis about Bitcoin and the 4-hour timeframe perspectives. In recent times Bitcoin decreased with volatility and volume in its structure which is a primary occasion is an indication for increasing volatility again as this is the main market-cycle-behavior. Bitcoin has built a solid base above the 30.000 USD level above which it is now building up and it is not likely that bearishness pushed below this zone again. On the fundamental side there are institutional accumulating in this current situation and besides further larger financial companies such as the Bank Of America which is the second biggest bank in America is lying eyes on Bitcoin and enables Bitcoin Futures Trading which is likely to drive increased volume into the market. Besides that El Salvador announced it wants to emerge with its own Stablecoin which would be the first country emerging with a stablecoin, as El Salvador already made Bitcoin legal tender this can boost additional demand in the market. Now from a technical perspective Bitcoin still needs the appropriate metaphorical cold water in the face for volume to increase again and in this case I discovered the underlying Fibonacci-count which can enable this firstly on the short-to-middle-term-perspective.
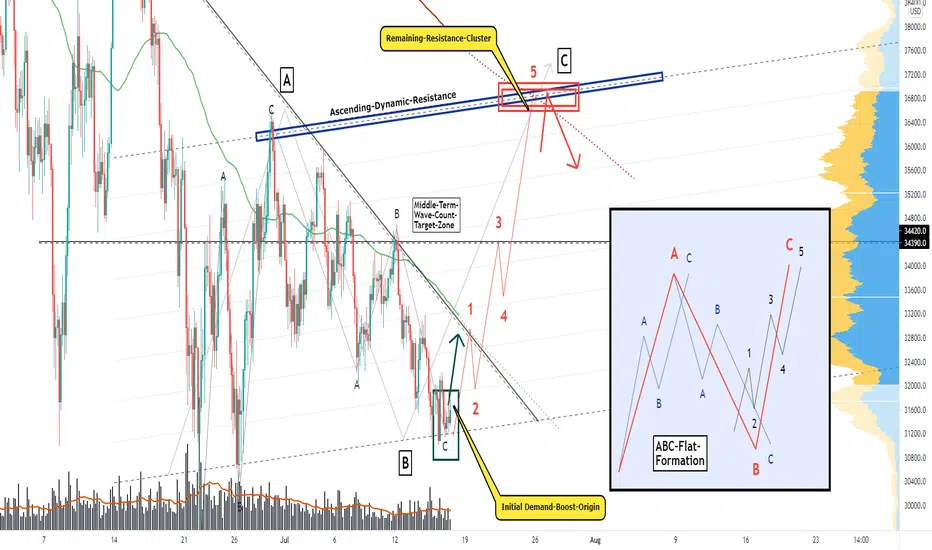
As when looking at my chart we can watch there how Bitcoin is moving forward in this main ascending-channel-formation marked with the dashed lines in grey. The lower boundary where Bitcoin recently traded into is the main support in this structure and it is likely that Bitcoin increases with demand in this area as the lower boundary served as strong support already before with the bounces from the 30000 USD level. This determination is underlined by the major wave-count Bitcoin is forming with the waves A and B almost already completed, in fact Bitcoin is about to complete wave B with the local waves now. What follows up after wave A and B are completed with the certain ABC-wave-counts is the wave C developing with a 12345-impulse wave-count to the upside that is now awaiting with Bitcoin and the development of this wave-count will fully emerge with Bitcoin above the descending-trend-line in my chart. Now once this impulse wave-count and wave C has been completed a crucial development will come as Bitcoin will approach the upper remaining-resistance-cluster where several supports coming together likely to show up with a pullback from there. This does not mean Bitcoin is completely bearish as after this pullback there is the possibility given that Bitcoin stabilizes in the structure and builds up on this as it was seen also previously above this level, how and when this emerges will be seen once Bitcoin completed the Fibonacci-wave-count-formation.
In this manner, thank you for watching my analysis about BITCOIN and the main Fibonacci-wave-count-structure with the upcoming developments to expect, great when you support it with a like and follow or comment, all the best!
"There are many roads to prosperity, but one must be taken."
Information provided is only educational and should not be used to take action in the markets.
BITCOIN (BTCUSD) – Week 29 – Low volatilityBitcoin futures trading is becoming more competitive. Two unnamed people familiar with the subject informed Coindesk that Bank of America has begun enabling select clients to buy bitcoin futures. Futures trading has become a significant element of institutional cryptocurrency activity. Large institutional investors may be hesitant to own Bitcoin directly due to regulatory concerns. Bitcoin futures, on the other hand, allow institutions to get exposure to Bitcoin and other cryptocurrencies without having to possess the underlying assets.
PayPal raises the weekly cryptocurrency purchase limit to $100,000 and eliminates the annual limit. Customers could initially only buy bitcoin and other cryptocurrencies for up to $20,000 each week, with annual transactions restricted to $50,000. Now, the massive payments firm has announced that users will be able to buy bitcoin and other cryptocurrencies for up to $100,000 each week. More significantly, the firm was eliminating the yearly spending cap and replacing it with an unrestricted budget.
Square, the US-based payments startup run by Twitter CEO Jack Dorsey, is doubling down on its Bitcoin (BTC) approach with decentralized finance (DeFi)-related initiatives. This project will eventually be created in the open, according to the CEO: "Open roadmap, open development, and open source."
Technically, Bitcoin is pretty much in the same spot as it was in the last week’s technical report. It moved up a little higher, then continued with a low volatility move to the downside. If the price stays beneath the orange trendline we may see a continuation to the downside, until the price reaches the important support area. For the price to go higher and touch the resistance we must first see a break of the orange trendline. We advise caution, the price may swing up-down many times without giving us a clear direction.
Trade with care.
Best regards,
Financial Flagship
Disclaimer: The analysis provided is purely informative and it should not be used as financial advice. Remember that you need a plan before you start trading; so, take this knowledge and use it as a guidebook that will ultimately help you understand the market and easily predict your next move.

Bitcoin, At A Decisive Intersection, Determining Scenarios!Hello,
Welcome to this analysis about Bitcoin and the weekly timeframe perspective. In this analysis, I am going to look at the important Ichimoku-cloud structure and the connection to other technical factors that are pivotal when considering the current situation. The Ichimoku cloud was developed by a journalist in 1969 and since this date served as a fundamental indicator to spot the trend-stage either it is bullish, flat or bearish, and also determine potential signals within the market. It is necessary to embed this structure in a broader picture to wage the possibilities rightly and come up with the most possible scenarios to consider, this means to also prepare on upcoming changes in direction as possibilities can alter as well.
At the beginning of the declining market and during the downward movements we have seen increasing news negatively against Bitcoin and Cryptocurrency as governments blocking and restricting Bitcoin and Cryptocurrency mining that firstly pushed the price downward and taking some enthusiasm out of the market, especially hash rate and mining competition decreased, however, it is likely that this mining activity is taken up again in other supportive places, such occupation were already seen. On the other side, there are countries that welcome innovation and structural financial change such as El Salvador making Bitcoin legal tender, besides this country, there are also others considering a launch of Bitcoin as legal tender or something similar. While governments all over the world working on their central-bank-digital-currency projects and testing blockchain-based infrastructure to run the next digital euro or dollar it needs to be realized that Bitcoin and Blockchain technology can not be that bad when governments take advantage of it. All these factors representing the indecisive phase the market currently stays for quite a while however this will change as it was always seen in historical price-action, therefore I detected the important technical factors and possibilities in which direction this increase of volatility will likely lead.
When considering the current technical situation we can see when looking at my chart that the weekly trend remains bullish, this is determined by the fact that Bitcoin still is above the Ichimoku-cloud in green. The Ichimoku-cloud is green because the faster moving leading span A (green line) crossed above the leading span B (red line), therefore the definition of Bitcoins trend is still an upside-trend, this can only change when Bitcoin moves below the Ichimoku-cloud as well as the leading span A crossing below the leading span B. Furthermore, it is shown in my chart that Bitcoin since crossing below this first ascending-trend-line after which the market increased with heavy bearishness Bitcoin moved on to the next ascending-trend-line which established by previous price-actions and has a similar weight as the first ascending-trend-line where the price bounced several times, in fact, Bitcoin already bounced recently within this second ascending-trend-line. Besides that Bitcoin also has the 50-MA marked in blue in my chart matching together with the second ascending-trend-line and building an important support cluster in this structure that can convert into a primary inflection-point. Besides that, it has to be marked that Bitcoins momentum is decreasing for a while which on most occasions indicates a reversal in the structure. All these factors underline the possibility for Bitcoin minimum showing up with a bounce from here that moves on to test remaining resistances, which are defined by the ascending-resistance-line marked in dashed grey in my chart, what happens after that will be shown when the time is ripe.
In this manner, thank you for watching my analysis about Bitcoins trend-development according to the Ichimoku-cloud and what are important factors in this structure, great when you support it with a like and follow or comment, all the best!
"There are many roads to prosperity, but one must be taken."
Information provided is only educational and should not be used to take action in the markets.

Bitcoin, Descending-Channel-Breakout To Emerge, Important Zones!Hello,
Welcome to this analysis about Bitcoin, we are looking at the 45-minute timeframe perspectives. Not only on the global timeframe perspectives but also on the local timeframe perspectives Bitcoin is showing up with some interesting signs as I recently detected. With Bitcoin forming the local as well as the global diamond-bottom-formation there is also this important formation now I discovered on the 45-minute timeframe perspectives. This formation especially when it completes in the near future can show up with determining price-actions and activate the dynamic upside-target-zone very. Therefore I detected all the meaningful levels and likely determinations we should consider within the upcoming times.
Structural Developments:
As when looking at my chart now we can watch there how Bitcoin recently bounced within this descending-trend-line marked in dashed grey which is important support here that Bitcoin now realized and moved on to test the 45-MA in the structure marked in my chart in blue. Besides that Bitcoin has also established this main descending-channel-formation marked in my chart in orange, within this channel Bitcoin has the coherent wave-count with the waves A to C already completed and now moved on to test the upper boundary of the formation together with the 45-MA. The volatility and volume recently shown up here are some good initial incentives and indicate a higher possibility to continue with bullishness.
Upcoming Determinations:
Bitcoin has developed a structure in which it has some solid potentials to determine further bullishness. Therefore it is necessary that Bitcoin shows up with a breakout above the upper-boundary of the descending-channel-formation like it is marked in my chart. Such a breakout will activate the upside-targets marked in my chart in blue within the dynamic channel-breakout-target-zone. For now it will be important to elevate on how the breakout out of the channel emerges which will be the appropriate origin for the targets to be pointed and reached. Once the targets are reached the situation needs to be elevated anew and if Bitcoin manages to continue or firstly reverses in the structure.
In this manner, thank you for watching my analysis, great when you support it with a like and follow or comment, all the best!
"Trading effectively is about assessing possibilities, not certainties."
Information provided is only educational and should not be used to take action in the markets.

BITCOIN Is Building A Local Diamond-Bottom In The Global One!Hello,
as already mentioned in previous analysis Bitcoin is building a main global decisive diamond-bottom-formation with the first half of the formation already completed and now Bitcoin is about to develop the second half. If you did not see this analysis already I highly recommend it to watch to have a full-depth-overview because this analysis is building a coherent follow-up to the wave B development and the local perspectives Bitcoin is forming in this determining diamond-bottom-formation. Therefore I detected all the important levels, formational structures and upcoming determinations we should consider with Bitcoins local diamond-bottom-formation likely to be the origin of the global wave B.
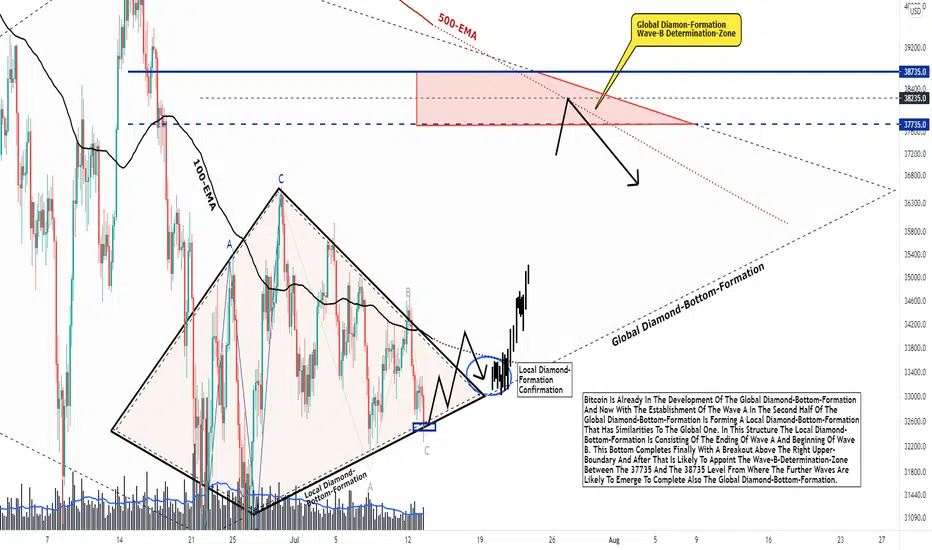
As when looking at my chart now we can watch there the local diamond-bottom-formation marked in orange. This formation developed below the 100-EMA in the structure and severely moved on to test the EMA. Furthermore the global as well as the local diamond-bottom-formations forming the main ascending-support-line within the left lower boundary of the formations where Bitcoin bounced several times to move on with the local diamond-bottom-formation wave-count. As for now Bitcoin already finished the left first half of the formation and is now about to complete the right second half and is now testing the inflection-point of both formations at 32500 which is a good origin for a bounce to finalize the local formation.
When Bitcoin manages to substantially bounce within this decisive inflection-point marked in my chart in blue this has a great potential to move on with further bullishness and bounce above the right upper-boundary of the local diamond-bottom-formation, such a price-action will complete the local diamond-bottom-formation bullishly to the upside and will move on with the further continuations. As already mentioned the wave B has the potentials to travel to the 37735-39735 level which is marked in my chart in red, once this level is reached Bitcoin will continue further with the wave count and development of wave C in the structure to finalize the whole diamond-bottom-structure.
For now, it is necessary to keep patient and do not rush into trades that do not satisfy. Especially in such times where shorts continuously increasing it is better to look at how the market develops and more importantly to wait for the right confirmations, history has always shown in Bitcoin as well as other asset classes that after such a phase comes a phase with increased volatility. From a trading perspective, it is better to keep patient on the right confirmations or to take advantage of potential lower price swings in the local structures which is not the best way for everybody. Therefore it will be shown how Bitcoin develops here especially once a breakout of the local diamond-bottom-formation can emerge it will be an important journey.
In this manner, thank you for watching my analysis, great when you support it with a like and follow or comment, all the best!
Information provided is only educational and should not be used to take action in the markets.
BITCOIN, Setting Up For Determined Breakout With Increased Vola!Hello,
Welcome to this analysis about Bitcoin, we are looking at the 4-hour timeframe perspectives. In the recent days and weeks, Bitcoin moved into a more protracted consolidational and accumulational range on lower timeframe perspectives as the 4-day timeframe. It was always shown in historical price-data that after such a movement of decreasing volatility and decreasing volume a breakout either to the up or downside occurred with the accelerating volatility, spread and volume, it is important to consider that this is also likely to happen with Bitcoin here as the price-action can not go on forever in such a low volatility range. In this case now I discovered important signs that indicate an upside-breakout incoming within the next time.
Channel, Moving Average And Volatility Range Structure:
When looking at my chart now we can watch there how Bitcoin formed two important channels here, the first is this massive global ascending-channel-formation and the second is this faster moving ascending-channel which resulted out of the breakout above the upper-boundary of the massive ascending-channel. These two channels building exactly one intersection which also the 90-EMA marked in blue crossed and Bitcoin bounced exactly in this intersection of the ascending-channels and the 90-EMA, within this bounce Bitcoin showed up with this initial high volatility move to test the main resistance at 36600. This is a very considerable structure for an initial bottom here as the bounce from the intersection level determines strong support in this zone.
Oscillator Development With The Historical Low Momentum And Stochastic RSI:
With considering the indicators such as the stochastic RSI it is also good to look at the weekly timeframe perspective as there it is marked that the momentum recently reached an all-time-low and is consolidating in this range, the interesting thing is that the momentum on the lower timeframe 4-days perspective already increased and appoints the 0 levels giving an indication that this can also follow on the weekly timeframe. Besides that the stochastic RSI is now consolidating since a longer time below the 20 value on the weekly timeframe perspective whereas the 4-day stochastic RSI already moved on and increased. These developments on the oscillator side also support the scenario of a upside-range-breakout coming up in the future.
Upcoming Perspectives And What Can Be Expected:
When approaching the market out of a technical analysis perspective it is always necessary to properly wage the possibilities and different technical factors to come up with scenarios that are possible and others that are less possible. In this case there is a higher possibility given for Bitcoin to emerge with a bullish breakout and testing of previous resistance firstly than a complete bearish continuation to the downside because the supports above which Bitcoin is still holding are just to omnipresent together with the other technical factors such as the tightening MAs which happens above the given supports indicate the upside-breakout to take place more likely compared to the bearish one.
In this manner, thank you for watching my analysis, have a good day, will be great when you support it with a like and follow or comment, all the best!
"There are many roads to prosperity, but one must be taken."
Information provided is only educational and should not be used to take action in the markets.

Ethereum, Forms Dedicated Double-Bottom, How It Completes!Hello,
Welcome to this analysis about Ethereum, we are looking at the 45-minute timeframe perspectives. From the local timeframe perspective, I detected a very compelling engrossing, and interesting formation that is forming and can be the indication for a dedicated upside continuation to reach worthwhile targets in the structure. In this case, the best is to wait on the appropriate confirmations before moving into this direction rather than overspeculating the market into a one-sighted direction as it is often seen these times. Therefore, I detected all the important levels, formational structures, and likely determinations we should consider with Ethereum in this established price-action-development.
Structural Establishments:
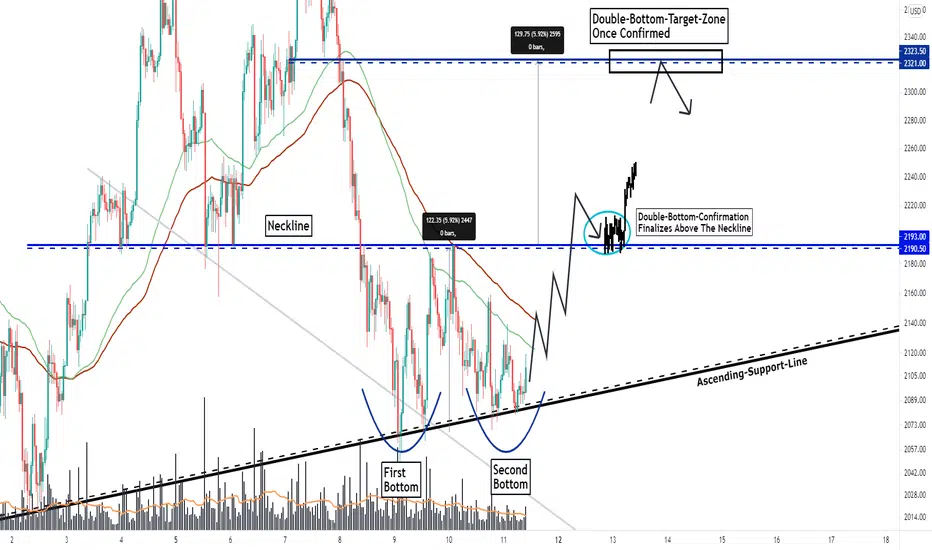
As when looking at my chart we can watch there how Ethereum has severely bounced in this ascending-support-line marked in black in my chart, this is a very important support line here because it is holding the trend to the upside and besides that Ethereum has also coherent support in this structure at the 2080 level. Furthermore, the bounces from the trendline can be divided into a first bottom and a second bottom together this is an initial double-bottom and the price-action is now moving on to test the 65-EMA in green and the 100-EMA in red which is certainly a good sign as to when the price-action moves above this will lead to further initial continuations.
Upcoming Determinations:
Taking all these factors into the consideration now Ethereum has the ability to complete this double-bottom bullishly to the upside and especially when this does a double-bottom can be a solid indication for continuations, activation of targets, and reaching the targets finally. The double-bottom in this case with Ethereum completes firstly when Ethereum holds sustainably above the 100-EMA and after that manages to increase further finally marking above the 2190 level where the neckline stays marked in my chart in blue. Once Ethereum closes above this neckline the upside-targets at 2320 are activated and Ethereum will move on to appoint these targets in the schedule, it will be an interesting development.
In this manner, thank you for watching my analysis about ETHEREUM and its initial double-bottom that has a high possibility to complete and activate targets in the next times, will be great when you support it with a like and follow or comment, great contentment for everybody supporting, all the best!
"Good luck is when opportunity meets preparation."
Information provided is only educational and should not be used to take action in the markets.
BTC, Correction Protraction Descending-Wedge, How It Completes!Hello,
Welcome to this analysis about Bitcoin, we are looking at the 4-hour timeframe perspectives. As already mentioned in previous analysis Bitcoin is within a correctional movement which now protracted as the market moved anew a little bit to the downside and rebounded again like it was seen previously. In this case, now I discovered an important formational structure with the technical pattern forming that is likely to be the decisive factor in the near upcoming times. Especially when this formation completes it can lead to great volatility and activate targets in the schedule that have a high possibility to be reached after the completion and confirmation of the main formation, therefore I detected all the important levels and likely destinies.
Structural Developments:
As when looking at my chart now we can watch there how Bitcoin moved on with the correction protraction in the structure, this means that price-action continues to validate the given supports to find the appropriate trend, even when Bitcoin moved something below previous supports the bullish upcoming perspectives still have a higher possibility to emerge compared to the complete bearish breakdown. In this case, now Bitcoin is forming this major descending-wedge-formation with the coherent wave-count within already completed and now Bitcoin is setting up to finalize this whole formation. Also, a solid sign here is that Bitcoin holds above the 15-EMA in red and consolidates in this range between the 65-EMA indicating a determined breakout out of it.
Upcoming Determinations:
Taking all these factors into the consideration now Bitcoin has formed a substantial structure upon which can build finally completing this main formation in the schedule which will happen when Bitcoin marks above the upper-boundary and holds this level as it is shown in my chart. Such a price-action will activate the upside-targets at the 37000 USD level which are highlighted in my chart in blue. The next time it will be important on how Bitcoin completes this decisive formation and how it can emerge with the determined continuations after this is done. When the targets are reached the situation needs to be elevated anew and if Bitcoin manages to continue bullishly right away or firstly sets up for a reversal which will also not be unlikely in this case.
In this manner, thank you for watching my analysis about BITCOIN and its correction protraction with the descending-wedge-formation developing in the structure, will be great when you support it with a like and follow or comment, great contentment for everybody supporting, all the best!
"Good luck is when opportunity meets preparation."
Information provided is only educational and should not be used to take action in the markets.

Bitcoin, Invers Head-And-Shoulder, Important Determinations!Hello,
Welcome to this analysis about Bitcoin, we are looking at the 45-minute timeframe perspectives, the recent events, the established formational structure, and what we can expect in the upcoming times. Bitcoin as already mentioned in the previous analysis has a higher bullish alignment with the potentials to increase this in the near future. Besides the descending-wedge-formation and other technical factors I showed up in the previous analysis I detected an important formation on the local 45-minute timeframe perspectives which has the ability to emerge with great bullishness especially when it rightly completes in the schedule, therefore I elaborate the main scenarios and upcoming determinations.
Structural Developments:
As when looking at my chart now we can watch there how Bitcoin is rightly holding its established structure and recently also bounced within the 30.000 USD level which is a good reference factor for the substantial strength bulls building up here. Furthermore, Bitcoin has this ascending-trend-line marked in dashed grey where it several times bounced. Taking this further Bitcoin has developed this main inverse head-and-shoulder-formation with the left shoulder and the head already completed and the right shoulder developing now with the bounce of the ascending-trend-line and the 30.000 USD level which is a good indication for the right shoulder to complete and finalize the whole inverse head-and-shoulder-formation.
Upcoming Determinations:
Taking all these factors into consideration Bitcoin is in a structure where the further bullish continuation possibility increases. With the inverse head-and-shoulder this means the formation completes when Bitcoin bounces above the neckline and closes there as it is marked in my chart. When Bitcoin shows up with such a price-action it will complete the formation bullishly to the upside and will activate the upside targets lying within the 35750 levels marked in my chart in blue. Once Bitcoin manages the breakout and completion of the inverse head-and-shoulder as expected there is a solid possibility given for the targets to be reached, after this the situation needs to be elevated anew.
In this manner, thank you for watching my analysis about BITCOIN and its inverse head-and-shoulder-formation which has the ability to complete in the near future and show up with determined continuations, will be great when you support it with a like and follow or comment, great contentment for everybody supporting, all the best!
"Trading effectively is about assessing possibilities, not certainties."
Information provided is only educational and should not be used to take action in the markets.

BITCOIN (BTCUSD) – Week 28 – Clear direction missing Square CEO Jack Dorsey stated on July 9th that the payments company aims to create a Bitcoin hardware wallet via Twitter (his other company). Jesse Dorogusker, Square's head of product development, initially announced the company's decision to "create a hardware wallet and service to make bitcoin custody more popular." "We're doing it," Dorsey said in a retweet.
According to a tweet from Argentina's National Congress member José Luis Ramón, a law has been presented that would allow wages to be paid in Bitcoin (BTC). The lawmaker took the initiative in an effort to help protect Argentinians from hyperinflation. In other news, ITV America, a television production company, has issued a casting call for a new reality program about people who have locked themselves out of their bitcoin wallets and are willing to go to any length to reclaim them.
Technically, as we see the structure developing right now, the higher probability move is to the upside reaching at least the resistance area marked on the chart. However, if the price stays beneath the orange trendline and goes for one more low in the structure we may see a continuation to the downside, until the price reaches again the important support area. We advise caution, the price may swing up-down many times without giving us a clear direction.
Trade with care.
Best regards,
Financial Flagship
Disclaimer: The analysis provided is purely informative and it should not be used as financial advice. Remember that you need a plan before you start trading; so, take this knowledge and use it as a guidebook that will ultimately help you understand the market and easily predict your next move.

Why BTCs H-S-Formation Will More Likely Form A Upside-Breakout!Hello,
Welcome to this analysis about Bitcoin, we are looking at the 12-hour timeframe perspectives. As already mentioned in the former analysis Bitcoin has formed profound structures for a bullish aligned development in the structure. Not only has Bitcoin it's Wyckoff Accumulation ongoing but also has formed the main channel-breakout on the more local term as well as the upcoming Hash-Ribbons-Signal that has a very high possibility to emerge if you did not see these analyses already where I mentioned these technical developments I highly recommend it to watch to have a full-depth-overview. In this analysis now I am looking at the massive head-shoulder-formation Bitcoin is forming and I examine why a bullish breakout to the upside has a higher possibility compared to the bearish one to the downside.
In such a trend-finding phase in which Bitcoin currently still is it is necessary to do not overspeculate the situation because this can fastly lead to a one-sighted unlogical and idealistic approach. Rather it is highly important to consider the market out of a neutral perspective to elevate what things are possible and what things are clearly not possible. What functioned in the past is repeating patterns that have an empirical meaning and therefore have a high possibility to complete in the present and future again similarly as it happened before. In the last days and weeks highly regulatory measurements came up from societies such as China blocking the Bitcoin development and innovation however it has to be stated that such similar scenarios already happened several times in the past and every time Bitcoin could recover and emerge with new volatilities, in fact as for us as traders volatilities either up or down can provide the proper opportunities to take advantage of.
Bitcoin Structure With MACD Divergence And Formational Development:
As when looking at my chart now the first thing that is important here and meaningful to consider is the fact that Bitcoin is forming this major bearish MACD-divergence in the structure with the lower lows formed in the actual bullish price-action while higher highs emerged in the MACD oscillator. Such a MACD-divergence is a classical divergence and a reliable indication for a solid reversal in the structure. Furthermore, Bitcoin has a symmetrical triangle in the more local structure that I already mentioned previously has a higher possibility to breakout to the upside and with the breakout above the upper-boundary of its descending-channel already developed a further appropriate ground for incoming increased bullishness awaited in the schedule. The right shoulder of the massive head-shoulder-formation already fully completed in the structure and had the same size as the left shoulder in the head-and-shoulder-formation, in relation to this structure now Bitcoin is setting up to form the final head-shoulder-confirmation of which the bullish breakout has a higher possibility.
Upcoming Determinations And Likely Scenarios To Consider:
Taking all these factors into the consideration now it will be important for Bitcoin to elevate how it develops further in the structure here. Likely is that Bitcoin breaks out of the triangle as already mentioned and continues with testing the upper levels of remaining resistance mainly lying within the 41200 USD level marked in my chart in blue. When Bitcoin reaches these zones a pullback has an increased possibility to follow however as Bitcoin has major support zones in the structure determined by the ascending-trend-line in dashed grey and also the 20-EMA above which Bitcoin will be when the breakout happened there is a great likelihood given that Bitcoin stays above these zones and from there on sets up for a new upside-breakout-attempt which will be the crucial factor in this whole situation because when Bitcoin finally manages to break out above the resistance and especially above the descending-trend-line it will be the final completion of the head-and-shoulder-formation to the upside. For now, we should keep patience and look at how the market develops to be prepared for the upcoming volatilities likely to happen.
In this manner, thank you for watching my analysis about BITCOIN and the analysis on why an upside-breakout out of the head-and-shoulder-formation has a much greater likelihood, will be great when you support it with a like and follow or comment, great contentment for everybody supporting, all the best!
"There are many roads to prosperity, but one must be taken."
Information provided is only educational and should not be used to take action in the markets.

BTC intraday 4HBitcoin is currently trading around 33900 close below the 200MA in a rising wedge formation. A short squeeze due to highly negative funding rates seems not unlikely. Previous price action wasn't really exciting. It is not uncommon to get a fake-out on low volume in order to liquidate shorts before a significant move.
Bias: neutral/bearish

Bitcoin, Decisive Triangle, Likely To Complete In The Schedule!Hello,
Welcome to this analysis about Bitcoin, we are looking at the 4-hour timeframe perspectives. Besides the main descending-channel breakout and the validation above the upper boundary that I examined in former analysis, I discovered further interesting signs now that Bitcoin finally forms in the developed structure. When not already seen it is also good to look into the former analysis about this structure to have a full-depth-overview. As it was likely that Bitcoin continues with this sideways correctional shape after the breakout has emerged as expected in this analysis I now look at the particular formation Bitcoin is building in this case and what we should consider in the upcoming developments Bitcoin is likely to show up with.
Structural Developments:
As when looking at my chart we can watch there how Bitcoin developed this main ABC-wave-count to the upside marked in my chart with the grey waves. In this wave-count Bitcoin already almost fully completed the first wave A and is now about to form the next major wave B in the structure that moved into a triangular shape with the boundaries marked in black. In this triangle-formation Bitcoin now forms an ABCDE-wave-count that builds the major wave B in the upside-wave-count. In this triangle wave count Bitcoin already completed the waves A to D sufficiently in the structure and is now finalizing the wave E and therefore the whole wave-count till the completion of the triangle-formation can settle.
Upcoming Determinations:
Taking all these factors into the consideration now Bitcoin will likely complete this triangle within the upcoming times. This will happen with Bitcoin finally closing above the upper-boundary of the triangle and substantially building up above the 100-EMA in red as well as the 20-EMA in green. Such a breakout and stabilization above the important levels will also be the confirmation for Bitcoin to breakout above the ascending-trend-line I already mentioned in previous analysis and therefore Bitcoin will advance in the bullish-development-zone that I marked in green. Currently, it is important to elevate this breakout and when it happens the targets at the blue level will be activated, it will be an interesting journey ahead.
In this manner, thank you for watching my analysis about BITCOIN and the decisive triangle-formation that is forming with the likely breakout to emerge in the schedule, will be great when you support it with a like and follow or comment, great contentment for everybody supporting, all the best!
"The past, like the future, is indefinite and exists only as a spectrum of possibilities."
Information provided is only educational and should not be used to take action in the markets.

BTC, Main Fibonacci-Channel, How The CME-GAP At 49250 Can Fill!Hello,
Welcome to this analysis about Bitcoin, we are looking at the monthly timeframe perspectives. In this analysis I am looking at the broader picture Bitcoin is forming and as I discovered recently Bitcoin in the previously developed bearish pullbacks to the downside moved into significant levels and also formed a decisive structure that can be fuel for the upcoming volatilities ahead of the next times. As already mentioned in the former analysis Bitcoin not only on the 4-hour timeframe perspective is in a Wyckoff accumulation but also forms a potential upcoming Hash-Ribbons Buy-Signal. In this analysis now I am looking at the main Fibonacci-channel structure in combination with the CME-GAP that has developed in the bearish pullbacks and did not yet fill.
Especially in the last months since the beginning of 2021 the Volume of Bitcoin-Futures has substantially increased and reached its peaks at the bullish upthrusts before the markdown followed. Therefore the CME-GAP has even a higher ranking when considering this Bitcoin-Futures Volume increase and the market-movements resulting out of it. In Bitcoin bearish developments to the downside from the 59800 to the 30000 level this major CME Breakaway GAP has formed in the downtrend. In the graphic below I show the CME-GAP.
CME-GAP At The 49250 Level:
In Bitcoins past price-actions and developments such CME-GAPS where a very profound indication for the case that Bitcoin minimum when reversed reaches this CME-GAP level to fill the gap. This is also possible here due to several factors and especially because Bitcoin recently reached this major 50%-61.8% Fibonacci channel which was previously resistance and is now support. Bitcoin also has formed other signs that a bounce to the gap is likely to come up within the next times, therefore a gap-fill in upcoming times can be expected when Bitcoin moves on with the determinations. In terms of the gap-fill and Fibonacci structure, this does not mean Bitcoin is completely 100% bullish however it is a step in the right direction especially when Bitcoin manages to mark above the gap-level after the gap-fill happened.
High Potential Bounce Of The Fibonacci-Channel-Support-Zone In Alignment To Fill The Gap:
Now in consideration of the major CME-GAP that has formed here and in terms of this whole monthly timeframe perspective Bitcoin recently reached this 50% to 61.8% Fibonacci-support-channel that is marked in my chart in orange, it is the Fibonacci-support-channel of the broader Fibonacci-ascending-channel that has its lows at the December 2018 bear-market-bottom as well as the March 2020 corona-breakdowns and has its high at the April 2021 all-time-high. Together with the 12-MA marked in my chart in blue this 50%-61.8% Fibonacci-channel in orange builds strong support as this channel was resistance before and therefore is a bounce from this level highly likely in the upcoming times. Therefore when this bounce develops and Bitcoin moves on with an increase of bullish price-action this will likely fill the CME-GAP in the structure.
What Happens After The Gap Is Filled:
Once the gap is filled as mentioned under the given circumstances this can lead to an initial pullback after the gap is filled and Bitcoin will seek to test the lower supports in the structure. When these supports hold sustainably it can be the source of a bounce and especially after that when Bitcoin manages an increase in bullish price-action when the supports holding sustainably a bounce above the CME-GAP level and a stabilization in this zone as I show in my analysis with the writings can indicate a set up for the main Fibonacci-channel-breakout when Bitcoin manages to stay in these zones. For now, it will be important to keep patient and elevate how Bitcoin can continue ahead of the upcoming times to move on and fill the CME-GAP to show up with the further developments. Will be especially important how Bitcoin manages to approach these zones and how the structure will look like after this.
In this manner, thank you for watching my analysis about BITCOIN and its Ascending-Fibonnaci-Channel Structure in relation to the CME-GAP filling that is likely to come up, will be great when you support it with a like and follow or comment, great contentment for everybody supporting, all the best!
Information provided is only educational and should not be used to take action in the markets.

BITCOIN, Massive HASH-RIBBON Buy Signal Incoming The NEXT TIMES!Hello,
Welcome to this analysis about Bitcoin and its Hash-Ribbon-Structure I recently detected, which is playing an important role in the current movements especially with upcoming price-actions this can lead to a new historical has-ribbon-signal as it was already similarly seen 15 times in Bitcoins past historical price-developments. As Bitcoin in recent times showed up with heavy declines in the structure the regulatory landscape altered and some countries such as China decided to shut down mining completely and ban Bitcoin mining, while there are other countries and governments who are massively regulating exchanges. In this analysis, I will examine the aspect of decreased mining activity resulting out of such measures that are actively affecting the hash rate and the mining capitulation which is the underlying factor in the hash-ribbon indicator I am presenting today.
In technical analysis the best thing is to combine different technical aspects and come up with a final conclusion besides that it is always extremely necessary to keep a clear head and do not take an idealistic view on the market as it is happening oftentimes, this just plays into the hands of the smart money operators and market makers pushing the prices up and down and taking advantage of these gaps in the developments and trapping traders in the market. Therefore, as a sophisticated trader, it is necessary to think in both directions to wage the proper determinations and come up with a final decision rather than over-speculating the market into a one-sighted approach.
The Hash-Ribbon-Indicator:
The hash-ribbon-indicator seen in my charts consists of 3 important technical elements. The first is the hash rate, the hash rate is the amount of computing power which miners are putting into the Bitcoin network to mine Bitcoins. When the hash rate is falling this means that fewer miners are mining Bitcoin within the Bitcoin network and therefore the competition to mine Bitcoins is falling and in the hash-ribbon-indicator, this hash-rate is represented by the different dots (First graphic below). The second element is the hash-ribbons moving-averages consisting of the 30-day hash-ribbon moving-average marked in green and the 60-day hash-ribbon moving-average marked in grey, when the 30-day crosses below the 60-day this means miner capitulation settled and the miners mining Bitcoin decreases as well as the hash-rate decreases while it is the reverse when it crosses above. The third element is the decisive one in the whole structure as it actually marks the final buy-signal with the blue dot, this is when the 10-MA marked in my chart in green crosses above the 20-MA marked in my chart in red which showed the final bulls-signal already in past price-actions combined with the increased mining activity, in this case, it is important that the 10-MA holds above the 20-MA and do not forms a cross-back. In the graphics below I show these elements in action and how they are defined.
Hash-Ribbon Development-Phases Explained:
In this first graphic, you can see the already mentioned elements in the hash-ribbon-indicator explained. With the different stages in the declining to rising hash rate reaching from the actual miner capitulation to the final increasing in miner activity till the buy signal is developed marked with the dots in a different color. What is important is also the stages in the hash-ribbons moving averages as well as the price-action moving averages.
One Example With The Stages-Examinations Out Of The 15 Historical Hash-Ribbon-Signals:
In this second graphic, you can see how the hash-ribbon signal exactly indicated the ongoing expansion phase. Beginning in May 2020 the miners capitulated resulting in the decreasing hash rate and the incoming grey dot, after that, the hash rate declined further till mining activity increased again, and on the 23rd June reached a level in which the mining activity moved into normal levels again. This held till the final buy signal emerged at 12 July 2020 with the 10-MA finally crossing above the 20-MA and holding above it with no cross-back.
The Present Ongoing Hash-Ribbon-Signal-Phase With The Important Structures To Consider Currently:
As seen in the third graphic now Bitcoin is in the next historical hash-ribbon-signal-phase and what is significant in this phase is that the mining activity severely recovered in the past times till the next declines in mining activity followed up, this can be contributed to the fact that China shutdown on Bitcoin mining and that in this case, the closing of mining activity came in waves similar to the other regulatory measurements in other countries as well affecting the Bitcoin mining contribution. Besides that, the several continued increases in mining activity also indicate an increased demand for mining during the volatility. Now Bitcoin is still in the miner capitulation phase with a declining hash rate as it is shown in my chart, this can possibly change in the upcoming times when mining activity increases again as the miners that left China building up their mining activity in more supportive places the mining activity and therefore hash rate can rise again similarly as it was in the past with this major hash-ribbon-signal.
What We Should Consider Now:
In past price-actions it was always often seen that the hash rate and mining difficulty decreased moving into the hash-ribbon-signal-phase as explained, this was also the case with the declines seen in the last times and especially fueled by countries such as China shutting down on Bitcoin mining. The miners that leaving China now will settle into other countries where the mining activity will increase again, it was already reported that many moved into the US in states such as texas with a supportive Bitcoin Mining Policy. Taking this into the consideration and especially with the other technical factors I already mentioned in the previous analysis it is likely that mining activity will increase again in the next times pointing to the green dot in the hash-ribbons indicator. Furthermore, Bitcoin on the weekly is developing this main declining bearish momentum which is an increased reversal sign. These factors can be fuel for the next hash-ribbon signal.
In this manner, thank you for watching my analysis about BITCOIN and the meaningful importance of its Hash-Ribbon-Indicator-Structure, have a great day as well as the weekend, will be great when you support it with a like and follow or comment, great contentment for everybody supporting, all the best!
Information provided is only educational and should not be used to take action in the markets.

Bitcoin, More Likely Breakout Developed, Further Determinations!Hello Traders Investors And Community,
Welcome to this Update-Analysis about Bitcoin on the 4-hour timeframe perspective. As expected Bitcoin now finally moved on with the more likely breakout above the upper-boundary to initially test the main ascending-trend-line in black and pull-back from there to confirm the breakout now which was expected. If you did not see this analysis already I highly recommend it to watch as this analysis is building a coherent follow-up to the previous one. The formational structure Bitcoin developed here gets very interesting shapes and as the more possible breakout above the boundary now emerged as suggested I detected further signs that will be decisive for Bitcoin in the upcoming developments.
Structural Development:
As when looking at my chart now Bitcoin rightly formed the breakout above the upper-boundary of the descending-channel-formation marked with the blue circle, after that Bitcoin moved on and tested the upper-boundary of the ascending-trend-line from where it pulled back as supply still remained in this zone price-action moved on and is now testing the upper-boundary where the previous breakout emerged. Overall the breakout above the upper boundary was the setup now for potential further continuations however therefore it is necessary that Bitcoin manages to build up further strength in this structure and complete a possible continuation-formation from where it can show the determined continuations.
Upcoming Determinations:
This formation can move into the shape of a similar formation like a symmetrical wedge as it is marked in my chart with the coherent wave-count within. After that when Bitcoin manages to complete such a formation in the structure and form a breakout above its upper-boundary to close there this will lead to further testing of the remaining upper-resistance. For now, it is highly important to elevate how Bitcoin develops here as this formation can also still invalidate and Bitcoin moving on to test lower level nevertheless it is necessary to do not rush into set conclusions and overspeculate the market into a one-sighted direction before further information about the continued directions is given.
In this manner, thank you for watching my Update-Analysis about BITCOIN and what to expect after this more likely main upside-channel-breakout has finally shown up; will be great when you support it with a like and follow or comment, great contentment for everybody supporting, all the best!
"The past, like the future, is indefinite and exists only as a spectrum of possibilities."
Information is only educational and should not be used to take action in the market.

Bitcoin Breakout so Ready to $45000 ..?#BTCUSDT TA update:-
$Bitcoin currently trading at $35500
As per chart now breakout resistance.
And My target will be $45000 if thia time not Fakeout.
Because last time BTC dumped after breakout.
Keep an eye support also.
Support:- $34500/$29500
Resistance:- $45600/$49700

BTC Bounce Of 2-Year Old Line Indicates Potential Dynamic-Shift!Hello Traders Investors And Community,
As Bitcoin, the last times moved on within the local range between 29500 and 40500 I detected some very interesting structures Bitcoin is developing here on the 2-day timeframe perspectives. As already mentioned in the former analysis that I upload yesterday Bitcoin on the 4-hour timeframe perspectives had the higher possibility to break out of its local channel to the upside which now happened as expected and as this moved on Bitcoin has a higher possibility to continue with the bullish alignment firstly on the 4-hour timeframe when it also manages to break out above this crucial ascending-trend-line, if you did not see this analysis already I highly recommend it to watch as this analysis now is coherently following-up on it on the more global 2-day timeframe.
When looking at my chart now we can watch there how Bitcoin has developed this major ascending-channel-formation marked with the boundaries in black and drawn from the low of December 2018 to the high of the bullish developments in June 2018 till the breakout happened in December 2020 after which Bitcoin showed up with further heavy spread and volatility to the upside till the preliminary high was formed at 64800 before Bitcoin heavily pulled back and moved on to test the lower levels in the structure, and especially here comes the interesting part as Bitcoin has strong support within the upper-boundary of this giant channel it recently managed to bounce from this almost 2-year ascending upper-boundary.
Bitcoin not only has the 2-year old ascending upper-boundary trend-line where it bounced recently initially but also the decisive 200-EMA which is marked in my chart in blue, together with the trendline this zone around the 30300 level has built a solid confluence-zone and the bounce from this zone is indicating that Bitcoin has the ability to move on to test further structures at the upside. The first important resistance, in this case, is the 100-EMA which is marked in red in my chart, when Bitcoin moves into it will either result in a pullback or Bitcoin will have the ability to stabilize in this zone to set up and breakout above the 100-EMA. Such a breakout will lead to Bitcoin increasing bullishness further and the main remaining structural resistance which is marked in red will be tested.
If Bitcoin has the ability to increase the demand in such a way that the further tests in the structure as seen marked in my chart will not be an issue this does automatically mean Bitcoin is completely bullish from that point on as especially when it moves into the strong remaining resistance zone a more increased bearish pullback can still take place which should not be underestimated however Bitcoin with the upper-boundary of its massive ascending-channel has still serious support overall in this structure from where it can built up, how Bitcoin moves into these zones need to be seen then after Bitcoin has shown the proper capability to test these significant resistances.
In this manner, thank you for watching my analysis about BITCOIN and the decisive bounce from the 2 year old trendline to how this will affect the upcoming destinations, will be great when you support it with a like and follow or comment, great contentment for everybody supporting, all the best!
Information is only educational and should not be used to take action in the market.

Bitcoin, Channel Breakout Emerges When This Scenario Validates!Hello Traders Investors And Community,
Welcome to this analysis about Bitcoin, we are looking at the 4-hour timeframe perspectives. As already mentioned in previous analysis Bitcoin has a higher potential possibility given to move on testing important remaining resistance-zones that rely in the structure. In this case now on the more local timeframe perspective I discovered an interesting structure forming here from which Bitcoin has the ability to build up and validate this scenario as the bearish scenario possibility is still there however it is definitely smaller than the bullish scenario possibility. Therefore I detected the important levels and what we should consider with Bitcoin within the upcoming times.
Structural Developments:
As when looking at my chart we can watch there how Bitcoin has formed this massive descending-channel-formation marked in my chart with the blue boundaries. Within this channel Bitcoin recently bounced in the lower boundary and is now forming this neutral decision-zone between the upper and the lower boundary from where it will form a breakout sooner or later. Basically, there are two possible scenarios for a breakout, the first is that Bitcoin increases with demand in the structure and manages a breakout to the upside leading into the bullish-development-zone and the second is Bitcoin continuation with bearish pressure moving into the bearish-continuation-zone, as the market is oversold now the bullish case has a higher possibility by 60%.
Upcoming Perspectives:
Now as a bullish breakout has somewhat of a higher possibility this does not mean that as a trader we should just rush into the market and expect the wishful scenario to happen, in these cases, it is always important to keep patient and wait for the right confirmation before moving into the market. Bearing this in mind it is necessary to elevate either the bullish breakout with a final close above the upper boundary or the bearish breakout with the close below the local ascending-trend line which is within the descending channel. After these assumptions have been made the further determinations can be objected and planning in this direction can happen appropriately. It will be an important development ahead.
In this manner, thank you for watching my analysis about BITCOIN and its current channel structure with the likely scenarios to expect in the upcoming times, will be great when you support it with a like and follow or comment, great contentment for everybody supporting, all the best!
Information is only educational and should not be used to take action in the market.

BNBUSDBNB is ranging between 272$ and 450$ and has formed a double bottom pattern . this a good bullish pattern so this means there is a chance for bulls from this point. also there is a Regular bullish Divergence (+RD) on MACD as well which is quite good for bullish runs!
Traders, if you liked this idea or have your opinion on it, write in the comments, We will be glad.
Thank you for seeing idea .
Have a nice day and Good luck

ADAUSDADA started pushing up after retesting from its resistance zone . This resistance zone also confluening with downtrend line. $1.28 - $1.70 is the local support level . If broken then price can easily test around $1
If you liked my idea, follow me for more.
Always engage with TP for strong support.
