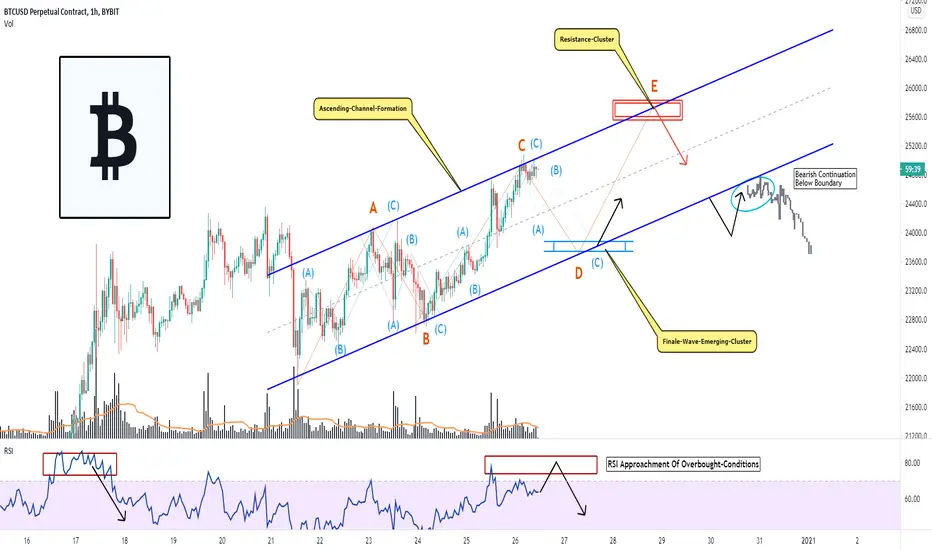
Bitcoin, Trading In The Channel, Why Next Steps Will Be Crucial!Hi my friends,
Welcome to this analysis about Bitcoin, we are looking at the 1-hour timeframe perspective. Bitcoin since it managed to breakout above the 24000 USD level has pulled back and confirmed a new bounce to the upside, as I discovered now Bitcoin is forming a decisive formation that will be the determining source within the next outcomes that should not be kept by side for now, therefore I detected all the important levels and likely scenarios we should consider here.
As when looking at my chart we can watch there how Bitcoin is developing this ascending-channel-formation marked in blue in my chart with the coherent wave-count established within the formation and waves A to C already completed, currently Bitcoin is testing the upper boundary of the channel which is likely to show up with a pullback and the next wave D to protract from there, this wave D will run into the lower final-wave-emerging-cluster marked in my chart in blue from where the wave E has high potential to originate, this wave then will run into the upper resistance-cluster marked in my chart in red which is also a Fibonacci-extension from the former wave. Basically, the decisive moves will develop from there because when Bitcoin shows up with a strong bearish rejection and moves into the lower boundary anew this can lead to a breakout of the channel to the downside which will increase bearishness and point to lower levels, also when looking on the overbought conditions Bitcoin is moving into this scenario should not be underestimated.
Bitcoin the last times reached high levels and moved into strong upside volatility with all-time-high regions reached seen never before, in such market-situations it is important to do not overspeculate the market as it is happening to often and keep the reverse in mind as it is not seldom seen that the market is setting up for a bigger pullback when such extreme conditions are reached similarly as we have seen it in the past especially within the high volatile cryptocurrency market.
In this manner, thank you for watching the analysis, have a great Christmas and upcoming Happy New Year's Eve, many thanks for all people supporting this year, all the best!
"There are many roads to prosperity but one must be taken."
Information provided is only educational and should not be used to take action in the markets.
Bitcoin-trading
Bitcoin, Amazing Breakout, How A Continuation Can Establish!Hi my friends,
Welcome to this analysis about Bitcoin, we are looking at the 4-hour timeframe perspective. Bitcoin recently has shown up with an amazing breakout to the upside moving above important resistance zones and establishing a bullish pace to validate this initial bullishness now it is important for Bitcoin to show up with the proper price-action, when this happens it can increase worthwhile potentials, therefore I detected all the important levels and likely outcomes we should consider.
As when looking at my chart we can watch there how Bitcoin just developed this volatile bullish move above the 24000 USD level up to the high at 24600 from where Bitcoin now firstly has shown up with a pullback which is normally after such a breakout as price-action moves to the breakout-origins to confirm it. What is important here, is the descending-trend-line determined by the previous highs in the structure, this descending-trend-line was actually the reference-point for the bullish breakout and now it is building some important supports together with the 25-EMA in green and the 35-EMA in red Bitcoin formed this major support-layer marked in my chart with the blue back-up-cluster, this is the zone where Bitcoin needs to bounce decisively and move up on higher from there otherwise when this does not happen and Bitcoin moves below the cluster this will mainly invalidate the bullishness and point to lower levels, in this case, it is inevitable for Bitcoin to bounce from the zone to consider a solid bullish continuation.
Bitcoin has moved in an interesting structure where it has established a good bullish edge, to increase this edge and show up with further bullish possibilities Bitcoin has to validate it with the right price-action this is why we need to keep patient and elevate how Bitcoin reacts within the back-up-cluster and how the prospected bounce from there can establish as suggested, when this happens new conclusions can be made, it will be an interesting development and journey ahead.
In this manner, thank you for watching the analysis, have a great Christmas and upcoming Happy New Year, many thanks for all people supporting this year, all the best!
"Good luck is when opportunity meets preparation."
Information provided is only educational and should not be used to take action in the markets.

Bitcoin, Forming Potential Bear-Flag, Here Is What To Consider!Hi,
Welcome to this analysis about Bitcoin, we are looking at the 30-minute timeframe perspective. Since Bitcoin formed this significant bull-trap yesterday after moving above the 24000 level and pulling back to previous zones with an emerging impulse it is forming an interesting formation now that will be the determining source within the upcoming times, therefore I detected all the important levels and likely outcomes we should consider here.
As when looking at my chart we can watch there Bitcoin is about to develop this channel-formation with the boundaries marked in blue and a coherent wave-count establishing within the formation, often it is case that such formation complete bearishly to the downside which confirms the formation as a valid bear-flag and points to lower levels in the structure. Currently, the wave-count is still forming in the channel with the waves A to C already completed and now Bitcoin with setting up to form the waves D and E with the major resistance within the upper-boundary determined by the resistance-cluster marked in red in my chart where Bitcoin has a high likelihood to complete the wave-count and be the origin for the decisive pullback to the downside, when this pullback protracts then and moves below the lower boundary of the channel it will be confirmed as a bear-flag.
The next times will show how Bitcoin moves on to finalize this formation and considering the more likely bearish perspective it is nevertheless urgently necessary to keep patient and wait on the proper validation otherwise when Bitcoin manages to stabilize above the boundary this can move Bitcoin into invalidating the more likely bearish scenario, therefore we need to elevate and look for the right confirmations to show up in the schedule.
In this manner, thank you for watching the analysis, have a great day and weekend, all the best!
"Trading effectively is about assessing possibilities, not certainites."
Information provided is only educational and should not be used to take action in the markets.

Declines Follow When BTC Completes This Massive H-S-Formation!Hi my friends,
Welcome to this analysis about Bitcoin, we are looking at the 4-hour timeframe perspective. As Bitcoin showed up last times with initial bearish volatility to the downside on the local timeframes this is actually matching to a more global bearish perspective as I discovered, Bitcoin is forming a crucial formation that can be the source of protracted volatility to the downside which should not be underestimated or kept by side especially as Bitcoin is more over already trading in overbought regions, therefore detected all the important levels and likely perspective we should consider with Bitcoins established structure and the upcoming movements ahead.
As when looking at my chart we can watch there how Bitcoin is about to form this major head-and-shoulder-formation marked in my chart with the blue neckline, the left shoulder, as well as the head already completed and now, is Bitcoin about to develop the right shoulder that is likely to finalize this whole formation which will happen when Bitcoin increase with bearishness further from the point it is now and building up on this initial bearishness we have seen before, when this happens and Bitcoin finally moves below the neckline to close there this will finalize the whole head-shoulder-formation and activate lower levels in the structure.
Upcoming times when Bitcoin increases with bearish pressure further from here and complete this whole formation targets will be determined seen in my chart within the blue level and the support lying there from the previous all-time-high that was resistance and is now support, this is actually also a good zone for Bitcoin to stabilize and back-up to test upper resistances anew however when Bitcoin does not hold this level sustainably after moving into it and when Bitcoin increases bearishness further this will lead to more downside action when Bitcoin closes below the ascending-support-line that is crucial to hold sustainably building up from there.
Taking all these factors into consideration Bitcoin has a serious possibility to show up with these protracted and exaggerated bearishness further upcoming times however it is inevitably important to do not rush into trades here and wait for the right confirmations below the neckline of the formation because it sometimes happens that such formations breakout to the upside with a stabilization above the neckline and then continuation to the upside this is why we should keep patient here to do not overspeculate the market as this is happening to often these days and look for the proper validations under the given circumstances suggested, it will be an interesting journey ahead.
In this manner, thank you for watching the analysis, have a great day and weekend, all the best!
"Prospect is the ingredient of good fortune."
Information provided is only educational and should not be used to take action in the markets.

#ETH #Ethereum #Analysis for next hoursAfter breaking the S / R level, returning to the bullish triangle from the previous move, it has entered a descending channel.
According to market sentiment, we could see a breakdown of the channel to the upside until it reaches the S / R $ 630 level again.
In the case of continuing in the descending channel, it could find the dynamic support of the triangle and bounce upwards. As always, a stronger correction could occur, although we believe this is unlikely under current conditions.
The decline in the market of previous hours, we do not believe that it is a downtrend, but we feel that it is a natural correction to continue the uptrend.

XRPUSD, Breakout As Expected, Likely Perspectives Now!Hi my friends,
Welcome to this update-analysis about XRPUSD, we are looking at the 1-hour timeframe perspective. The decisive triangle-formation I mentioned previously rightly completed in the schedule and XRPUSD moved below the lower boundary of the triangle before showing up with strong exaggerated bearish price-action to the downside to the point where it now moved into the prospected supports which are actually crucial for the further developments. If you did not see the origin-analysis I highly recommend it to watch to have a full-depth-overview as this analysis building coherently up on the previous one, therefore I detected all the important levels and likely outcomes we should consider with XRPUSD now.
As when looking at my chart we can watch there XRPUSD just moved into the 61.8% Fibonacci-level and somewhat below it where it showed up with an initial bullish bounce however this bounce, for now, is too marginal to really indicate a reversal here therefore it is important for XRPUSD to increase with bullish price-action from this point and finally move above the local resistance marked in my chart with the red dashed lines, when XRPUSD manages to move above this level and hold above it sustainably this will indicate further bullishness and remaining upper resistance-zones to be tested anew. When XRPUSD does not manages to move above the local resistance and stay there as suggested instead XRPUSD increases with bearishness further and moves below the ascending-trend-line marked in my chart in dashed grey this will lead to further bearish pressure and visiting of lower levels as XRPUSD will also develop the wave-C-extension.
What is of high importance now in this structure XRPUSD formed here is to wait on the proper alignments before moving into the final direction, currently, the bullish stabilization can be preferred over the bearish continuation however this need urgently to confirm as mentioned before moving into the right direction, therefore it is from necessary that we stay patient and move with the market when the proper opportunities show up under the given circumstances, it will be an interesting journey ahead.
In this manner, thank you for watching the analysis, have a great day and weekend, all the best!
"The eyes only see what the mind is ready to comprehend."
Information provided is only educational and should not be used to take action in the markets.

Bitcoin, Completed Decisive Formation, Possible Scenarios Now!Hi my friends,
Welcome to this analysis about Bitcoin, we are looking at the 1-hour timeframe perspective. Recently Bitcoin completed a major decisive formation that has shown up with strong bearish movements to the downside which should not be underestimated here especially as the reversal happened swiftly and with strong volatility as well as volume there are however possibilities for recovery when Bitcoin manages to show up with the proper price-action otherwise it is important to keep a possible bearish continuation and extension in the back-mind, therefore I detected all the meaningful levels and likely outcomes we should consider.
As when looking at my chart we can watch there how Bitcoin moved into this strong descending-trend-line marked in black and formed by the past price-action, this trendline Bitcoin firstly confirmed as support and bounced from there, just slightly below is the 200-EMA, the fact that Bitcoin has some significant supports within this zone in which the ascending-trend-line is also adding into makes it a zone where Bitcoin has the potentials given to form a recovery nevertheless it is from high importance that Bitcoin also confirms this and shows up with the proper price-action to validate a possible back-up, otherwise when this does not happen and Bitcoin increases with bearishness further Bitcoin will move into a wave-C-extension when moving below the support-cluster marked in my chart in blue, when Bitcoin moves below these levels this will increase bearish pressure and lead into the wave-C-extension-zone pointing to lower levels.
The next times will be extremely crucial here as they will show if Bitcoin has the strength to recover within the structure or it firstly visits lower levels, therefore it is necessary to wait for the proper confirmations in each of these cases, the bullish recovery can show up when Bitcoin manages to bounce strongly within the zone with god volume, a bounce from the 200-EMA will be the best in this case, otherwise when this does not happen and the bullishness decreases further a definite close below the blue support-cluster will indicate the wave-C-extension and protracted bearish pressure ahead, these are the two major scenarios that need to be considered in the near future determining Bitcoins further destinies.
In this manner, thank you for watching the analysis, have a great day and weekend, all the best!
"There are many roads to prosperity, but one must be taken."
Information provided is only educational and should not be used to take action in the markets.

Only Few Steps To Fully Validate Bitcoins Continuation-Setup!Hi my friends,
Welcome to this update-analysis about Bitcoin, we are looking at the 30-minute timeframe perspective. Since the last analysis, I published according to this subject on the 30-minute timeframe Bitcoin managed to bounce greatly from the breakout-origin-cluster mentioned and from there on tested the upper-boundary of the major flag-formation to pull back from there and move into the EMA-structures determined, if you did not see this analysis already I highly recommend it to watch to have a full-depth-overview as this analysis is also building coherently on it. Now as all these important price-actions happened there are basically necessary steps for Bitcoin to conclude the final bullish breakout-setup and when Bitcoin shows up with these price-actions this can lead to further bullish potentials ahead, therefore I detected all the important levels and likely outcomes we should consider here.
Structural Developments:
Now as Bitcoin managed to test the upper boundary of the flag-formation Bitcoin pulled back after this shows up and moved into the 65-EMA in green and the 85-EMA in red where Bitcoin has important supports together with the middle-line of the flag-formation, what is also necessary to evaluate here is the fact that Bitcoin is building this support-cluster marked in blue in my chart which is very inevitable to hold and bounce because Bitcoin will increase with bearish price-action when moving below it and such measurements can indicate further bearishness and lower levels to be reached as Bitcoin will move below the volume-supports determined by the volume profile. Also, the two confirmational zones are meaningful reference-points as Bitcoin will show with the final conclusion when either moving into the bull-flag-confirmation-zone or the bullish-invalidation-zone of which the bull-flag-confirmation-zone is still more likely however the bullish-invalidation-scenario, for now, should not be kept by side here.
Upcoming Perspectives:
Bitcoin is in a situation where it has formed some solid price-actions and formational structures that can show up with proper potentials further when Bitcoin shows up with the proper alignments and develops under the suggested circumstances. When this happens and Bitcoin manages to bounce anew in the structure with the right strength to move above the upper-boundary such price-actions will point to the final breakout confirmational setup above the upper boundary as it is marked in my chart and this will activate upside targets higher in the structure. It is certainly possible to enter the market aggressively right away before confirmation has occurred however the best way is to wait on the final breakout-setup before entering the market better than running into trades that do not satisfy. It is great to see us in the channel realizing and securing profits the last time. We will see where the market is heading the next time under prospected possibilities, it will be an interesting journey ahead.
In this manner, thank you for watching the analysis, have a great day and weekend, all the best!
"Prospect is the ingredient of good fortune."
Information provided is only educational and should not be used to take action in the markets.

Bitcoin MAJOR UpdatePlease review the current price action of BTC.
1. Bitcoin is still in the Ascending Channel
2. Just broke out of a small bull flag looking to test higher levels
3. Top of the Channel (Red Line) is formed from the bottom support from Bitcoins lowest levels.
4. The top of the Channel is prices at 28-30K
5. Fear & Greed index is at an ATH.
6. Do NOT buy here
7. Expect a 20-40% Correction in the near future
8. Possible Alt Season During Correction - but not confirmed yet
Forming another leg up but the trend will end soon.

Bitcoin, Why This Move Was So Important And Where Target Holds!Hi,
Welcome to this analysis about Bitcoin, we are looking at the 6-hour timeframe perspective, the recent events, the current formational structure, the important confirmations we have seen lat times, the confirmations following, and where the market is supposed to have its destinations. As Bitcoin has shown up with this exaggerated exponential price-explosion bullishly to the upside Bitcoin moved above major resistance zones, managed to fully emerge within the new all-time-high zone, and very importantly validated several reference-points on this way that I discovered, therefore we are looking at all the significant zones and likely outcomes the next times.
As when looking at my chart we can watch there how Bitcoin emerged with this strong upside breakout above the boundary of its previous established ascending-channel-formation, this breakout was also matching with the developed wave-count and the coherent wave-E-extension still going on with the origin within the channel-breakout. Besides that Bitcoin is building a similar bull-flag like it has already done once before in this structure which formed before the final channel-breakout shown up. Furthermore, the channel-breakout activated the major target at 25.000 USD as it is marked in my chart which will be reached when Bitcoin completes this second bull-flag.
Taking all these factors into consideration we can expect the final wave E within the wave-E-extension to contribute next times when Bitcoin moves above the upper-boundary of its second bull-flag and closes there, such price-action will point to the final target as it is shown in my chart. What should be considered when Bitcoin approaches this level is that there is a higher possibility for a first initial pullback given as Bitcoin is somewhat overbought and the wave-counts ending this can lead to a pullback from this target back to the bull-flag-zone again after that has formed the market has to be elevated anew and if the continuation can set in right away or Bitcoin firstly tests the lower support zones.
In this manner, thank you for watching the analysis, have a great day and weekend, all the best!
"There are many roads to prosperity but one must be taken."
Information provided is only educational and should not be used to take action in the markets.

Will BTC repeat 2019 year scenario?Today we noticed very interesting coincidence about BTC price movement.
We have it's behavior near the 2019 HH on the left part of the chart.
There was almost the same price pattern: the massive growth, dump to the CRP monthly level, huge pump to the Pivot R1, R2 and R3 levels and after the pullback scenario.
It is obviously that now the BTC price is in the bubble and it will burst sooner or later. Here we have a possible interesting idea of new ATH price. It is assumed to be at almost $28000, but we set the last target at $26000 because the price has a great volatility near the HH. But the price should to break up the privot R2 level first to move to R3 level.

Bitcoin Now Fully Emerged With The A-T-H, Crucial Scenarios!Hi,
Welcome to this fundamentally important update-analysis about Bitcoin on its 4-day timeframes perspective. Bitcoin now fully emerged with the all-time-high and closed within the new-high-region which was necessary to show up with because otherwise when Bitcoin pulled back from that level again as it did before several times this would have indicated a new bull-trap and therefore not the finalization of the new-high-region as we have seen it now, the fact that Bitcoin showed up with strong upside volatility validated it now this puts Bitcoin higher in the news and it gets more attraction from retailers as well as smart money coming into the market building a solid ground for further continuations to the upside as these historical price-actions shown up this can mix up to a healthy environment, therefore we are looking at all the important levels and likely perspectives we should consider with Bitcoin.
When looking at the current formational structure and the novel developments, I would also recommend watching the previous analysis to have a full-depth-overview if you did not do it already, this would take important factors and informational input apart. Now as Bitcoin has shown up with all the decisive price-action prospected previously and the market is somewhat overbought we can expect a pullback to emerge sooner or later which will move into the accumulation-zone marked in my chart in orange, this zone was also previously resistance and is now support and we can expect a great bounce within this level when Bitcoin visits it as smart money and also retailers waiting to enter the market, besides that there is waiting for money on the sidelines from people cautious from the early stages within the pandemic and the resulting declines, this fresh money moving into the market is indicating a stable bullish environment.
Overall Bitcoin has established great structures here as it surpassed the possibility for an immediate bull-trap we can expect the continuation to move on when Bitcoin also validates the lower accumulation-zone as suggested. The complete breakout activated the middle-term-upside-target-zone marked in my chart with the blue level, this level is likely to reach in the schedule within the next times when Bitcoin moves on, currently, the likelihood for a bearish reversal and increase of bearishness is not that high it is more to expect that we will see a bigger reversal incoming when the higher levels are reached and the market is more overbought than already within the current situations. Also important here is to note that not every cryptocurrency has shown that strong volatility to the upside while the major Bitcoin show up with these movements this manifests a rising in bitcoin dominance possibly to increase when the bullish pace holds on further.
In this manner, thank you for watching the analysis, have a great day and weekend, all the best!
"Good luck is when opportunity meets preparation."
Information provided is only educational and should not be used to take action in the markets.


Bitcoin, Since Exaggerated Bullishness More Room Moving Forward!Hi my friends,
Welcome to this analysis in which we are looking at Bitcoin's fundamental recent events, the current formational structure, and what to expect within the upcoming times here therefore we are looking at the 30-minute timeframe perspective. The new all-time-high region fully confirmed now and Bitcoin has shown up with strong upside volatility almost exploding within the new region, therefore I detected all the important levels and likely outcomes we should consider here.
As when looking at my chart we can watch there Bitcoin now builds this channel-formation determined as a bull-flag with the boundaries marked in blue, such a formation can show up with great potentials when it completes righty. Besides that Bitcoin is forming this coherent wave-count within the formation already completing waves A to C and now setting up to form the further waves D and E with the final wave E ending within the lower-boundary and the breakout-origin-cluster marked in my chart in blue which is also matching with the 35-EMA in green and the 45-EMA in red and therefore has great possibilites to bounce properly when Bitcoin visits this area. When Bitcoin shows up with the right price-action here and completes the wave-count rightly to bounce strongly this will point to the breakout and proper setup as it is seen in my chart, in this case it is from high importance that Bitcoin does not move below the lower-boundary again as such price-action will validate the flag as a fake-bull-flag however this is at the moment a quite marginal possibility.
Bitcoin is in a situation where it has still room to move higher when the formation forming develops under the suggested circumstances especially after such strong movements it is not seldom seen that the market continues with such a pace till supply is entering anew which should be considered firstly when Bitcoin reaches the upside targets after the flag completed, for now, we need to see and look how the flag completes, it will be an interesting journey ahead.
In this manner, thank you for watching the analysis, have a great day and weekend, all the best!
"Good luck is when opportunity meets preparation."
Information provided is only educational and should not be used to take action in the markets.

BTC/USD local work from reversal zones 4h Past trading idea 9,6%BTC / USD local work from reversal zones. Timeframe 4 hours. The logic of work is shown in the graph.
Pay attention to what most do not see. Work from the situation, not what you would like.
Past trading ideas
BTC / USD Local work 4 hours. Symmetrical triangle. 16
+ 15% from the entry zone with the breakdown of the symmetrical triangle
BTC/USD Local work. Symmetrical Triangle. Decoupling Soon
+7.2%
BTC/USD Local work. Important area. The fate of the trend.
There is a breakdown of the downtrend of the former local triangle, from the entry point already + 9.6%

Bitcoin, Next Bull-Trap Possible When This Zone Approached Anew!Hello Traders Investors And Community,
Welcome to this fundamentally important analysis about Bitcoin, we are looking at the 2-hour timeframe perspective, the recent events, the current formational structure, and what we can expect the next times. As seen in the past after Bitcoin moved into the new all-time-high zone it has shown up with heavy bearish declines to the downside which was expected when the swift pullback set in as Bitcoin has shown up with it, Bitcoin had to stay above the all-time-high and close there and as this does not happen the bearish pressure came in and increased to visit the lower levels, at the moment Bitcoin is in a very similar situation where it is forming price-action that can indicate a similar swift reversal and pullback to the downside minimum to test lower supports, this is why we should not underestimate a next bull-trap moving in here and also be prepared for this case, therefore I detected all the important levels and likely perspective we should exemplify with Bitcoin in its developed structure and the upcoming outcomes ahead.
As when looking at my chart we can watch there how Bitcoin is about to build this ascending-wedge-formation which is normally known as a bearish reversal formation indicating the reversal when the formation completes, at the moment this formation is held to the upside by the 20-EMA marked in my chart in grey and Bitcoin also developed this coherent wave-count within the formation already completing waves A and B after which Bitcoin is now about to form the next wave C which will lead into the remaining upper-resistances and when these are visited Bitcoin is likely to follow up with the next waves within the wave-count, the crucial point will come when Bitcoin finishes with this wave-count and the last wave E which will run directly into the bull-trap-zone marked in my chart in red where Bitcoin has this strong resistance-cluster leading into several major resistances and therefore is likely to form a new bull-trap when visiting this zone similar to the past ones. When Bitcoin then finally moves below the lower-boundary as it is marked in my chart the bearish pressure will increase and Bitcoin will point to the lower-levels determined minimum at the 18700 level. For now, we should keep patient and register this possible swift bull-trap coming up in the near future to do not get overwhelmed when it finally sets in.
In this manner, thank you for watching the analysis, have a great day and weekend, all the best!
"Prospect is the ingredient of good fortune."
Information provided is only educational and should not be used to take action in the markets.

BITCOIN in a TRIANGLE. Buy from SUPPORT!
Hello, Traders!
BTC-USD is trading in a triangle pattern
And I think this is a bullish triangle
So even if Bitcoin falls to the support
It will go Up from there
Thus: Long from support!
BUY!
Like, comment and subscribe to boost your trading!
See other ideas below too!

Bitcoin, Is Building Major H-S-Formation, Upcoming Scenarios!Hi my friends,
Welcome to this analysis about Bitcoin, we are looking at Bitcoins 12-hour timeframe perspective, the recent events, the current formation forming, and what we can expect the next times ahead. For now, it is important that we elevate that Bitcoin is still trading in an indecisive range since it formed the bull-traps above its all-time-high, this is why a confirmation to the up or downside will happen sooner or later and validate the further movements, besides that, I discovered a decisive formation Bitcoin is establishing here which will be the leading source in the upcoming finalization of confirmation in the proper direction, therefore I detected all the important levels and likely outcomes we should consider with Bitcoin in its current structure and the upcoming perspectives ahead.
Structural Developments:
As when looking at my chart we can watch there how Bitcoin has moved on with this major head-and-shoulder-formation marked in my chart in orange with the blue neckline, Bitcoin already fully completed the left shoulder and the head and is now about to form the right shoulder which will finalize the whole formation and therefore point to the proper breakout. Besides, that Bitcoin has supports lying within the 45-EMA in green, the 55-EMA in red, and the neckline where Bitcoin is building the decision-zone marked in my chart with the orange box. What is also important in this structure here is the upper-resistance and the lower-support which are the crucial reference points for each direction to confirm as it is marked in the chart also.
Upcoming Perspectives:
Taking these technical factors into consideration, in upcoming times we can expect a pullback as it is marked in my chart as Bitcoin is approaching the still remaining strong upper-resistance layers, this pullback will also coherently match with the head-and-shoulder and right shoulder forming and this pullback will move into the decision-zone from where either the bullish or bearish confirmation shows up, the bullish one is at the moment the more likely one with a possibility of 65% compared to the bearish with a possibility of 35%. Each of these confirmations will show up above the reference zones as marked in my chart and for now it is important to keep patient and wait on the full validation before moving into the confirmed direction.
In this manner, thank you for watching the analysis, have a great day and weekend, all the best!
"There are many roads to prosperity, but one must be taken."
Information provided is only educational and should not be used to take action in the markets.

RSI Bollinger Bands- nailing reversalsWHAT IT IS:
Moving averages of RSI are multiplied by Fibonacci harmonics to create "RSI Bollinger Bands."
EFFECT:
RSI bouncing off these Bollinger Bands (BB) predict reversals. Explained below:
1. When RSI touches the green multiples, it is overbought/oversold on the LTF.
2. If RSI touches orange multiples, it is EXTREMELY overbought/oversold on the HTF (don't miss out on these).
HOW IT WORKS:
The green pair of MAs are 1.141 and 0.786 which form the LTF signals. The lines restrict quick movements which aids in day-trading and scalping.
The orange pair of MAs are 1.272 and 0.618 which from the HTF signals. The liens restrict large movement which aids in swing trading and spot investing.

Here Is What To Expect From Bitcoin Since This Key Validation!Hi my friends,
Welcome to this update-analysis about Bitcoin on the 6-hour timeframe perspective, we are looking at the recent events, the established structural formations, and what we can expect in the upcoming times. As suggested in the previous analysis there existed two possible scenarios for Bitcoin after it visited the major decision-zone and as now seen Bitcoin completed the first scenario S1 as it managed to bounce within the decision-zone and finally move above the descending-resistance-line with this decent move. If you did not see this analysis I highly recommend it to watch to have a full-depth-overview. Now as Bitcoin validated this scenario it moved on to test the resistance and this is actually crucial in this structure as there is still paramount resistance above, therefore I detected the important levels and likely outcomes we should consider with Bitcoin in its established structure and the upcoming movements.
As when looking at my chart we can watch there how Bitcoin now reached the S1-zone which was the final confirmation for this scenario marked in red. Now as there is still strong resistance lying established by the previous price-action we can expect a bearish pullback to the downside incoming within the near future, this pullback will move on till there is support found that can reverse the dynamic again and where Bitcoin has the abilities to stabilize again, this case can hold true within the back-up-cluster marked in my chart in blue where several supports coming together consisting of the 65-EMA in orange, the 85-EMA in green, the ascending-trend-line in blue and most importantly the two major Fibonacci-levels 50- and 61.8%, taking all these factors into consideration Bitcoin has some solid potentials to bounce within this cluster and move on to test higher levels ahead. Taking this into the schedule it is of inevitable importance that Bitcoin holds this cluster and do not fall below it because this will increase the bearish pressure to the downside again, therefore we need to keep patient and wait for the right confirmations here before overspeculating the market and rush into trades that do not satisfy.
In this manner, thank you for watching the analysis, have a great day and weekend, all the best!
"There are many roads to prosperity, but one must be taken."
Information provided is only educational and should not be used to take action in the markets.

Bitcoin, Trades In Key Descending-Channel, Likely Steps Ahead!Hi my friends,
Welcome to this fundamentally important analysis about Bitcoins price-action-developments, we are looking at the 4-hour timeframe perspective. Bitcoin since it confirmed its two tops has formed important price-actions as it is forming volatile movements to the up and downside in a major formation I detected which will be the determining source the upcoming times, currently, it is important to note that the bearish possibilities aren't fully out of sight and that there is still serious supply lying within the market which should not be underestimated as Bitcoin has also overbought conditions within the higher timeframes as well as the major indicators, therefore I detected all the important levels and likely outcomes we should consider with Bitcoin, the formation currently forming here and how this formation can possibly complete and turn out in some solid potentials.
Descending-Channel-Formation And Structural-Development:
As when looking at my chart we can watch there how Bitcoin the last times formed this massive descending-channel-formation with the lower- as well as upper-boundary marked in blue, besides that Bitcoin developed this coherent wave-count within the formation where it already completed waves A-D with the wave D currently moving into this strong-upper-resistance-cluster marked in red in my chart where several resistances coming together and therefore has a high likelihood to show up with the bearish pullback within which will actually be the origin of the final wave E to the downside which completes the whole wave-count. This finalizing wave E will divide into an ABC-wave-count similarly as Bitcoin has shown it in the waves before where Bitcoin is firstly going to test the lower-line of the channel and after that move on to the lower-boundary.
Upcoming Prospects And Potential Validations:
When Bitcoin completes the whole wave-count the final wave E is likely to move into the lower back-up-and-breakout-origin-cluster marked in blue in my chart and lying within the lower-boundary and also matching with the lower-support as well as the 300-EMA within this zone, this cluster has some good possibilities to indicate a bounce which then has the potential to convert into a channel breakout when Bitcoin manages to increase with bullish price-action after bouncing within this level. This breakout will emerge when Bitcoin manages to move above the upper-boundary and validate it as support as it is marked in my chart, when such price-action has shown up Bitcoin will firstly test higher levels of resistance within the structure where it has the strong resistances lying above, it will be one more step into acquiring possible bullishness however the bearish perspective is still in the room as Bitcoin can also show up with another pullback similarly as it has done within this range already once or produce a wave-E-extension within the descending-channel-formation, for now, we need to assess how strong the pullback becomes and if the stabilization can establish properly.
In this manner, thank you for watching the analysis, have a great day and weekend, all the best!
"There are many roads to prosperity, but one must be taken."
Information provided is only educational and should not be used to take action in the markets.

BITCOIN | Simple Price Zones in The Consolidation Area!Hi, long time no see.
Thought that I would point out some important areas after the price of Bitcoin made a tiny all-time high. Consolidation happening after that but my option - just put "stop orders" to the new all-time high and you would get a pretty solid trade if it breaks again. Actually, the key number would be the magical $20.000. I think if it breaks then the media, with titles, just drives the price into the huge prices.
Before that, the short-term traders can catch also some moves if the price gets close at least 18.900 (on 4h tf) and you can take a retest of 18.600-700 (retest are supported with 50 and 100 EMA's and with the strong horizontal area), the target would be the current all-time high, around 20k
The third simple theory will bring the price as low as ~15.000. It can happen if the current tiny short-term consistency finds its end and get a 4h candle close below the red line which marks 200EMA. There are also some daily lows, so two in one, wait for a retest and you may get a solid opportunity.
Regards,
Vaido

Bitcoin, Fundamental Decisions Incoming, Potential Scenarios!Hi my friends,
Welcome to this analysis about Bitcoin, we are looking at the 12-hour timeframe perspective, the recent events, the current formational structure, what we can expect the next times and what are likely scenarios to assess to finally move into the right direction when validations show up. As Bitcoin already formed this double-top-structure Bitcoin is still trading in a crucial situation where there is not only one fixed scenario given as it is often the case within the market, which is important to notify here because we need to keep patient and look for the proper confirmations to finally develop, therefore I detected all the important levels, likely scenarios and upcoming perspectives we should consider with Bitcoins established structure and the upcoming destinies.
Formational Structure:
When looking at my chart we can watch there how Bitcoin initiated this double-top-structure from where it already showed up with serious bearish movements to the downside to the point where it recently tested once already this ascending-trend-line marked in dashed grey in my chart which for now is still holding the bullishness to the downside however as Bitcoin has this descending-resistance-line and also other bearish formation building on the more local timeframes Bitcoin will look forward to pullback bearishly here and finally move below the ascending-trend-line to firstly point into the blue zone marked in my chart between the two dashed blue ascending-trend-lines which will be the key decision-zone for the upcoming movements possible to illuminate one of the two major scenarios as they are marked.
Upcoming Perspectives:
Basically, there are two possible scenarios to expect after Bitcoin dropped into the blue zone as it is shown, in this case, it is from high importance to anticipate if either the first or the second scenario finally show up before moving in the right direction and take the appropriate handling of the market. The first and more likely scenario is scenario A where Bitcoin increases with bearish pressure further to finally more below the double-top-neckline and point to the double-top-drop-target as it prospects within my chart, this scenario is not mainly unlikely because Bitcoin has already settled with the double-top-structure and besides that is still overbought on the higher timeframes. The second scenario, scenario B will develop when Bitcoin manages to bounce within the cluster with a decisive and volatile bullish move to finally manage to move above the strong resistance-zones and close above them with possible stabilization and continuation above.
In this manner, thank you for watching the analysis, have a great day and weekend, all the best!
"There are many roads to prosperity, but one must be taken."
Information provided is only educational and should not be used to take action in the markets.
