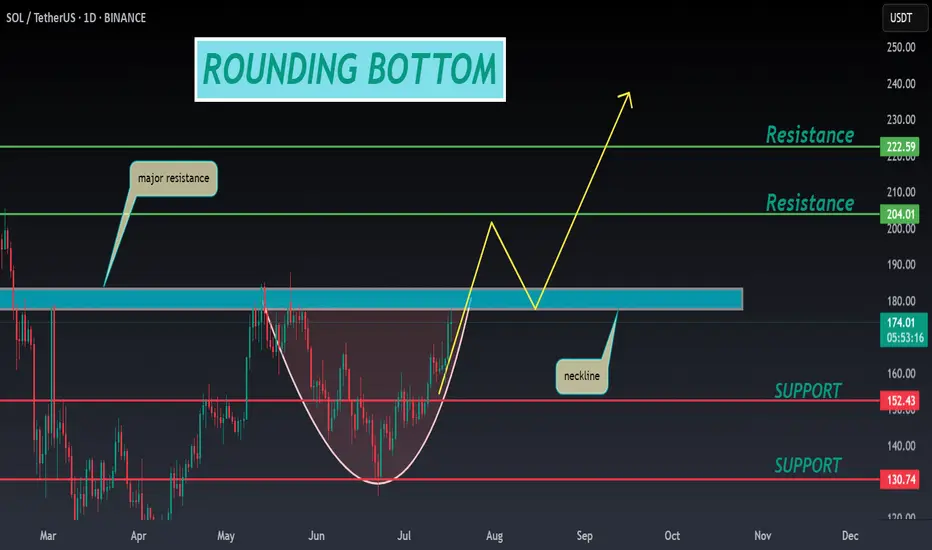
SOL ANALYSIS🔮 #SOL Analysis 💰💰
📊 #SOL is making perfect and huge rounding bottom pattern in daily time frame, indicating a potential bullish move. If #SOL retests little bit and breakout the pattern with high volume then we will get a bullish move📈
🔖 Current Price: $173.75
⏳ Target Price: $204.00
⁉️ What to do?
- We have marked crucial levels in the chart . We can trade according to the chart and make some profits. 🚀💸
#SOL #Cryptocurrency #Pump #DYOR
Bitcoin (Cryptocurrency)
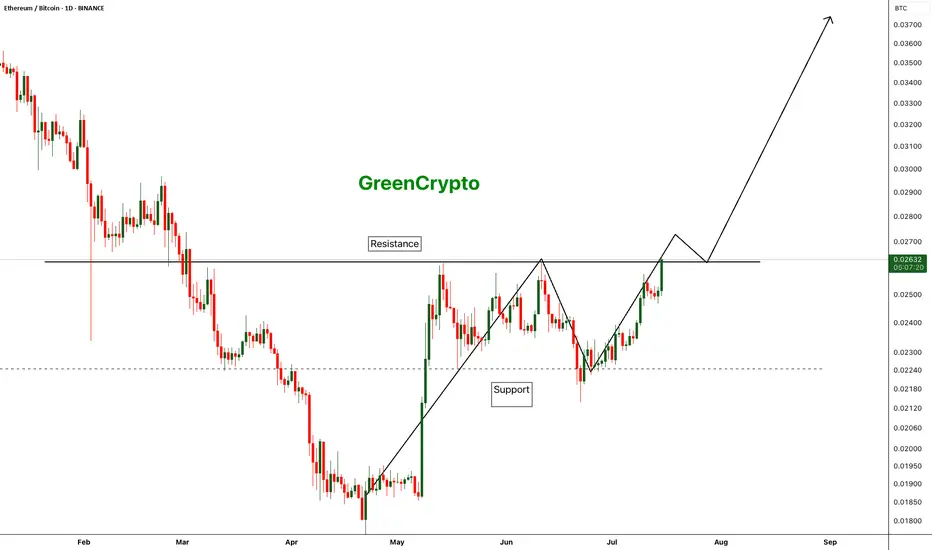
ETH/BTC - Finally Trend is reversing - After a long time we are finally seeing a change in the trend of ETH/BTC pair.
- Compared to BTC, ETH was underperforming for last couple of years and we are seeing some strength in ETH
- If this trend continue we can finally see some new ATH on ETH
Entry: 0.02633
StopLoss: 0.02125
TP1: 0.02825
TP2: 0.03168
TP3: 0.03592
Don't forget to keep stop loss. Stay tuned for more updates
Cheers
GreenCrypto
BTCUSD - Exhausted? Second time rejected, now down.BTCUSD got rejected at the Centerline the second time. This is super bearish. If it's closing below yesterdays low, that's a clear short signal to me.
Taking 50% gains off the table is never bad. Because then you still have 50% if it's going up further. Otherwise, you got 50% booked.
Don't let gree eat your brain §8-)

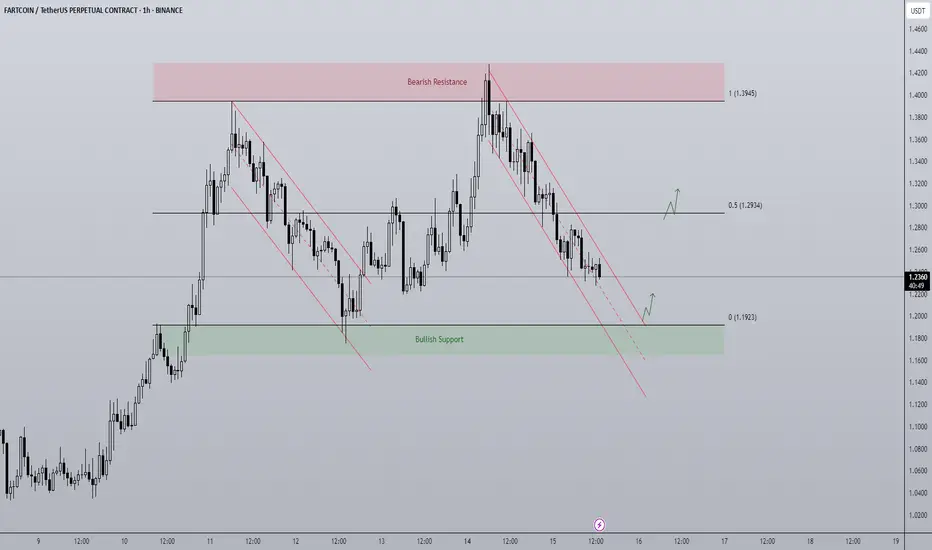
Fartcoin - Rangebound repeat? A BTC makes new highs attention has turned towards altcoins to play catch up.
FARTCOIN has been a top performer of the last month and currently on the 1D timeframe finds itself in a rangebound environment capped between $1.1923 - $1.3945. The end of last week price trended down in a bearish channel from top to bottom and it looks to be doing the same currently. As the supply zone above the range high got swept, price printed a SFP getting back inside the range and began trending down, for me there are two actionable long entries here:
- A range low bounce + breakout of trend channel would be an ideal long entry. An area of clear support coupled with a breakout is a historically strong setup with a clear invalidation if price breaks below the range and gets accepted.
- A more aggressive but potentially less ideal setup would be a breakout of the downtrend before hitting range lows. Higher risk as the level of support is not as defined but in the more risk-on environment crypto is currently in, the chance of major support levels being front run does go up as buyers become more impatient when FOMO grows.
The midpoint is key level to look out for too as a reclaim would mean a run at the highs, rejection opens the door to retest the lows.
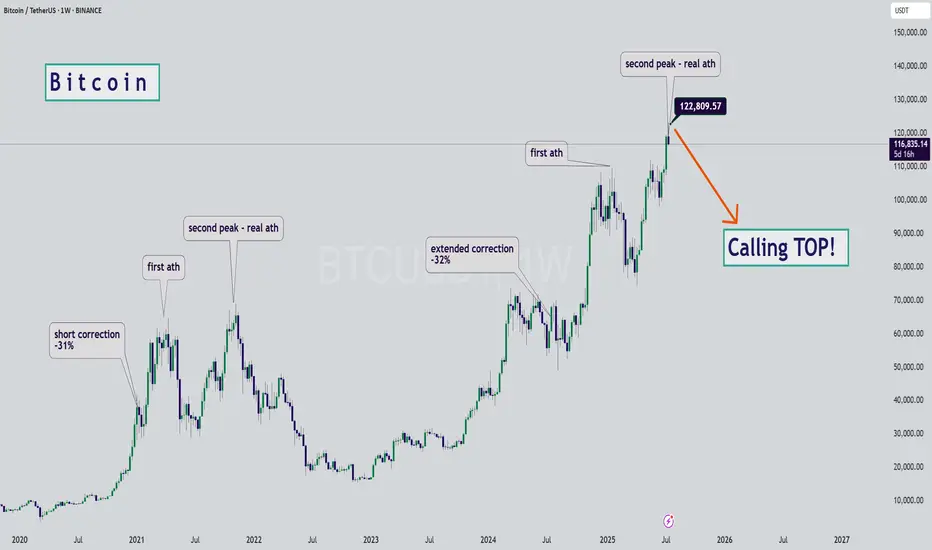
BTC - Calling the Start of the Bearish SeasonHello Watchers ☕
This was my previous Bitcoin update where I had a target of $116K, and also then closed all open positions at $122K:
I'm calling the top here mainly because of the way the chart looks, it really is classic Wyckoff if you look at the duration of the current bullish cycle, which has lasted a whole 973 Days with a 564% increase. What goes up, must come down!
Just for interest sake, the previous bullish cycle ran for 600 days with a 700% increase.
SOL/USDT : SOL Rebounds Strong – Is a 25% Rally Just Beginning?By analyzing the Solana (SOL) chart on the daily timeframe, we can see that after dropping to the $147.75 zone, the price experienced renewed buying pressure and has since rallied to around $159, delivering over 6% return so far.
This cryptocurrency shows strong bullish potential, with short-term gains possibly exceeding 25%.
The next upside targets are $168.5, $187, $220, and $263.
Please support me with your likes and comments to motivate me to share more analysis with you and share your opinion about the possible trend of this chart with me !
Best Regards , Arman Shaban

ADA/USDT : +50% in 21 Days, More Rise Ahead? (READ THE CAPTION)Over 50% growth in just 21 days — Cardano’s explosive rally continues, and the $0.76 target has now been hit! Since our last analysis, ADA has kept pushing higher, successfully reaching the next key level and bringing the total return from this move above 50%. Currently trading around $0.73, with strong bullish momentum still in play, I expect it won’t be long before we head toward the next targets. Upcoming levels to watch: $0.93, $1.05, and $1.33 — we’re getting closer to that 100% gain!
Please support me with your likes and comments to motivate me to share more analysis with you and share your opinion about the possible trend of this chart with me !
Best Regards , Arman Shaban

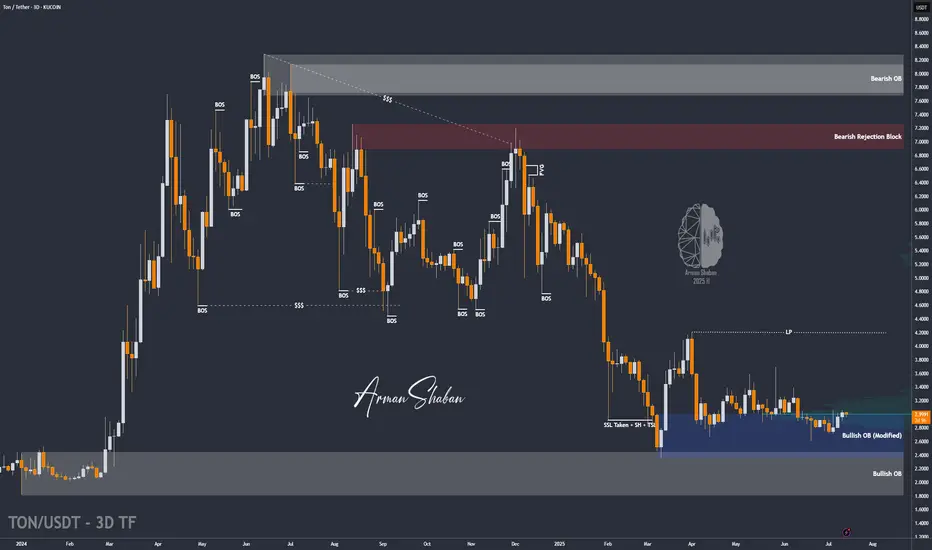
TON/USDT : Get Ready for a new Rally! (READ THE CAPTION)By analyzing the Toncoin chart on the 3-day timeframe, we can see that the price has finally managed to grow over 3% as expected, and is currently consolidating above the $3 level. We’ll have to see how far this bullish momentum can continue — but to be honest, I expected a stronger move considering the market rally and Bitcoin repeatedly hitting new ATHs. Still, no worries — once Bitcoin takes a breather, altcoins will likely begin their powerful runs! Based on previous analysis, the next targets are $3.15, $3.63, $4.20, and $4.68 respectively.
Please support me with your likes and comments to motivate me to share more analysis with you and share your opinion about the possible trend of this chart with me !
Best Regards , Arman Shaban
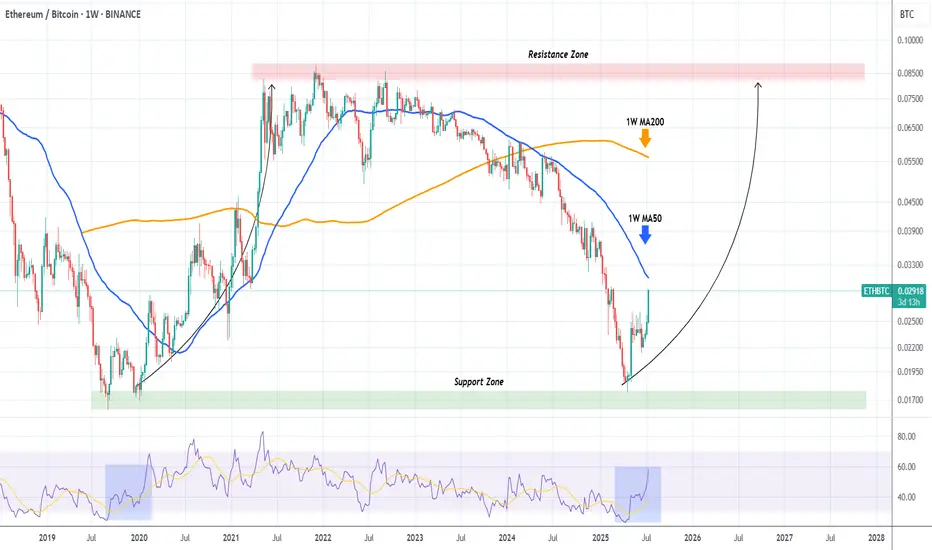
ETHBTC shows that Ethereum will outperform Bitcoin MASSIVELY!The ETHBTC pair has been rebounding hyper aggressively after the April 21 2025 Low on the 6-year Support Zone, and is now facing it's most important test, the 1W MA50 (blue trend-line).
This trend-line has been its Resistance since basically March 13 2023, so if broken, it will be a massive bullish break-out signal.
In fact during the 2020 - 2021 Bullish Leg, once the price broke above the 1W MA50, the market got the final confirmation of the upcoming long-term rally.
We expect Ethereum to outperform Bitcoin for the rest of the year at least.
-------------------------------------------------------------------------------
** Please LIKE 👍, FOLLOW ✅, SHARE 🙌 and COMMENT ✍ if you enjoy this idea! Also share your ideas and charts in the comments section below! This is best way to keep it relevant, support us, keep the content here free and allow the idea to reach as many people as possible. **
-------------------------------------------------------------------------------
💸💸💸💸💸💸
👇 👇 👇 👇 👇 👇
BITCOIN PREDICTION: INSIDER DATA THAT WILL HIT YOU HARD(warning)I am sharing with you my personal insider data of what I know about Bitcoin right now!

120K is the Key.Morning folks,
Our last plan worked perfect - market re-tested 117K support and jumped out. If you have longs - you could keep it.
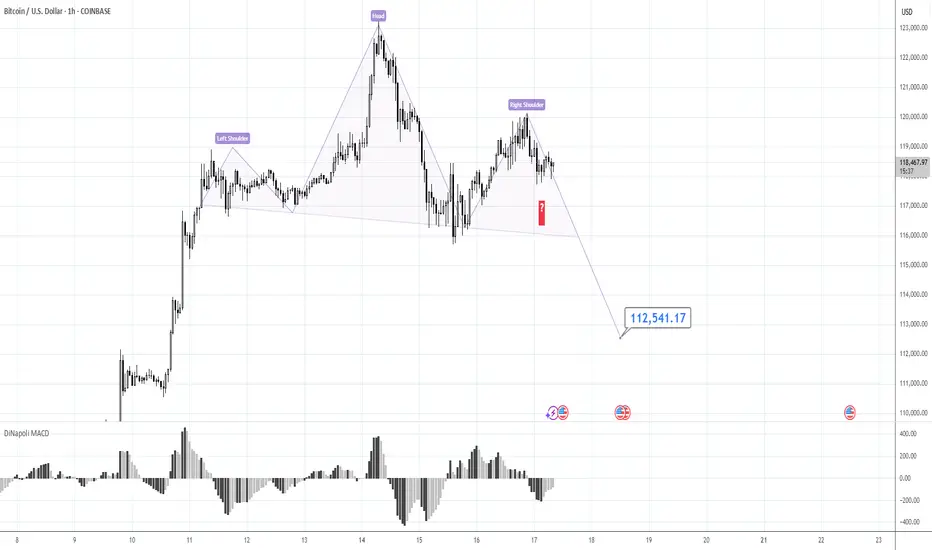
We consider now two alternative scenarios, although we think that this one with triangle is more probable, we do not exclude the H&S shape on 1H chart that could lead BTC down to 112-113K support area.
So, if you do not know how to deal with this - keep an eye on the 120K area and top of the right arm. Upside breakout will confirm H&S failure and triangle scenario. Otherwise, until market stands under 120K - consider H&S as a basic scenario, just for safety.
Take care, S.
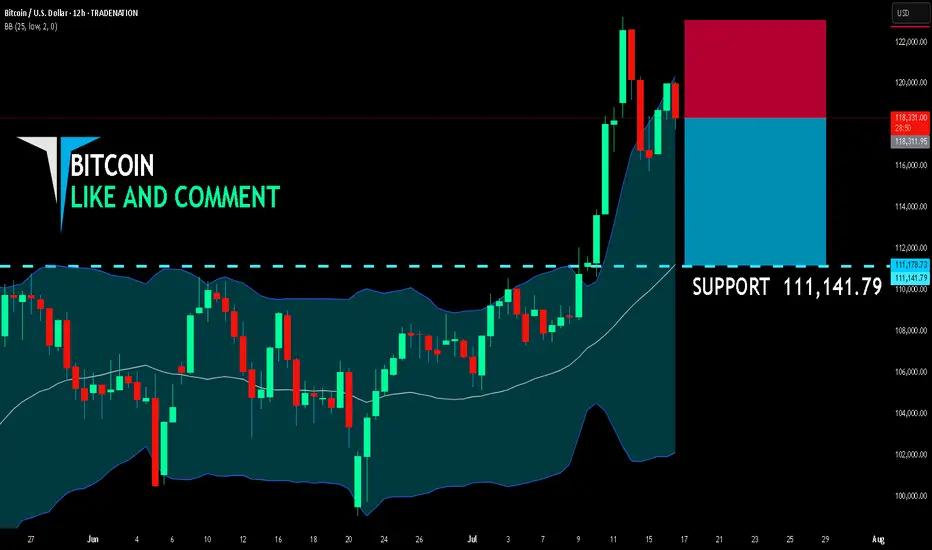
BITCOIN SHORT FROM RESISTANCE
BITCOIN SIGNAL
Trade Direction: short
Entry Level: 118,311.95
Target Level: 111,141.79
Stop Loss: 123,054.98
RISK PROFILE
Risk level: medium
Suggested risk: 1%
Timeframe: 12h
Disclosure: I am part of Trade Nation's Influencer program and receive a monthly fee for using their TradingView charts in my analysis.
✅LIKE AND COMMENT MY IDEAS✅
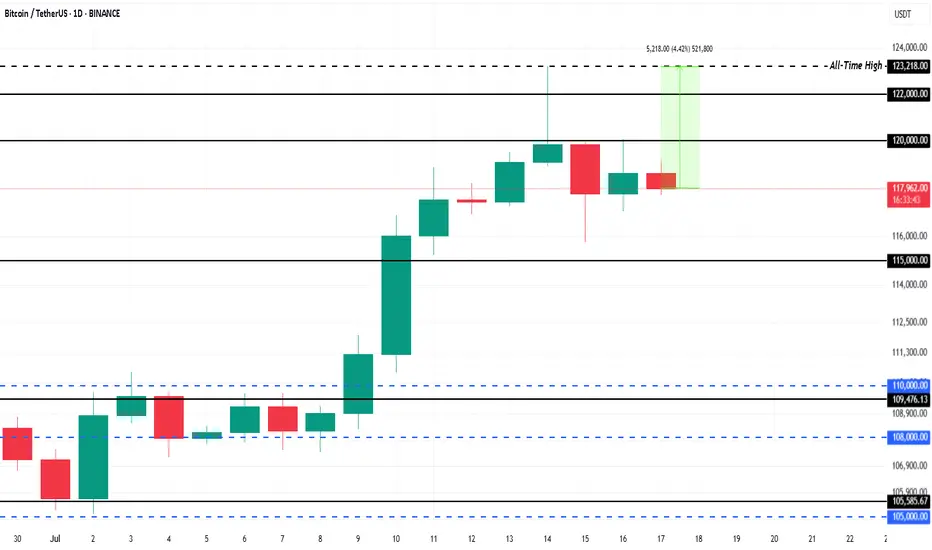
$1.5 Billion ETF Inflows Could Push Bitcoin Price 4% to New ATHBINANCE:BTCUSDT is currently trading at $118,325, facing resistance at the $120,000 level. This resistance is crucial for Bitcoin if it wants to break back to its ATH of $123,218 . The 4.4% gap to reach the ATH indicates potential for growth, but Bitcoin needs to secure support above $120,000 for this to happen.
This week, spot BINANCE:BTCUSDT exchange-traded funds (ETFs) saw over $1.5 billion in inflows , a significant portion of which occurred in the last 48 hours during Bitcoin’s dip.
The influx of institutional money highlights that investors are confident in Bitcoin’s potential despite the market cooling. If this trend persists, it could propel BINANCE:BTCUSDT price upward, as institutional support provides stability.
If BINANCE:BTCUSDT can hold above $120,000 and push past $122,000, it could continue its ascent toward new all-time highs. The current market conditions and ETF inflows support a bullish outlook, with a significant chance of breaking the resistance.
However, the risk of profit-taking remains , which could lead to a price drop. If BINANCE:BTCUSDT faces selling pressure, it could fall back to $115,000 , erasing a portion of recent gains. This would invalidate the bullish thesis, causing Bitcoin to retest lower support levels.
Bitcoin and Upcoming TrendBitcoin’s trend has been growing from strength to strength — and it’s likely to stay that way. Why?
This trend isn’t driven purely by speculation; it’s supported by strong fundamental reasons.
One of the most widely debated topics in finance today is the comparison between Bitcoin and gold. While both are viewed as stores of value, their long-term roles may diverge significantly.
Yet, they’ve been moving in near-perfect synchronization, with potential resistance ahead, but their trend still remain intact — and here’s why.
Mirco Bitcoin Futures and Options
Ticker: MBT
Minimum fluctuation:
$5.00 per bitcoin = $0.50 per contract
Disclaimer:
• What presented here is not a recommendation, please consult your licensed broker.
• Our mission is to create lateral thinking skills for every investor and trader, knowing when to take a calculated risk with market uncertainty and a bolder risk when opportunity arises.
CME Real-time Market Data help identify trading set-ups in real-time and express my market views. If you have futures in your trading portfolio, you can check out on CME Group data plans available that suit your trading needs www.tradingview.com

Need a trading strategy to avoid FOMO
Hello, traders.
If you "Follow", you can always get new information quickly.
Have a nice day today.
-------------------------------------
1D chart is the standard chart for all time frame charts.
In other words, if you trade according to the trend of the 1D chart, you can make profits while minimizing losses.
This can also be seen from the fact that most indicators are created based on the 1D chart.
In that sense, the M-Signal indicators of the 1M, 1W, and 1D charts are suitable indicators for confirming trends.
If the price is maintained above the M-Signal indicator of the 1M chart, it is highly likely that the upward trend will continue in the medium to long term, so it is recommended to take note of this advantage especially when trading spot.
The M-Signal indicator on the 1W, 1D chart shows the medium-term and short-term trends.
The M-Signal indicator uses the MACD indicator formula, but it can be seen as a price moving average.
You can trade with just the price moving average, but it is difficult to select support and resistance points, and it is not very useful in actual trading because it cannot cope with volatility.
However, it is a useful indicator when analyzing charts or checking general trends.
Therefore, what we can know with the M-Signal indicator (price moving average) is the interrelationship between the M-Signal indicators.
You can predict the trend by checking how far apart and close the M-Signal indicators are, and then checking the direction.
-
If you have confirmed the trend with the M-Signal indicator, you need support and resistance points for actual trading.
Support and resistance points should be drawn on the 1M, 1W, and 1D charts.
The order of the roles of support and resistance points is 1M > 1W > 1D charts.
However, the strength of the role of support and resistance points can be seen depending on how long the horizontal line is.
Usually, in order to perform the role of support and resistance points, at least 3 candles or more form a horizontal line.
Therefore, caution is required when trading when the number of candles is less than 3.
The indicators created considering this point are the HA-Low and HA-High indicators.
The HA-Low and HA-High indicators are indicators created for trading on the Heikin-Ashi chart and indicate when the Heikin-Ashi candle turns upward or downward.
Therefore, the creation of the HA-Low indicator means that there is a high possibility of an upward turn.
In other words, if it is supported by the HA-Low indicator, it is a time to buy.
However, if it falls from the HA-Low indicator, there is a possibility of a stepwise decline, so you should also consider a countermeasure for this.
The fact that the HA-High indicator was created means that there is a high possibility of a downward turn.
In other words, if there is resistance from the HA-High indicator, it is a time to sell.
However, if it rises from the HA-High indicator, there is a possibility of a stepwise upward turn, so you should also consider a countermeasure for this.
This is where a dilemma arises.
What I mean is that the fact that the HA-High indicator was created means that there is a high possibility of a downward turn, so you know that there is a high possibility of a downward turn, but if it receives support and rises, you think that you can make a large profit through a stepwise upward turn, so you fall into a dilemma.
This is caused by greed that arises from falling into FOMO due to price volatility.
The actual purchase time should have been when it showed support near the HA-Low indicator, but when it showed a downward turn, it ended up suffering a large loss due to the psychology of wanting to buy, which became the trigger for leaving the investment.
Therefore, if you failed to buy at the purchase time, you should also know how to wait until the purchase time comes.
-
It seems that you can trade depending on whether the HA-Low and HA-High indicators are supported, but the task of checking whether it is supported is quite difficult and tiring.
Therefore, to complement the shortcomings of the HA-Low and HA-High indicators, the DOM(60) and DOM(-60) indicators were added.
The DOM(-60) indicator indicates the end of the low point.
Therefore, if it shows support in the DOM(-60) ~ HA-Low section, it is the purchase time.
If it falls below the DOM(-60) indicator, it means that a stepwise downtrend is likely to begin.
The DOM(60) indicator indicates the end of the high point.
Therefore, if it is supported and rises in the HA-High ~ DOM(60) section, it means that a stepwise uptrend is likely to begin.
If it is resisted and falls in the HA-High ~ DOM(60) section, it is likely that a downtrend will begin.
With this, the basic trading strategy is complete.
This is the basic trading strategy of buying when it rises in the DOM(-60) ~ HA-Low section and selling when it falls in the HA-High ~ DOM(60) section.
For this, the trading method must adopt a split trading method.
Although not necessarily, if it falls in the DOM(-60) ~ HA-Low section, it will show a sharp decline, and if it rises in the HA-High ~ DOM(60) section, it will show a sharp rise.
Due to this volatility, psychological turmoil causes people to start trading based on the price, which increases their distrust in the investment market and eventually leads them to leave the investment market.
-
When looking at the movement of the 1D chart, it can be seen that it is not possible to proceed with trading at the moment because it is already showing a stepwise upward trend.
However, since there is a SHORT position in futures trading, trading is possible at any time.
In any case, it is difficult to select a time to buy because the 1D chart shows a stepwise upward trend.
However, looking at the time frame chart below the 1D chart can help you select a time to buy.
The basic trading strategy is always the same.
Buy when it rises in the DOM(-60) ~ HA-Low section and sell when it falls in the HA-High ~ DOM(60) section.
Currently, since the 1D chart is continuing a stepwise upward trend, the main position is to eventually proceed with a long position.
Therefore, if possible, you should focus on finding the right time to buy.
However, if it falls below the HA-High indicator of the 1D chart, the possibility of a downtrend increases, so at that time, you should focus on finding the right time to sell.
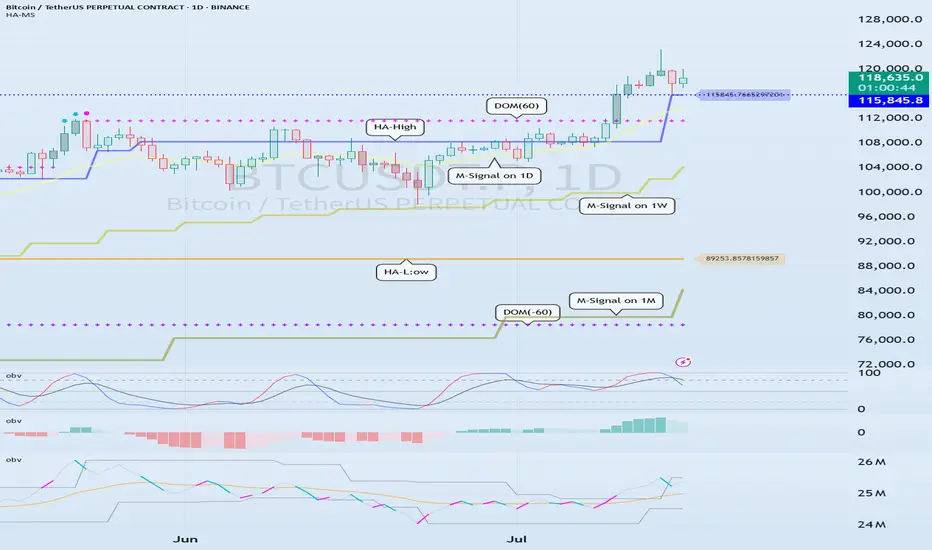
In other words, since the HA-High indicator of the current 1D chart is generated at the 115845.8 point, you should think of different response methods depending on whether the price is above or below the 115845.8 point.
Therefore, when trading futures, increase the investment ratio when trading with the main position (a position that matches the trend of the 1D chart), and decrease the investment ratio when trading with the secondary position (a position that is different from the trend of the 1D chart) and respond quickly and quickly.
When trading in the spot market, you have no choice but to trade in the direction of the 1D chart trend, so you should buy and then sell in installments whenever it shows signs of turning downward to secure profits.
In other words, buy near the HA-Low indicator on the 30m chart, and if the price rises and the HA-High indicator is created, sell in installments near that area.
-
You should determine your trading strategy, trading method, and profit realization method by considering these interrelationships, and then trade mechanically accordingly.
If you trade only with fragmentary movements, you will likely end up suffering losses.
This is because you do not cut your losses.
-
Thank you for reading to the end.
I hope you have a successful trade.
--------------------------------------------------
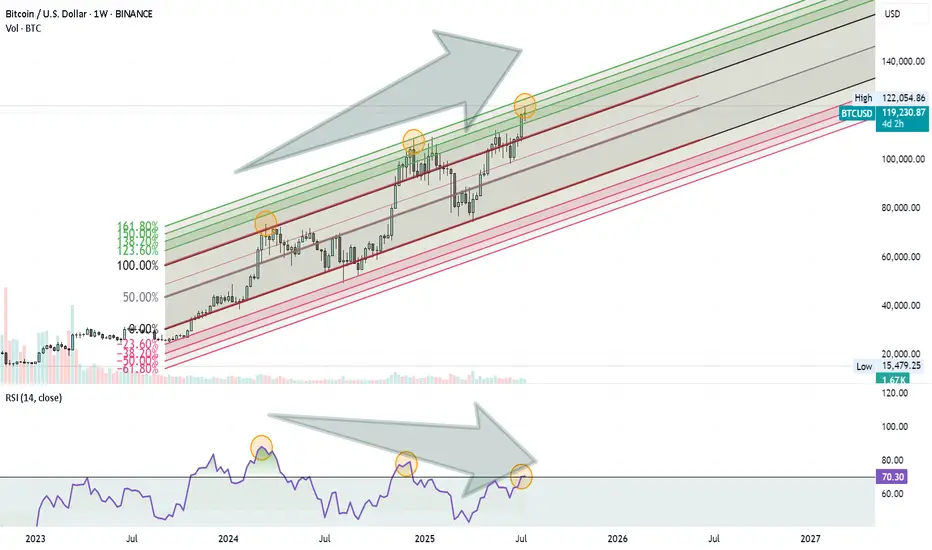
Bitcoin Rally Losing Steam?Bitcoin might be approaching a Turning Point . Here’s what I’m seeing on the weekly chart:
Price is moving inside an ascending Fibonacci channel.
It’s getting close to the 1.60 (160%) extension level, which has acted as a reversal zone before.
At the same time, the RSI is showing a clear negative divergence, suggesting that momentum is weakening.
These signs combined could mean we’re not far from a significant correction.
Nothing is confirmed yet, but it’s a setup worth keeping an eye on.
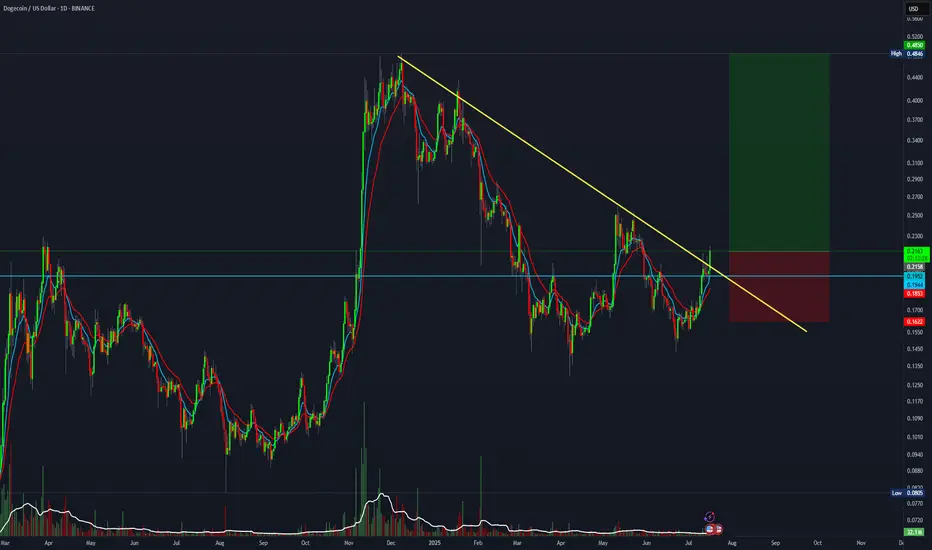
5:1 R:R for Dogecoin.DOGE is breaking out from the trendline. This setup offers a 5:1 R:R
Entry: 0.216
Stop Loss: 0.162
Target: 0.48
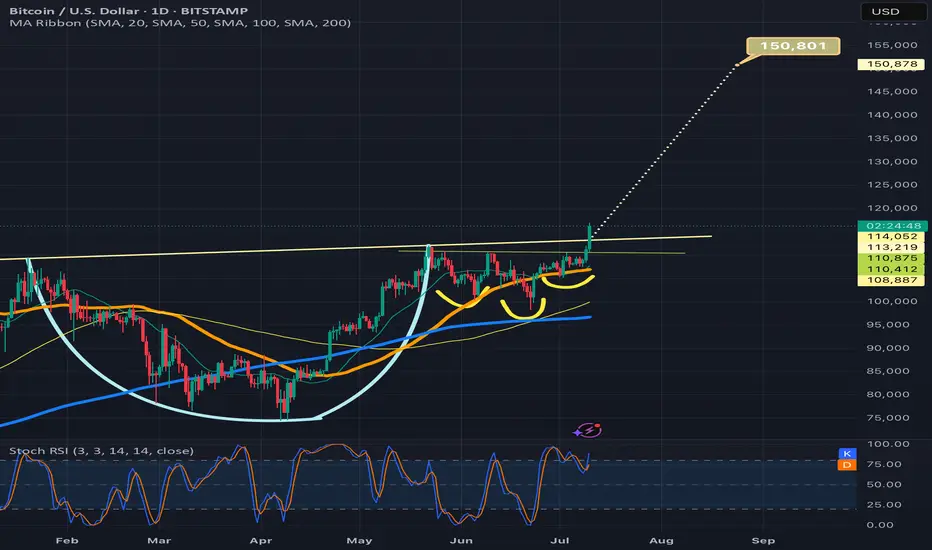
Btcusd breaking above cup and handle necklineIf it confirms the bullish breakout the target is 150k. Also by breaking above 116k and solidifying that level as strong support, we will trigger an even bigger inverse head and shoulders pattern (not shown here) with a breakout target around 208k! I will provide a link below to the chart I posted of that pattern. Thanks for reading, liking, and following. *not financial advice*
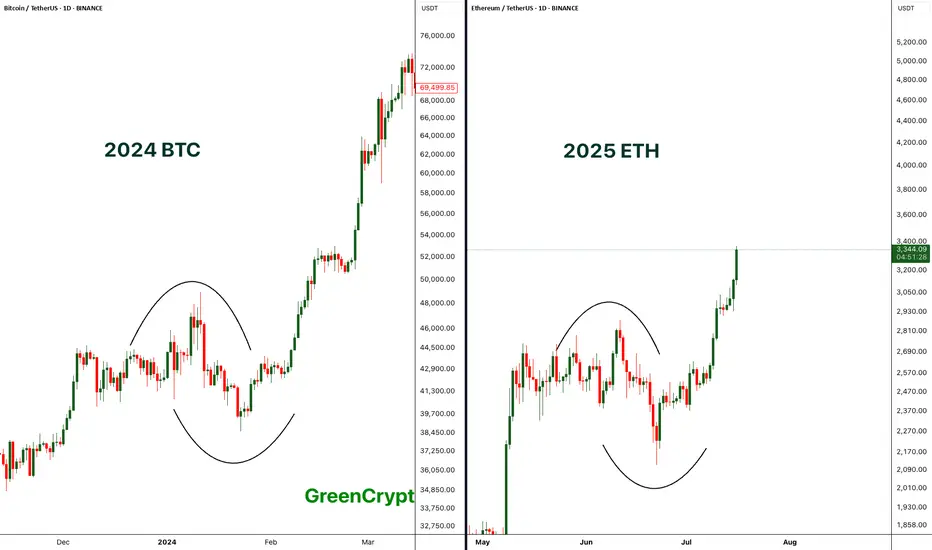
Comparing BTC 2024 with ETH 2025 - Perfect Match- If compare the chart pattern of BTC from 2024 with the current 2025 ETH pattern, wee see exactly similar chart patterns being formed here.
- Price started consolidating then it had fake breakout towards both the sides and finally the real breakout.
- BTC breakout push the price towards the new all time high above 69K, if we ETH follows similar trend then we can expect new all time high on ETH.
Let's see how it plays out.
Stay tuned for more updates.
Cheers
GreenCrypto
BITCOIN- MONSTER ORDERS IN THE BOOK -> You Know What This Means COINBASE:BTCUSD “Monster orders” are exceptionally large buy-limit orders clustered roughly 7 % beneath the current market price.
Large buy-limit walls can act like a price magnet—deep liquidity attracts algos and traders hunting fills, often pulling price straight toward the level.
Once the wall absorbs the selling pressure, the magnet flips: liquidity dries up, supply thins, and price can rip away from that zone with force.
They create a visible demand wall in the order book, signalling that whales / institutions are ready to absorb a dip and accumulate at that level.
Price will often wick into this zone to fill the wall, then rebound sharply—treat the 7 % band as potential support or entry.
Such walls can act as liquidity traps : market makers may push price down to trigger retail stop-losses before snapping it back up.
Confirm that the wall persists as price approaches and that spot + derivatives volume rises; if the wall disappears, it may have been spoofing.
Always combine order-book context with trend, momentum and higher-time-frame support for higher-probability trades, Just like the extremely powerful indicators on the chart.
🚀 Marty Boots | 17-Year Trader — smash that 👍, hit LIKE & SUBSCRIBE, and share your views in the comments below so we can make better trades & grow together!

Bitcoin positive diversion to $131,000Using fibonacci retracements for price targets based off of positive divergences on the 15 min time frame and hourly time frame. I am utilizing 2 ioscilating indicators: RSI length is 36 with smma at 50 and the Chande momentum oscillator with a length of 24. My conservative estimate is $131,000 for a safe trade close. $132,400 exact area for pullback to $128,500?

Bitcoin -> The bullrun is not over!📣Bitcoin ( CRYPTO:BTCUSD ) is still totally bullish:
🔎Analysis summary:
A couple of months ago Bitcoin broke above the previous all time high. This was basically just the expected creation of new highs, perfectly following the underlying cycles. With respect to the long term rising channel formation, this bullrun on Bitcoin is just starting.
📝Levels to watch:
$100.000
🙏🏻#LONGTERMVISION
Philip - Swing Trader

Ethereum Breakout and Liquidations – A Lesson in Bear Traps and 📚💥 Ethereum Breakout and Liquidations – A Lesson in Bear Traps and Risk Management 🧠📈
Today, July 16th, Ethereum gave us a real-time masterclass in market psychology and risk management.
Let’s start with the facts:
📊 Liquidation Data
🔻 $36.34M in long liquidations
🔺 $86.02M in short liquidations
💣 Total ETH liquidations: $122.36M (data mentioned on video might differ, i made a small mistake)
🌐 Across crypto: $351M liquidated (more shorts than longs)
This imbalance tells us one thing: a bear trap played out, and it played out hard.
🧠 Educational Takeaways
1. Bear Traps Are Real — and Expensive
A bear trap occurs when the market appears bearish, drawing in short sellers — only to violently reverse upward. Today’s Ethereum move was a textbook example. If you’ve been following my analysis, we discussed the regression lines, divergences, and structure that all warned against going short at support.
2. Open Interest and Sentiment Signals
Open interest has been declining — which means fewer speculative positions. That often creates space for a real, organic move, not one fueled by overleveraged noise.
3. Spot vs. Leverage – Risk Control First
Leverage isn’t the enemy — unmanaged leverage is. I personally use a dedicated high-risk account to trade fast setups. This keeps my core capital untouched and my psychology stable.
✅ Risk is defined before the trade.
✅ Entries are structured like bullets — small, multiple attempts.
4. The Mental Game is the Real Game
Trading isn’t just technical. It’s deeply psychological. Whether you’re trading Ethereum, Bitcoin, or altcoins like AVAX and XRP, emotions must be managed before capital is deployed.
5. Like-Minded Community = Sharper Edge
My best trades and insights often come from conversations with trusted, sharp minds in this space. Surrounding yourself with serious traders can be the difference between evolving — and evaporating. To my brother Vlatko (met on Tradingview, been hanging around online ever since, met in person once, now a true friend that we frequently disagree but always agree to respect and empower each other = The power of our community here on TV!)
Final Word:
When markets move fast, lessons appear even faster.
Study the traps. Respect the levels. Structure your risk.
And above all: trade with a plan that allows joy.
One Love,
The FXPROFESSOR 💙
Disclosure: I am happy to be part of the Trade Nation's Influencer program and receive a monthly fee for using their TradingView charts in my analysis. Awesome broker, where the trader really comes first! 🌟🤝📈
