HolderStat┆BTCUSD above $120BINANCE:BTCUSDT has surged past $129,000 following a breakout from long-term consolidation. The chart shows a clean continuation structure with the next resistance between $135,000–$137,000. Momentum remains on the side of bulls.
Bitcoin (Cryptocurrency)

TradeCityPro | Bitcoin Daily Analysis #129👋 Welcome to TradeCity Pro!
Let’s take a look at the Bitcoin analysis and key crypto indices. As usual, in this analysis, I’ll review the futures triggers for the New York session.
⏳ 1-hour timeframe
Yesterday, Bitcoin faced a sharp drop after being rejected from the 122733 top and fell down to the 116829 level.
⚡️ Currently, the price has reached an important support area that I’ve marked for you, and at the same time, the RSI has entered the Oversold zone.
✅ Considering the main trend of the market is bullish, this RSI entry into Oversold could be a very good entry point for a long position, as it may indicate the end of the correction.
✨ If the price holds above the 116829 zone, we can enter a long position, and it’s worth opening a position at this level. Further entries can be taken with breakouts of 118494 and 122733.
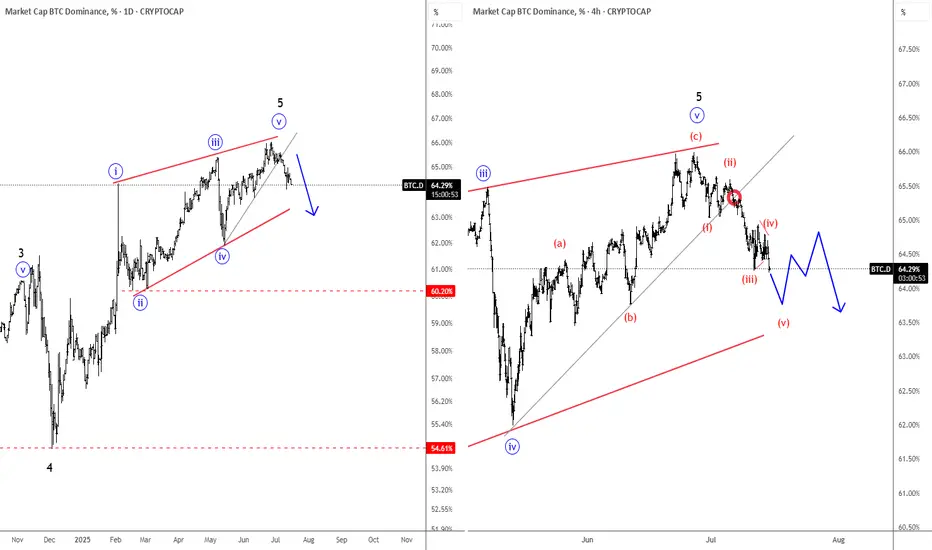
👑 BTC.D Analysis
Let’s go to Bitcoin dominance. It has continued its downward movement and after breaking 64.44, it’s now moving down toward 64.18.
📊 If this level breaks, we’ll get confirmation of the continuation toward 63.96. In that case, long positions on altcoins would be very suitable.
📅 Total2 Analysis
Total2 is also undergoing a correction like Bitcoin and has settled below the 1.3 level.
⭐ If the correction continues, the next level to watch is 1.26. For long positions, you can enter after breakouts of 1.3 and 1.33.
📅 USDT.D Analysis
Now to Tether Dominance. After bouncing from the 4.22 bottom, it has returned to the box between 4.36 and 4.44.
🔑 If 4.36 breaks, the next bearish leg could start. On the other hand, if 4.44 breaks, we’ll get the first signal of a trend reversal.

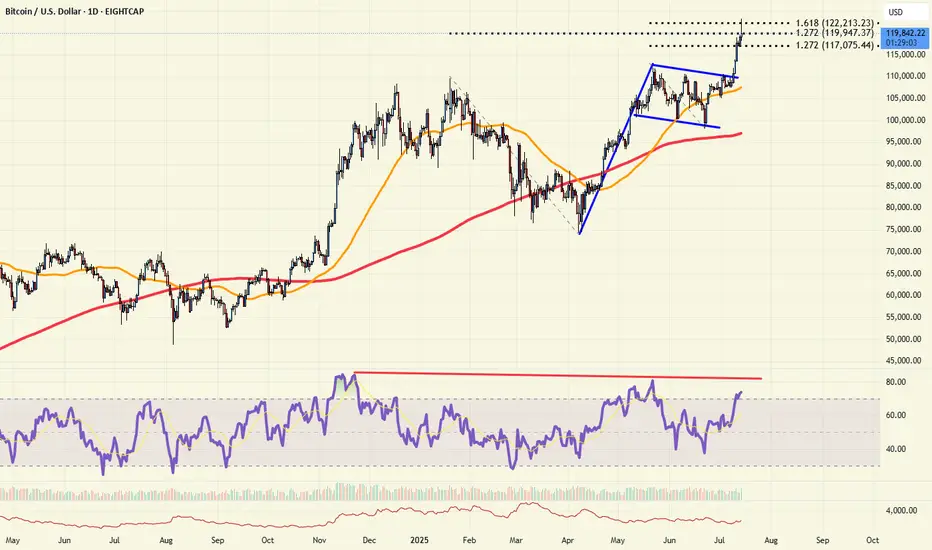
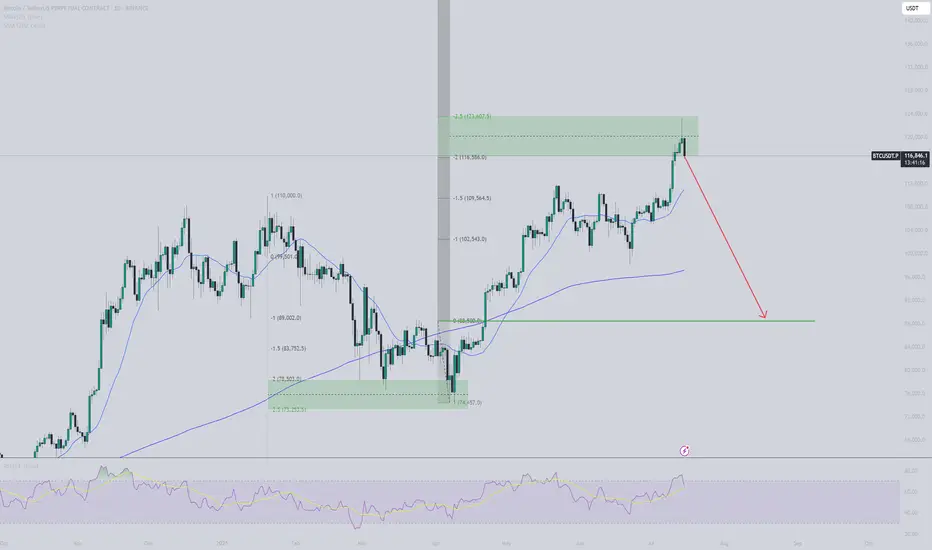
HelenP. I Bitcoin will go to a correction after a strong impulseHi folks today I'm prepared for you Bitcoin analytics. If we look at the chart, we can see that the price has recently made a powerful impulse upward, breaking out of a long consolidation range between 110500 and 102500. This range acted as a strong accumulation zone, where the price bounced multiple times from both support levels. After the breakout, Bitcoin gained momentum and pushed sharply toward the 122000 mark. Now, after this sharp rally, I believe a correction is highly probable. Often, after such strong bullish moves, the market tends to pull back to retest the trend line or previous breakout zones. In this case, the trend line has been respected several times and now aligns with the 117500 area, which also acts as local support. That’s why I consider this zone to be a logical target for the correction. I expect BTCUSD can drop from the current highs and retest the trend line near 117500 points - that is my main goal for this setup. If the trend line holds, buyers may return to the market and push price higher again. Given the strong impulse, the breakout from consolidation, and the importance of the trend line, I remain bearish short-term and expect a drop toward 117500 points. If you like my analytics you may support me with your like/comment ❤️
Disclaimer: As part of ThinkMarkets’ Influencer Program, I am sponsored to share and publish their charts in my analysis.

#BTC Update #7 – July 15, 2025#BTC Update #7 – July 15, 2025
Bitcoin is currently within the consolidation zone where it previously paused during its last upward move. From this zone, it had previously bounced and created a new all-time high. It is now undergoing a correction, and the level it has reached aligns with the 0.382 Fibonacci retracement, which is perfectly normal for a first stop in a correction.
If the correction continues, the second stop could be around $114,795, and the third around $113,012. If it reaches these levels, it will have filled at least half of the imbalance created during the previous rally.
Looking at the volume, I anticipate that Bitcoin might start to bounce from this level. If it manages to break above the $122,666 zone, the next target would be around $127,172.
I do not plan to buy Bitcoin here unless I see a high-volume green candle. However, if Bitcoin breaks above the $118,900 level with strong volume, a long position might be considered, as the target would likely shift toward the $127,000 range.

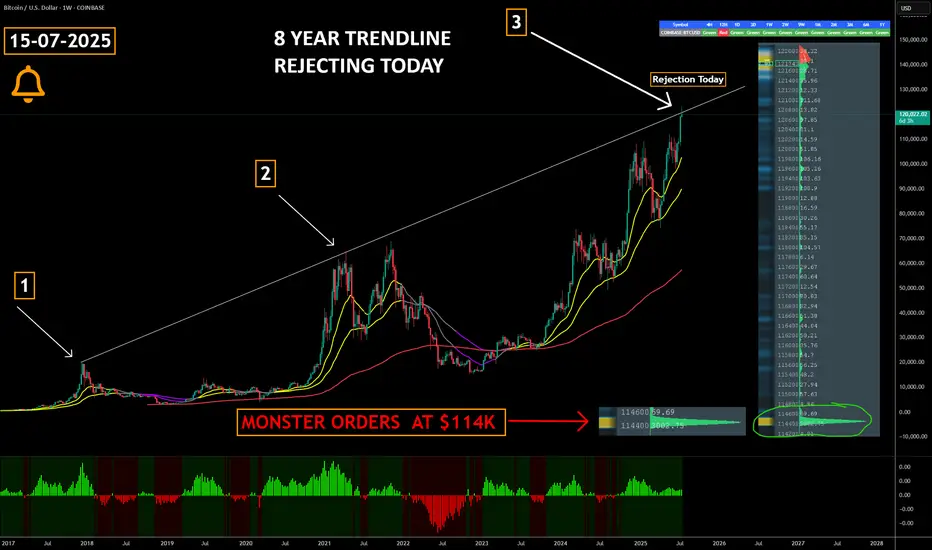
Did Bitcoin Just TOP OUT ??????
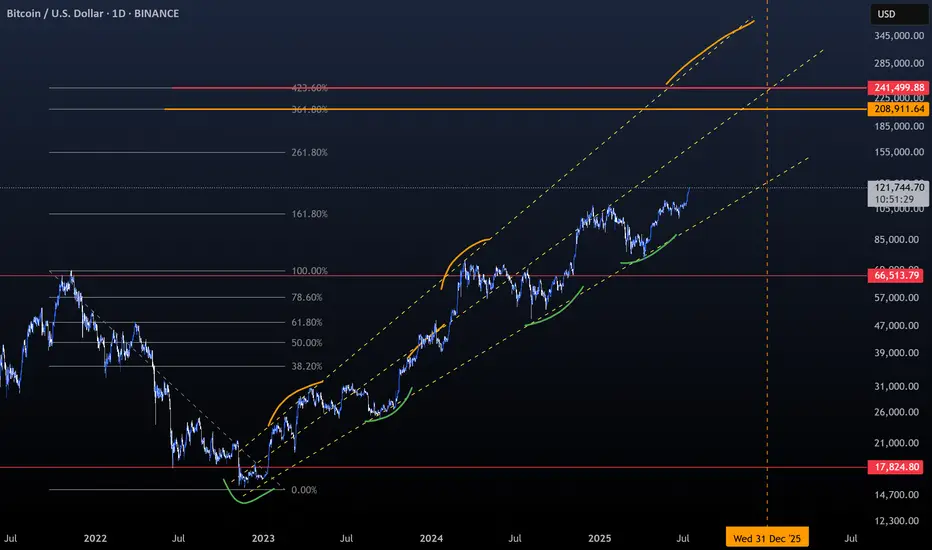
COINBASE:BTCUSD has just collided with an 8-year rising trendline that capped the market’s last two cyclical peaks—historically, this level has triggered multi-month corrections and Bear Markets.
Triple-test significance : a third touch of a long-term trendline ➜ heightened odds of a reaction; failure to break cleanly often confirms a major top.
Watch for confirmation signals —weekly bearish RSI divergence, waning volume, or rejection wicks can validate a reversal scenario.
Breakout = regime change : a decisive close and hold above the line flips it to support, opening the door to fresh price discovery and potential parabolic upside.
Large Orders at $114k create a visible demand wall in the order book, signalling that whales / institutions are ready to absorb a dip and accumulate at that level.
Risk-management alert : consider tightening stops, reducing leverage, or hedging until trendline fate is resolved.
The buy pressure has been relentless but this is always worth paying attention to
Marty Boots | 17-Year Trader — smash that , hit LIKE & SUBSCRIBE, and share your views in the comments below so we can make better trades & grow together!
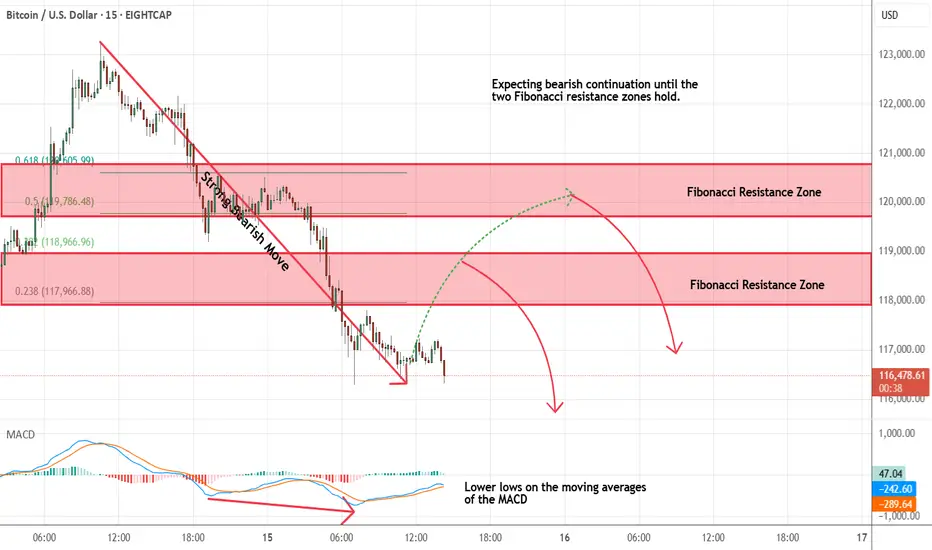
Bitcoin - Looking To Sell Pullbacks In The Short TermM15 - Strong bearish move.
Lower lows on the moving averages of the MACD.
No opposite signs.
Currently it looks like a pullback is happening.
Expecting bearish continuation until the two Fibonacci resistance zones hold.
If you enjoy this idea, don’t forget to LIKE 👍, FOLLOW ✅, SHARE 🙌, and COMMENT ✍! Drop your thoughts and charts below to keep the discussion going. Your support helps keep this content free and reach more people! 🚀
--------------------------------------------------------------------------------------------------------------------
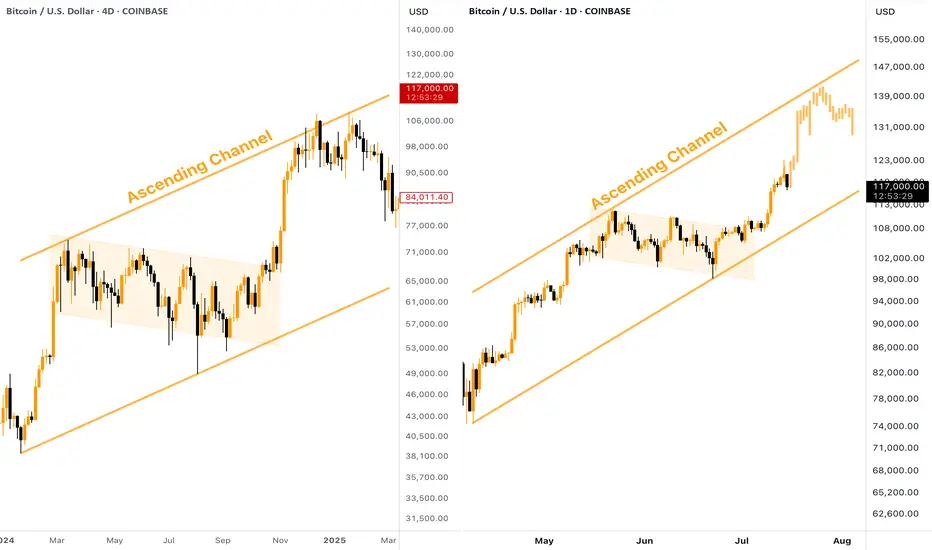
[BITCOIN] - Where is Potential TOP (ATH) of the Bull Cycle?Many people wondering where is the potential TOP of the current Bitcoin Bull Run? Besides setting a Fibo Retracement, we can take a look at the past. The current situation on CRYPTOCAP:BTC chart reminds me of what we've seen in the end of 2024, here is why:
Big ascending channel, price perfectly moves inside without breaking borders
Descending consolidation inside the bull flag
Strong breakout and pump towards the resistance of the channel
👉 According to this pattern, the target for the current Bitcoin upward move should be located in the $140,000 zone. Keep this in mind when planning your trades.
BITCOIN Will it go lower?Bitcoin (BTCUSD) pulled back rather aggressively yesterday after marginally breaking above $123000 and making a new All Time High (ATH).
We've mentioned before the similarities of this Bullish Leg to the April - May structure and so far the current pull-back having already touched the 0.236 Fibonacci retracement level, resembles the late April pull-back.
However, besides the 0.236 Fib, that pull-back also hit its 4H MA50 and rebounded, so that's a condition that hasn't been fulfilled. If it does, we are potentially looking for a Low around the $115k mark. Notice also how both fractals are supported by a Higher Lows trend-line exactly on their respective 4H MA100 (green trend-line) levels.
If BTC continues to replicate this pattern, we expect to see $140000 (+43.05% from the bottom) by early August.
Will the Support levels hold and push it that high? Feel free to let us know in the comments section below!
-------------------------------------------------------------------------------
** Please LIKE 👍, FOLLOW ✅, SHARE 🙌 and COMMENT ✍ if you enjoy this idea! Also share your ideas and charts in the comments section below! This is best way to keep it relevant, support us, keep the content here free and allow the idea to reach as many people as possible. **
-------------------------------------------------------------------------------
💸💸💸💸💸💸
👇 👇 👇 👇 👇 👇

BTC retracement comingBTC seems to follow the 2-2,5 stdv price structure. Based on simply stdv from last manipulation leg down it suggests we are now at reversal zone, and I expect price to retrace down. First reaction seems to support this plan. Aiming at $88,5K.
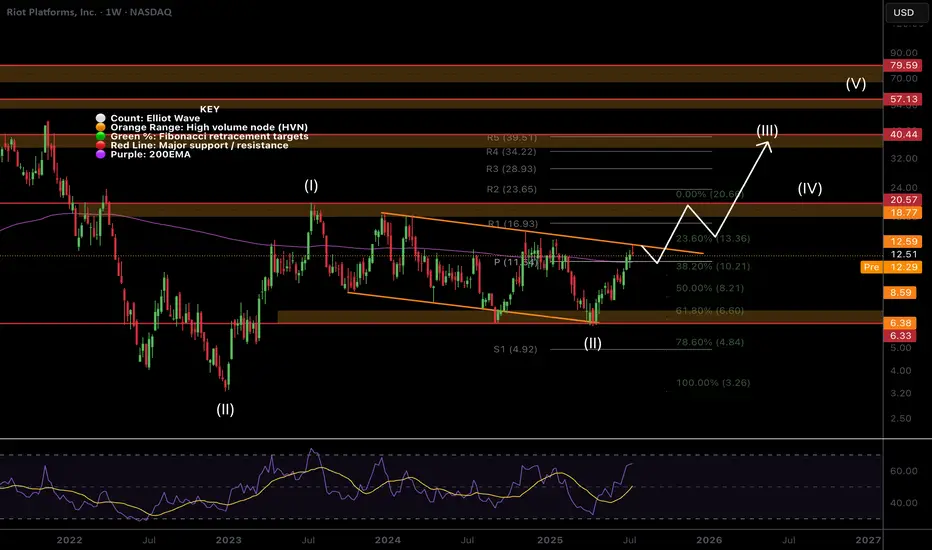
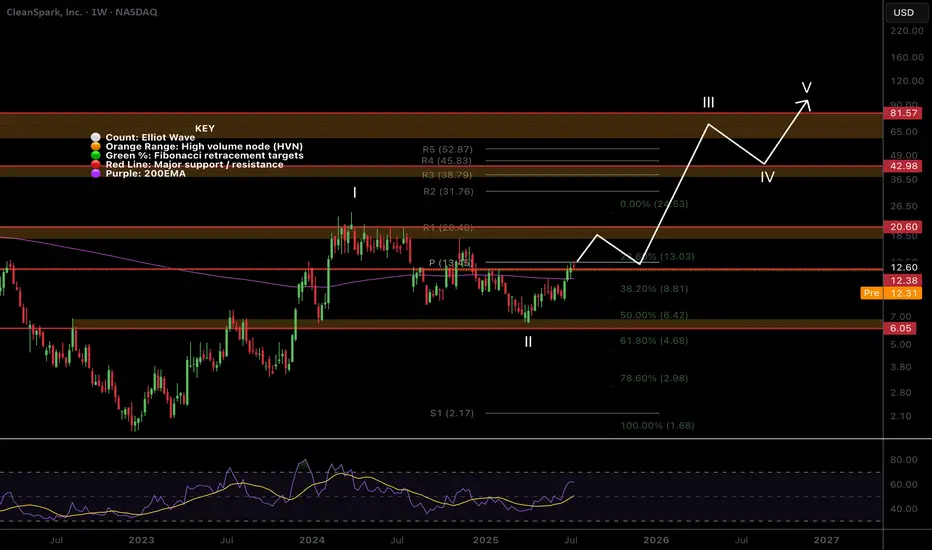
$RIOT Hit The Target Whats Next?NASDAQ:RIOT hit the descending orange resistance were I took partial take profits on my trade this week and it was immediately rejected as expected.
Price is now above the weekly pivot so that is the next support. This level also matches the weekly 200EMA.
Wave (II) hit the 'alt-coin' golden pocket of 0.618-0.786 Fibonacci retracement at the High Volume Node (HVN) support and descending support line which kicked off wave (III).
A breakout above the descending resistance line bring up the the next target of the HVN and previous swing high at $18-20 and $40 following a breakout above that.
Safe trading
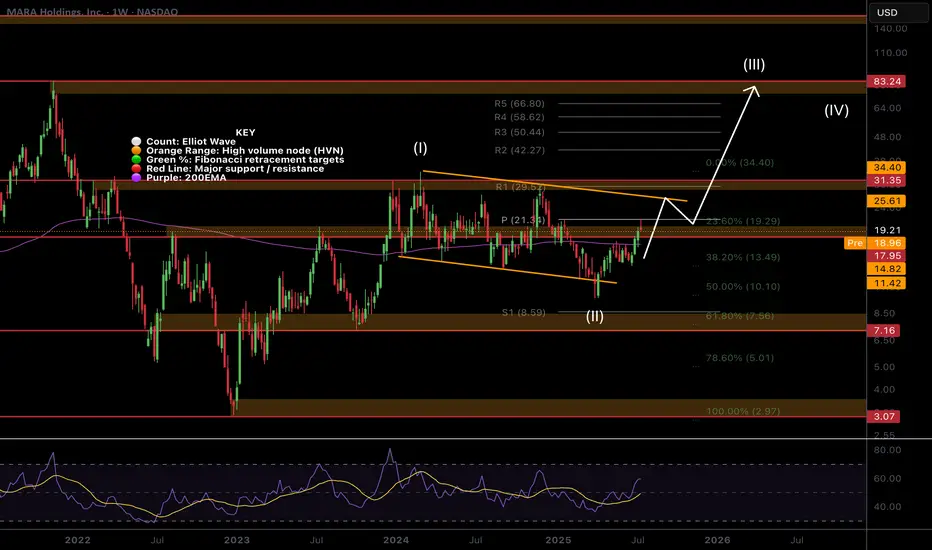
$MARA Hits the Weekly PivotNASDAQ:MARA path has been grinding higher clearing the High Volume Node (HVN) resistance where it is sat as support.
The weekly pivot rejected price perfectly so far but if the count is correct and Bitcoin doesn't dump I expect this continue strongly towards the descending orange line resistance as my partial take profit target.
Once that line is broken i am looking at terminal bull market targets of $80 but will of course take profit at key areas along the way.
Wave 2 swung below the descending support and recovered at 0.5 Fibonacci retracement potentially kicking off wave 3.
Safe trading
$HUT Clear for Further Upside?NASDAQ:HUT is having a great time clearing resistances, the weekly 200EMA and the weekly Pivot point did not prove challenging.
It is currently sitting in a High Volume Node (HVN) where price is likely to reject and retest the weekly pivot as support before continuing upwards towards $32 and beyond in wave 3.
Wave 2 tested the 'alt-coin' golden pocket between 0.618-0.782 Fibonacci retracement giving me confidence in the count.
Safe trading

Bitcoin Dominance Found The Top; ALTcoin Dominance Stepping InHello Crypto traders! BTC.Dominance is falling in an impulsive fashion after we spotted the top within the wedge pattern. Now that is trading in wave (v) of a five-wave impulse from the highs, it just confirms a bearish reversal, which indicates that ALTcoin dominance is stepping in. And with still bullish Crypto market, we might be in the ALTseason.
$CLSK Trapped between Critical Resistance and Support?NASDAQ:CLSK Shot through the weekly 200EMA and hit the weekly pivot resistance and was rejected into the High Volume Node (HVN) just below.
If the count is correct we should see price breakthrough in wave 3 after some consolidation and continue up after wave 2 tested the .618 Fibonacci retracement and HVN as support.
Heavy resistance HVN coupled with the R1 pivot at $20.40 will prove another challenge to overcome. Ultimately, if the count is correct AND Bitcoin doesn't tank we can expect a challenge of the all time highs up at $60.
I already closed partial take profit myself at the weekly pivot on a recent trade and will be looking to go long again to the those targets. Make sure to always be taking profits on the way as nobody has a Crystal ball!
RSI is currently printing a bearish divergence on the weekly so we need to see that negated.
Analysis is invalidated below $6.
Safe trading
Bitcoin Early, Not LateA simple graphic with all annotations included :
- Trend.
- Fibonnacci.
- Middle Line.
- Support and Bounces.
- Resistances and dips.
- Everyone gets Bitcoin at the price they deserve.
- Not a price Prediction, keep things simple.
Happy Tr4Ding !
BTC Rebounds From Channel Support With Critical Levels In Focus BTC Rebounds From Channel Support With Critical Levels In Focus 🟢📉
Structure remains firmly bullish, and price action is still unfolding within our previous analysis. After the breakout above the yellow trendline, BTC has entered a new ascending channel, and we’re now testing the lower boundary of this rising structure.
The main support sits at 114,921, the level from which the breakout occurred—an essential zone that may or may not be revisited. Based on market behavior and momentum, I currently do not expect this level to be retested, but it's one that must always be respected.
🟩 A deeper correction could lead us toward the previous ascending channel support near 112,400. This would be the last resort for bulls to hold structure intact.
⚠️ A break below 112K changes the narrative completely. That would mean we’re stepping into a potential trend reversal zone—so the market could be setting up for something more significant if that unfolds.
That said, my expectation leans toward a rebound from current levels. The sell-off may have flushed out late long entries, creating space for renewed bullish momentum. Let’s follow the levels and trade what we see—not what we feel.
One Love,
The FXPROFESSOR 💙
Disclosure: I am happy to be part of the Trade Nation's Influencer program and receive a monthly fee for using their TradingView charts in my analysis. Awesome broker, where the trader really comes first! 🌟🤝📈

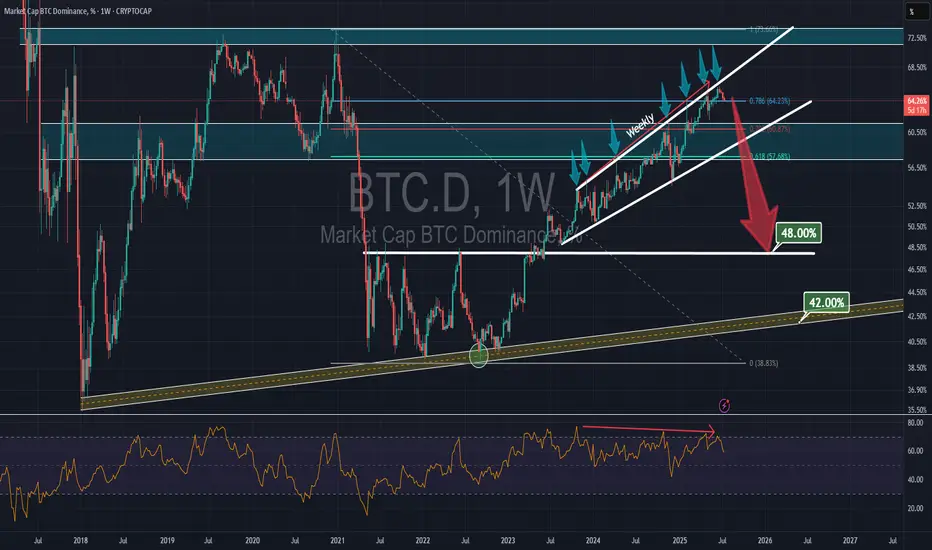
Bitcoin DOMINANCE dropssssBTC dominance has been within a rising channel since October 2023, showing a significant bearish divergence on the weekly RSI. After the seventh rejection from the channel's top, it may drop to the major support at 48%.
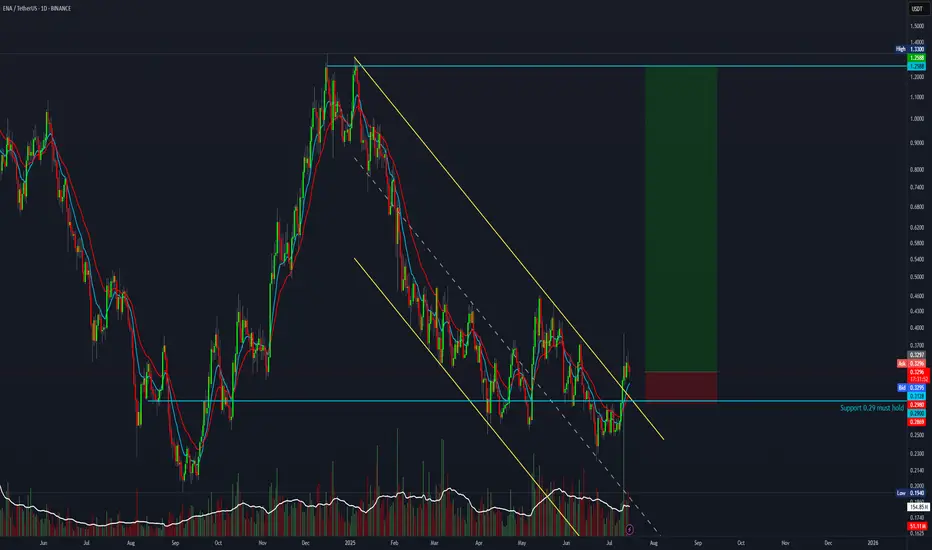
21:1 risk-to-reward trade setup for EthenaIs it time for the bulls to push it higher? This setup offers a 21:1 risk-to-reward ratio with a target of 1.25.
Entry 0.32
Stop loss 0.25
Target 1.25
Bitcoin – Rising channel with critical support at $119.000!The chart presented shows Bitcoin in a well-defined rising channel, highlighting a strong bullish momentum over recent trading sessions.
Rising channel
The price action is currently oscillating within the boundaries of this upward sloping channel, marked by parallel trendlines. The channel suggests that Bitcoin has been consistently making higher highs and higher lows, with the current price hovering around $121,794. The upper boundary near $123,200 acts as potential resistance, while the lower boundary of the channel provides dynamic support, suggesting a continuation pattern if this structure holds.
Uptrend
The overall uptrend is clearly visible and remains strong, especially since July 10th, where a significant bullish breakout occurred. The breakout was followed by steady gains, with minimal pullbacks, indicating strong buying interest and market confidence. The momentum shows a healthy bullish structure with minimal price overlap, characteristic of a trending market, which favors continuation as long as critical support levels remain intact.
Support area
A critical element in this chart is the key support area, highlighted in green. This support zone is located between approximately $118,500 and $119,600. This zone was previously a resistance level that has now turned into support following the breakout. It also aligns with the mid-level of the rising channel, reinforcing its significance. Should the price retrace, this area is likely to act as a cushion where buyers may step in again to defend the trend.
Fibonacci
Additionally, the chart features a Fibonacci retracement drawn from the swing low to the current swing high. The 0.618 Fibonacci level is particularly noteworthy, sitting at around $119,623. This level is known as the “golden ratio” in technical analysis and often acts as a strong retracement level during corrections. Below it, the 1.0 level is marked at $116,669, which represents a full retracement of the move and a deeper correction scenario if the support fails. These Fibonacci levels coincide with the key support zone, further validating it as an area of high confluence and likely buying interest.
Final thoughts
Overall, the technical structure remains bullish within the rising channel, with key levels of interest lying around $119,600 for support and $123,200 for potential resistance. A successful defense of the support area could propel the price higher toward the channel’s upper bound, while a breakdown may lead to a test of deeper Fibonacci retracement levels.
Disclosure: I am part of Trade Nation's Influencer program and receive a monthly fee for using their TradingView charts in my analysis.
Thanks for your support. If you enjoyed this analysis, make sure to follow me so you don't miss the next one. And if you found it helpful, feel free to drop a like and leave a comment, I’d love to hear your thoughts!

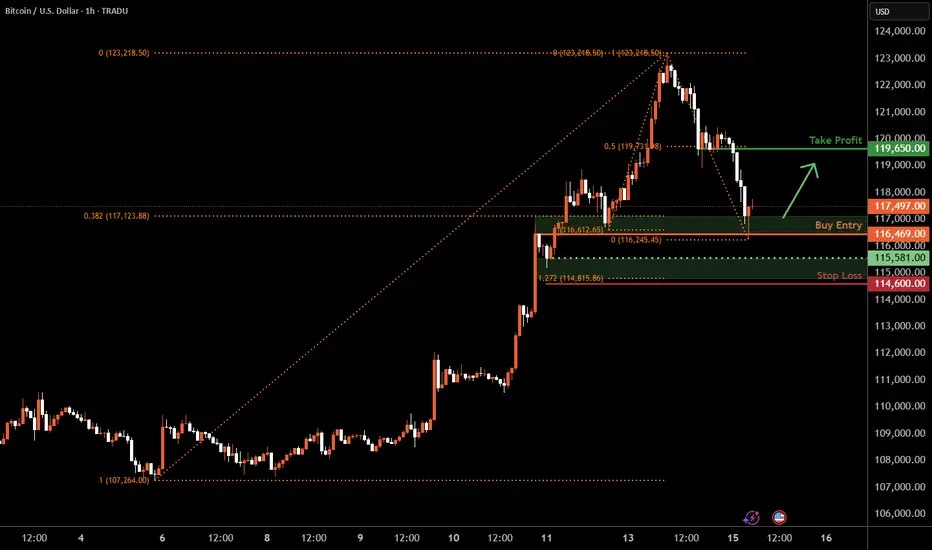
Bitcoin H1 | Potential bounce off a pullback supportBitcoin (BTC/USD) is falling towards a pullback support and could potentially bounce off this level to climb higher.
Buy entry is at 116,469.00 which is a pullback support that aligns closely with the 38.2% Fibonacci retracement.
Stop loss is at 114,600.00 which is a level that lies underneath a swing-low support and the 127.2% Fibonacci extension.
Take profit is at 119,650.00 which is a pullback resistance that aligns with the 50% Fibonacci retracement.
High Risk Investment Warning
Trading Forex/CFDs on margin carries a high level of risk and may not be suitable for all investors. Leverage can work against you.
Stratos Markets Limited (tradu.com ):
CFDs are complex instruments and come with a high risk of losing money rapidly due to leverage. 63% of retail investor accounts lose money when trading CFDs with this provider. You should consider whether you understand how CFDs work and whether you can afford to take the high risk of losing your money.
Stratos Europe Ltd (tradu.com ):
CFDs are complex instruments and come with a high risk of losing money rapidly due to leverage. 63% of retail investor accounts lose money when trading CFDs with this provider. You should consider whether you understand how CFDs work and whether you can afford to take the high risk of losing your money.
Stratos Global LLC (tradu.com ):
Losses can exceed deposits.
Please be advised that the information presented on TradingView is provided to Tradu (‘Company’, ‘we’) by a third-party provider (‘TFA Global Pte Ltd’). Please be reminded that you are solely responsible for the trading decisions on your account. There is a very high degree of risk involved in trading. Any information and/or content is intended entirely for research, educational and informational purposes only and does not constitute investment or consultation advice or investment strategy. The information is not tailored to the investment needs of any specific person and therefore does not involve a consideration of any of the investment objectives, financial situation or needs of any viewer that may receive it. Kindly also note that past performance is not a reliable indicator of future results. Actual results may differ materially from those anticipated in forward-looking or past performance statements. We assume no liability as to the accuracy or completeness of any of the information and/or content provided herein and the Company cannot be held responsible for any omission, mistake nor for any loss or damage including without limitation to any loss of profit which may arise from reliance on any information supplied by TFA Global Pte Ltd.
The speaker(s) is neither an employee, agent nor representative of Tradu and is therefore acting independently. The opinions given are their own, constitute general market commentary, and do not constitute the opinion or advice of Tradu or any form of personal or investment advice. Tradu neither endorses nor guarantees offerings of third-party speakers, nor is Tradu responsible for the content, veracity or opinions of third-party speakers, presenters or participants.
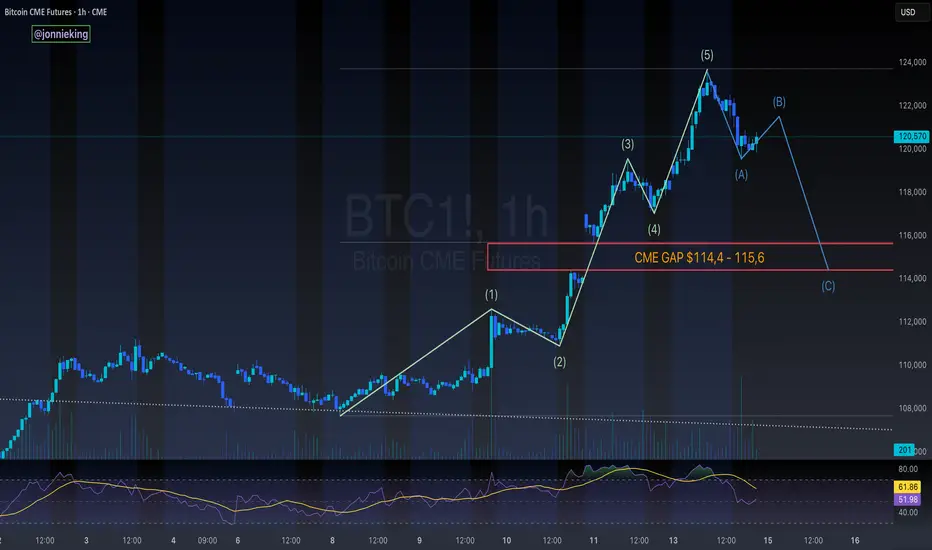
$BTC 5-Wave Impulse > ABC Correction > CME GapCRYPTOCAP:BTC appears to be headed towards an ABC correction after this impulsive 5-wave move to the upside
Would be a great opportunity to fill the CME gap ~$114k
Lines up perfectly with the 50% gann level retracement to confirm the next leg
don't shoot the messenger..
just sharing what i'm seeing 🥸
₿itcoin: Pushing Higher—But Watch for a Reversal AheadAfter taking a brief pause over the weekend, Bitcoin resumed its upward momentum early this morning, trading within the blue Target Zone between $117,553 and $130,891. This marks the first time the cryptocurrency giant has traded above the key $120,000 level. Within this zone, and in line with our primary scenario, we continue to anticipate the peak of the corrective wave B rally, followed by a trend reversal to the downside. We expect a significant wave C decline, targeting the lower blue zone between $62,395 and $51,323. As such, prices in the upper blue Target Zone may present an opportunity to take (partial) profits on existing long positions and, where appropriate, to initiate potential short positions as a hedge. These shorts could be protected with a stop 1% above the upper boundary of the zone, given there remains a 35% probability that Bitcoin could break directly above the $130,891 resistance and set a new high as blue wave alt.(i).
📈 Over 190 precise analyses, clear entry points, and defined Target Zones - that's what we do.

Retail in?After almost 3 decades as a trader, if there is one thing I have learned over the years, significant highs are made when sentiment is at extremes. Whether it is "mom and pop" or the "shoeshine guy" calling the top, it's when the buying (or selling) by retail is at a fever pitch. These days, you can't find a bear in Bitcoin, and the days on end of reports preaching "record inflows" is almost deafening.
Technically, Bitcoin is probing some key resistance today. It's stalled by the 161% Fibonacci extension of the recent early May highs to June lows. More importantly is the 127% extension of the January highs to April lows. RSI is very divergent as price hits new highs. And with sentiment at near extremes, bulls should be careful now. And a break back below the 112k level would be a very bearish "topping pattern" event.