BTC/USDT Analysis – Negative Sentiment Returns
Hello everyone! This is the daily analysis from the trader-analyst at CryptoRobotics.
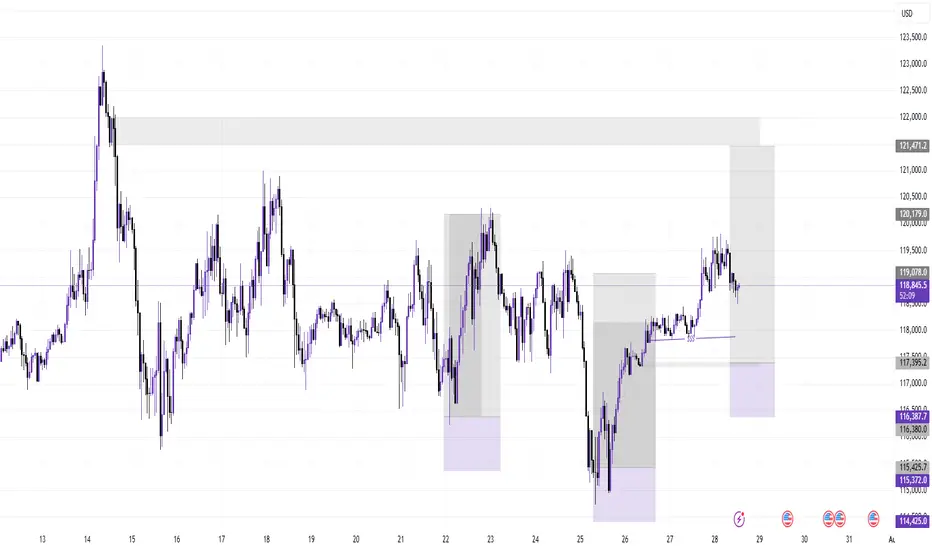
Yesterday, Trump officially imposed tariffs on 68 countries, which are set to take effect on August 7. The legality of these tariffs is already being challenged in court. The market reacted extremely negatively to this development — despite the overall positive technical setup and volume distribution, Bitcoin dropped to $114,000, deeply testing the volume zone and local lows.
Despite all of this, the bullish scenario should not be ruled out. The price action during the decline has been weak: while selling pressure is high, it has not led to a full breakdown of the lows. At this stage, it’s better to avoid opening new positions. Consider long setups only after a test of the $117,600–$118,600 supply zone, and watch for a buyer’s reaction on the retest.
If negative momentum continues, the price could drop further to the next support zone.
Buy zones:
• $110,000–$107,000 (accumulated volumes)
Sell zones:
• $117,600–$118,600 (accumulated volumes)
This publication is not financial advice.
Bitcoin (Cryptocurrency)

BITCOIN 2025 TOP PREDICTION!This chart represents the M2 Money Supply / BTCUSD correlation with an 84-day delay.
You can see that the M2 Money Supply has formed a double top (with a lower high) in late September.
The price of bitcoin tops out 525–532 days after the halving in every cycle.
What does this mean?
In my opinion, bitcoin will continue to follow the direction of M2 in a highly correlated manner. This would mean that BTC's top is only 2 months away.
What price will bitcoin top?
That I'm not entirely sure of yet. The M2 / BTC correlation can be placed in a plethora of different scales. However, it currently looks like the top will be BELOW $200,000.
I hope to be proven wrong, but as of right now, bitcoin is following previous cycles perfectly (excluding the fact that we created a new ATH prior the halving, this was because of ETFs).
Given diminishing returns (and assuming that "supercycle" is not reached), $135,000 - $190,000 top in late September makes sense.

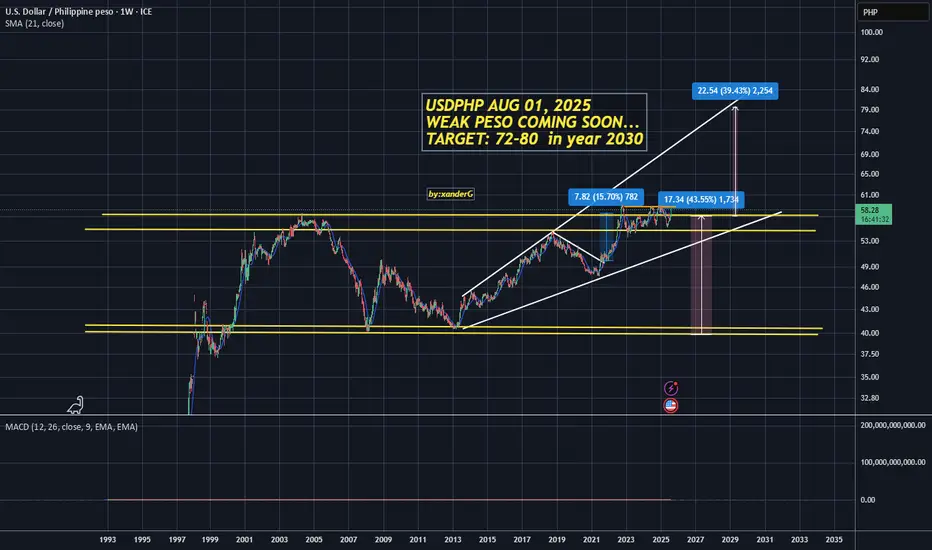
USDPHP The last straw: Breakout Imminent (2025-2030) Support/Resistance: 60.00 (Last line of defense)
Target: 72.00 - 80.00 (Upper resistance)
Timeframe: 2025-2030
Technical Outlook:
USDPHP is currently positioned at a critical juncture, with the 60.00 level serving as the final resistance before a significant breakout. The pair has been consolidating in a tight range, building momentum for the next major move.
Breakout Scenario:
Once USDPHP decisively breaks above the 60.00 resistance level, we anticipate a rapid acceleration toward the 72.00-80.00 resistance target. This represents a potential 20% move from current levels.
What to Watch:
Volume confirmation on breakout
Momentum indicators (RSI, MACD)
Key resistance levels at 65.00, 68.00, 72.00 and 80.00
Philippine Peso fundamentals and USD strength
This is why I firmly believe we'll witness BTC reach 150K soon.No caption needed and every reasons are kept in the chart. Zoom In and analyze every single lines in the chart and hope you will see what I tend to see as far as my capabilities allows me. Let me know your comments on the idea. I am looking forward to witness $150K in the next 3 to 4 months time. I will be updating my confluences to say this on higher timeframes too.
With Regards. And stay Tuned.

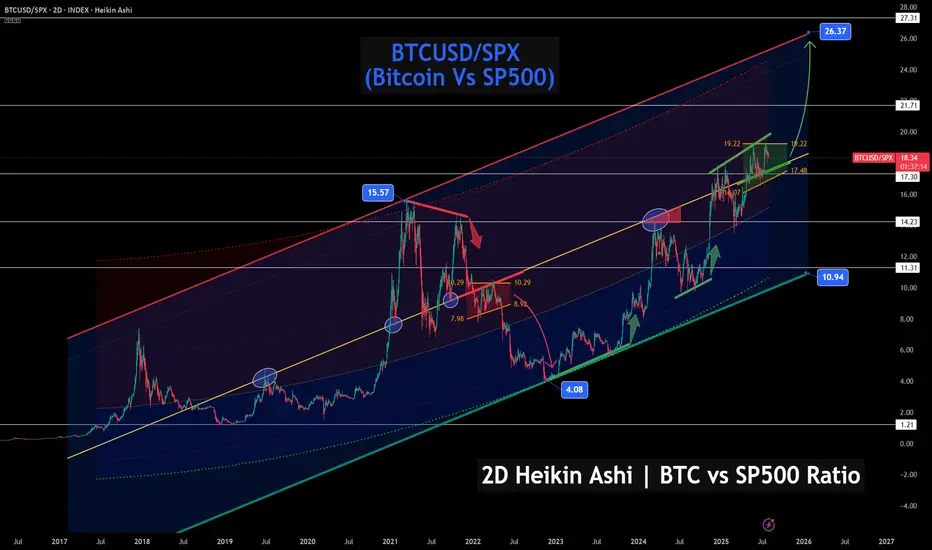
Bitcoin vs S&P 500 – Ratio Signals Strength, Chart favors BTC!🚀📊 Bitcoin vs S&P 500 – Ratio Signals Strength, Even If Stocks Correct 🔍📈
After posting earlier today about VOO (S&P 500 ETF) and the index itself hitting major resistance, I wanted to shift our focus to what could shine even if stocks pull back: Bitcoin.
This chart shows the BTCUSD/SPX ratio – in simple terms, how Bitcoin is performing relative to the S&P 500 . And what do we see? Clear, technical strength.
🔍 Key Observations:
BTC/SPX is currently breaking out from a bullish flag structure just above the 17.30–17.48 region
If the breakout holds, the projected technical target is near 26.37, the top of this multi-year channel
Historically, previous breakouts from similar zones have delivered explosive upside, even when equities struggled
🧠 So what does this mean?
Even if the stock market pulls back—as suggested in our earlier VOO/US500 chart—Bitcoin could still outperform, simply by dropping less, consolidating, or rising while stocks fall. That’s the power of analyzing ratios, not just absolute price.
We’ve already discussed how macro metrics like the Buffett Indicator (Stocks-to-GDP) are showing equity overvaluation. If capital starts rotating out of equities, Bitcoin is positioned as a beneficiary—especially if it maintains this relative strength.
💬 Final thoughts:
Don’t just look at BTC in isolation— look at it relative to what it's competing against
Ratios offer perspective: this one says Bitcoin’s trend vs stocks is up and strong
With solid support at 14.23 and room to run toward 26.37, this could be a chart to watch for months ahead
Are you watching this breakout? Let me know what your game plan is.
FOOD FOR THOUGHT: With Gold prices easing, stock markets at all time highs, is this the PERFECT time for big money to hedge with Bitcoin? Likely yes !
One Love,
The FX PROFESSOR 💙
Disclosure: I am happy to be part of the Trade Nation's Influencer program and receive a monthly fee for using their TradingView charts in my analysis. Awesome broker, where the trader really comes first! 🌟🤝📈
Strategy Hit SupportMSTR should easily hold $246 and make its way back up to $418 and form it's next support there.
Good luck!

Bitcoin held the $115k level ┆ HolderStatBINANCE:BTCUSDT is currently in a triangle formation just above key support near 112,000. The price recently dipped below short-term support, likely triggering stop-losses, but still holds inside a bullish structure. If momentum builds, a push toward 125,000+ is likely. The trend remains intact above 110,000.
TradeCityPro | Bitcoin Daily Analysis #140👋 Welcome to TradeCity Pro!
Let’s dive into the Bitcoin analysis. Yesterday, the interest rate decision by the US Federal Reserve was announced, and once again, just like the past few months, it remained unchanged. Let’s see what impact it had on Bitcoin.
⏳ 4-Hour Timeframe
In the 4-hour timeframe, after the announcement of the unchanged interest rate and Powell’s speech, Bitcoin printed a red candle on the support zone and even wicked lower, but then recovered and the price returned back into the box.
✔️ Basically, we can say that this month’s rate decision had no real impact on the market, and Bitcoin is still moving inside its range box. The fact that the support zone wasn’t lost is a positive sign for the continuation of the trend.
⭐ But the important point is this: if the uptrend is going to continue, the price must print a higher high or at least a level equal to 120041, and in my opinion, if for any reason a lower high gets printed, the chances of breaking below 116829 significantly increase.
📊 I currently have no new position on Bitcoin, and all my entries are below 110000. But if 120041 breaks, I’ll open a long position for the next bullish wave that Bitcoin might start.
💥 A major trigger for starting a new leg is the 61.67 level on the RSI. As long as RSI remains below this level, there’s no bullish momentum in the market — and considering that the number of touches to 116829 has increased, the probability of a correction is also rising.
❌ Disclaimer ❌
Trading futures is highly risky and dangerous. If you're not an expert, these triggers may not be suitable for you. You should first learn risk and capital management. You can also use the educational content from this channel.
Finally, these triggers reflect my personal opinions on price action, and the market may move completely against this analysis. So, do your own research before opening any position.

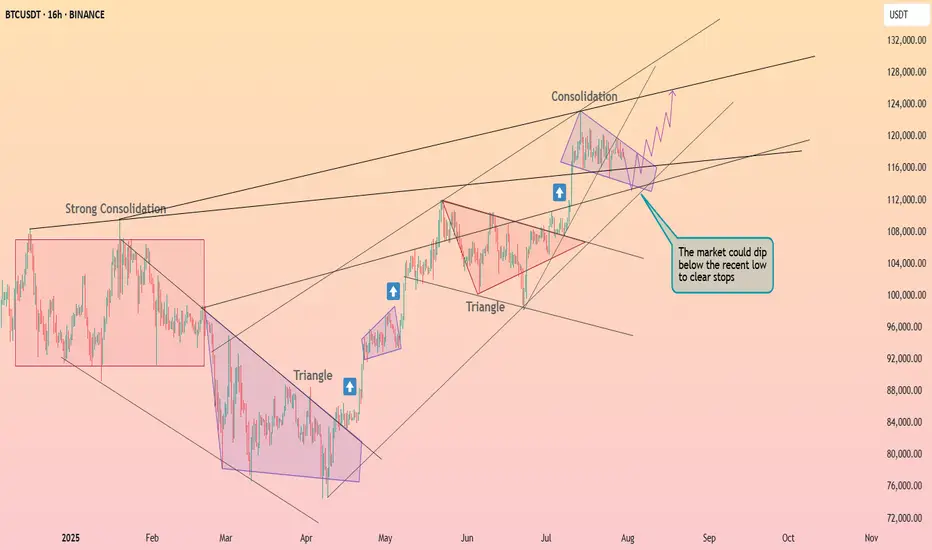
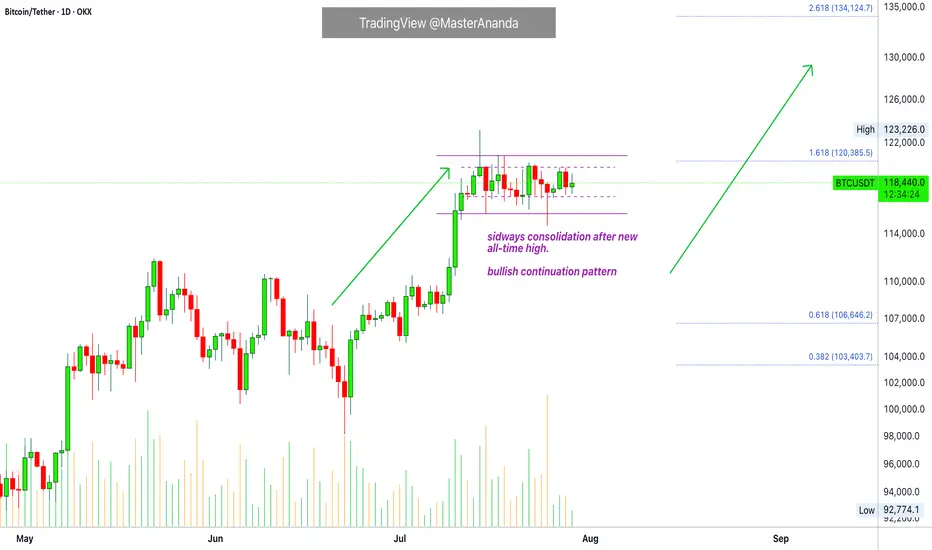
Bitcoin & The Altcoins —Name Your AltcoinBitcoin is sideways right now and is moving in a very tight and narrow range. All the action has been happening between $117,000 and $120,000 based on candle close since 11-July. This is bullish, think about it.
Bitcoin hits a new all-time high and next thing you know it turns sideways very close to resistance. The only drop was short-lived and everything sold was quickly bought. Why is Bitcoin consolidating so close to resistance? It is preparing to move ahead.
What happens when Bitcoin moves forward after so much recovery? Everything experiences a positive cycle. This is a very strong signal.
This chart allows for more whipsaw as you know nothing else is possible in a trading range. We predict the pattern to resolve bullish, but there can be swings to either side. A swing down just as it happened 25-July. A swing up just as it happened 14-July. This is always possible but the end result won't change. Bitcoin will continue sideways but when the sideways period is over, you will not see a move toward $110,000 or $100,000. The break of the trading range will confirm the advance toward $135,000 next month. Bitcoin is likely to continue in the same mode. While Bitcoin consolidates the new advance, the altcoins grow. In this way the entire market continues to recover and grow month after month after month.
Name Your Altcoin
Leave a comment with your favorite altcoin trading pair and I will do an analysis for you. I will reply in the comments section. Make sure to include any questions you might have beforehand.
If you see a comment with a pair you like, boost and reply so these can be done first.
Thanks a lot for your continued support.
Namaste.
BTC/USDT Analysis: Testing Strong Support
Hello everyone! This is the daily analysis from CryptoRobotics' trader-analyst.
Yesterday, we tested the local support zones previously marked and moved into a decline. At 21:00 (GMT+3), the U.S. Federal Reserve released its monetary policy statement, which included hawkish comments regarding inflation risks. The interest rate remained unchanged. The market reacted negatively to this news, and Bitcoin accelerated its drop.
At one point, a key buyer zone at $116,200–$115,000 (volume anomalies) was tested. Then, between 21:30 and 22:00 (GMT+3), a report from the White House on digital assets was released, shifting focus toward a more positive regulatory outlook. Bitcoin bounced from the mentioned zone and has since fully recovered the drop.
Currently, there are no immediate resistance levels, so in the near term, we’re likely to see a test of the ~$120,000 level. There, it's important to watch for any signs of selling pressure.
Buy Zones:
• $116,200–$115,000 (volume anomalies)
• $110,000–$107,000 (accumulated volume)
This publication does not constitute financial advice.

TON/USDT | Surges 18% – Eyes on $3.63, Then $4.20 and $4.68!By analyzing the Toncoin chart on the 3-day timeframe, we can see that after a pullback to the $3 area, strong demand kicked in, and within just one week, the price surged over 18%, reaching above $3.5. Toncoin is currently trading around $3.53, and I expect it to hit the $3.63 target soon. The next bullish targets after that are $4.20 and $4.68.
Please support me with your likes and comments to motivate me to share more analysis with you and share your opinion about the possible trend of this chart with me !
Best Regards , Arman Shaban
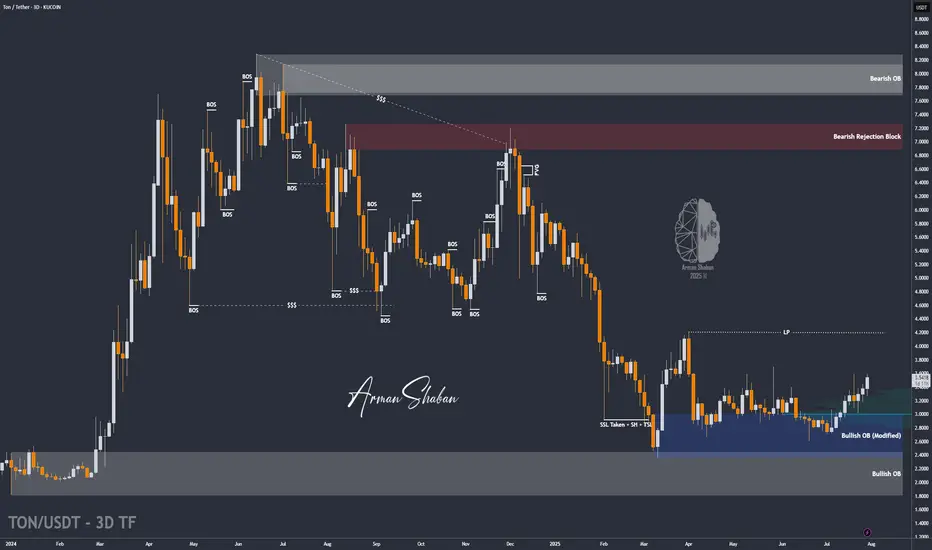
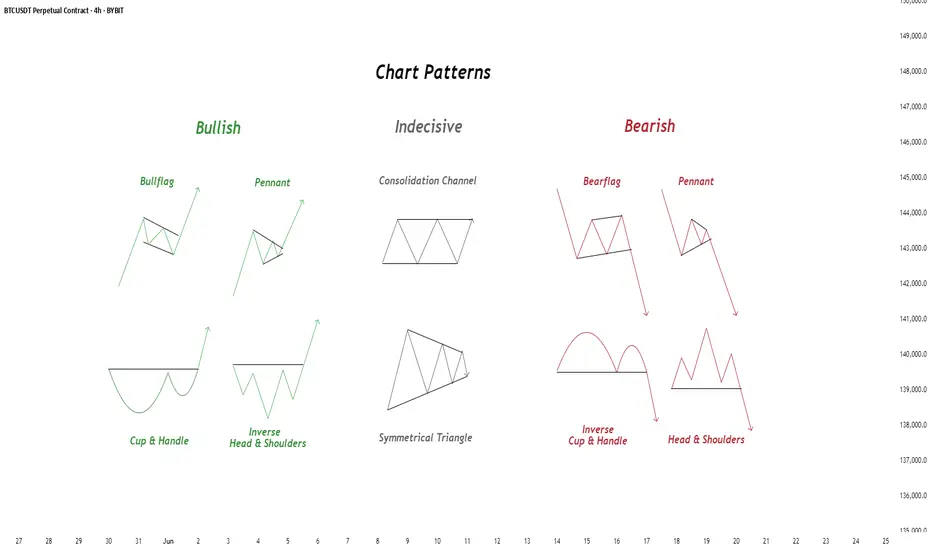
Chart Patterns - How to read them like a ProChart patterns are visual formations on price charts that help traders anticipate potential market movements.
These patterns fall into three main categories: bullish , bearish , and indecisive .
---
1. Bullish Chart Patterns
Bullish patterns often signal that price is likely to move upward.
1.1 Bull Flag
* What it looks like: A sharp upward move followed by a small downward-sloping rectangle (the flag).
* Meaning: After a strong rally, the price consolidates briefly before continuing higher.
* Key insight: A breakout above the flag typically signals a continuation of the trend.
1.2 Pennant (Bullish)
* What it looks like: A strong upward move followed by a small symmetrical triangle.
* Meaning: Similar to the bull flag, but the consolidation takes a triangular form.
* Key insight: Once price breaks above the pennant, the uptrend often resumes.
1.3 Cup & Handle
* What it looks like: A “U”-shaped curve (the cup) followed by a small downward drift (the handle).
* Meaning: This pattern suggests a period of accumulation before price breaks higher.
* Key insight: A breakout above the handle signals the beginning of a new bullish leg.
1.4 Inverse Head & Shoulders
* What it looks like: Three low points, with the middle low being the deepest.
* Meaning: This reversal pattern appears after a downtrend and signals a potential change to an uptrend.
* Key insight: A breakout above the “neckline” confirms the reversal.
---
2. Indecisive Chart Patterns
These patterns show market hesitation, where neither bulls nor bears are clearly in control.
2.1 Consolidation Channel
* What it looks like: Price moves within a horizontal channel.
* Meaning: Market is moving sideways with no strong trend.
* Key insight: A breakout in either direction often leads to a significant move.
2.2 Symmetrical Triangle
* What it looks like: Two converging trend lines forming a triangle.
* Meaning: This is a neutral pattern that can break out in either direction.
* Key insight: Traders wait for a breakout before taking a position.
---
3. Bearish Chart Patterns
Bearish patterns signal a high probability of downward price movement.
3.1 Bear Flag
* What it looks like: A sharp decline followed by a small upward-sloping rectangle.
* Meaning: After a strong drop, price consolidates before continuing lower.
* Key insight: A breakout below the flag suggests a continuation of the downtrend.
3.2 Pennant (Bearish)
* What it looks like: A sharp downward move followed by a small symmetrical triangle.
* Meaning: Similar to the bear flag, but the consolidation takes a triangular form.
* Key insight: A breakout downward typically resumes the bearish trend.
3.3 Inverse Cup & Handle
* What it looks like: An upside-down cup with a small upward drift forming the handle.
* Meaning: Indicates weakness after an uptrend, often followed by a drop.
* Key insight: A break below the handle usually signals a strong bearish move.
3.4 Head & Shoulders
* What it looks like: Three peaks, with the middle one being the highest.
* Meaning: A classic reversal pattern that indicates a potential shift from an uptrend to a downtrend.
* Key insight: A break below the “neckline” confirms the bearish reversal.
---
How to Use These Patterns
* Combine pattern recognition with support/resistance, volume, and indicators for stronger confirmation.
* Always wait for breakouts and avoid acting too early.
* Manage risk with stop-loss orders.
DOGE/USDT | Eyes Bounce from Key Support – Next Targets Ahead!By analyzing the Dogecoin chart on the daily timeframe, we can see that after reaching the $0.29 area, the price entered a correction and is now trading around $0.22. If DOGE dips into the key support zone between $0.19–$0.21, we could expect a strong bullish reaction. The next potential targets are $0.287, $0.32, $0.41, and $0.70.
Please support me with your likes and comments to motivate me to share more analysis with you and share your opinion about the possible trend of this chart with me !
Best Regards , Arman Shaban

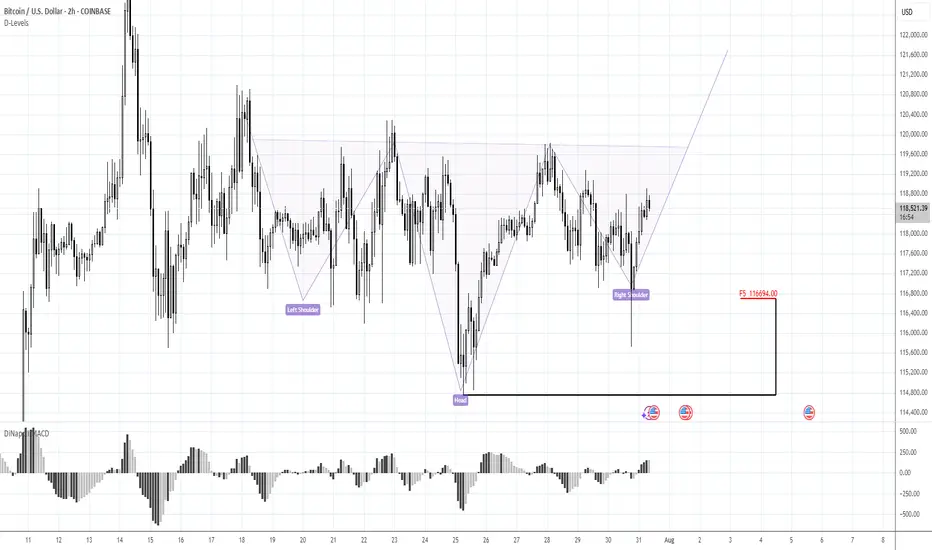
Keep following to the H&S PatternMorning folks,
To be honest, not too many things to talk about. We've prepared our scenario with H&S is still valid. Reaction to GDP numbers was quite welcome as it set the right arm's bottom. The only thing that we have to be busy with is to control its validity - reaching of the neckline and price standing above 116 lows and right arm.
At the first signs that market is start falling back - do not take any new longs. H&S failure is also the pattern and in this case we get deeper correction. But daily chart still makes me think that bullish context is here
BITCOIN & 134KAfter Bitcoin rallied on July 8 and consolidated for two weeks, this bull flag remains valid, targeting $134,000.

#BTC Update #12 – July 31, 2025#BTC Update #12 – July 31, 2025
Bitcoin is currently at the upper boundary of the channel it has been following. It may experience a pullback from this upper boundary. This pullback is estimated to reach the $116,800 level. If it wants to go lower, it could drop as far as the $114,500 level.
There is a significant amount of liquidity between $121,000 and $117,000. Bitcoin may also try to sweep this area. However, despite 4 or 5 attempts, it still hasn’t managed to break above the upper resistance zone. Therefore, a pullback should always be taken into account.
Overall, Bitcoin is still in a correction within a correction. That means no impulsive move has occurred yet. It’s not at a suitable point for either long or short positions. You may choose to trade within this range, but keep in mind that it's quite risky.

Waiting Patiently for this bias on BTCUSDWaiting for BTC to come clear the liquidity as shown in my chart setup, then I'm entering for a BUY following the overall trend.
BTCUSDT – Diametric G-Leg Underway?⏱ Timeframe: 4H / 1H
🔍 Method: NeoWave + Smart Money Concepts (SMC)
📍Posted by: CryptoPilot
⸻
🧠 NeoWave Progression Update
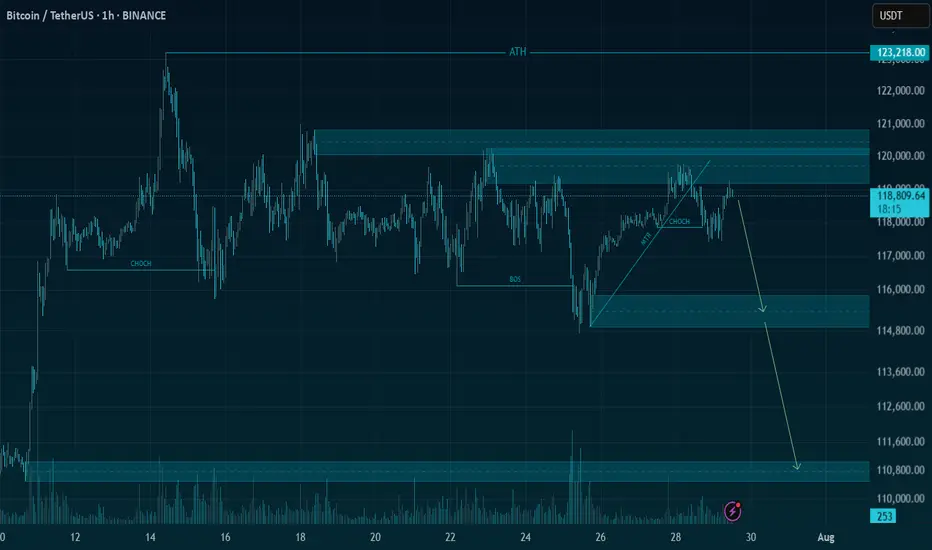
As outlined in our previous analysis, we are tracking a potential Contracting Diametric structure (A–G) originating from the March 2025 highs.
🚨 The G-Leg may now be actively unfolding.
Here’s what just happened:
• Price rejected sharply from the supply zone near 119,000–119,500, exactly where Wave F was expected to end.
• After a drop to 115,780 (minor trendline), price bounced, but failed to make a new high, stalling at 118,700, forming a lower high → classic signature of a developing G-Leg.
• This G-wave likely aims to break below Wave E low, seeking imbalance fills and structural resets.
⸻
📊 Smart Money Confluence (SMC / ICT)
• 🟥 Bearish Market Structure confirmed via MSS on 1H: Lower Highs + Internal BOS
• 🟨 Buy-side Liquidity above 120k was already swept
• 🔻 Price failed to reclaim OB block around 119.5k
• 🧩 FVGs remain open between 114.5k–113k, acting as magnet zones
• 📉 Expectation: Price may now break the ascending minor trendline and accelerate toward the major structure low
📌 Primary Scenario:
• Wave G of Diametric in motion
• Potential structure: Zigzag or Complex Combination
• Expectation: Bearish continuation to break below 113k
📌 Alternative Scenario:
• If price closes above 120.5k, diametric structure may be invalidated
• Watch for triangle/flat development instead
⸻
⚠️ Risk Management Note:
Price action near 118.7k–119.5k is crucial. Reclaiming that zone with strength changes the bias. Until then, sellers remain in control.
💬 Final Thought:
We’re tracking the final stages of a multi-month complex correction. The rejection at supply, combined with SMC signals and NeoWave symmetry, suggests sellers may push price into deeper demand zones soon.
⸻
📌 Follow CryptoPilot for advanced wave structure updates, market geometry insights, and ICT-style smart money traps.
💬 Share your views or alternate wave counts in the comments!

BTCUSD – Descending Channel or Bullish Flag?BINANCE:BTCUSDT – Market Maker’s Game Inside a Descending Channel
Timeframe: 2H | MJTrading View
Market Structure Overview:
Bitcoin recently printed a new ATH at $122,000 after a parabolic run from the previous ATH at $111,937.
Since then, price has been consolidating inside a descending channel, which could act as a bullish flag in higher timeframes.
Liquidity pools are clearly formed:
Above $122K – resting stops of late shorts.
Below $115K–$114K – weak long stops and untapped demand near the Order Block (OB).
Key Levels & Liquidity Zones:
Upside:
$122K Liquidity Pool → If swept, could trigger momentum towards $124K–$125K.
Downside:
$116K OB → First defensive zone for bulls.
$112K Strong Support → Aligns with previous ATH breakout base.
Market Maker’s Dilemma:
If you were a market maker… which liquidity pool would you hunt first?
Price is coiling tighter within the channel, and both scenarios are possible:
Upside Sweep → Rapid breakout above $122K to clear shorts, then potential continuation.
Downside Sweep → Sharp drop into $116K–$112K liquidity, flushing longs before any recovery.
⚡ MJTrading Insight:
This is the classic market maker compression – first sweep likely determines direction.
Patience here is key; let the liquidity tell the story.
#BTCUSD #Bitcoin #Liquidity #SmartMoney #PriceAction #MJTrading #ChartDesigner #CryptoAnalysis
Psychology Always Matters:

Dash RocketDash has been in a bearish trend for some time now, but it has stood the test of time being one of the OG coins of the market with this double bottom within this descending channel on the daily and a retest of demand I believe this coin will see $50 soon.
It’s master node runners and minors have kept the chain going, and we should be breaking its bearishness very soon.

Important Volatility Period: August 2nd - 5th
Hello, fellow traders!
Follow us for quick updates.
Have a great day!
-------------------------------------
(BTCUSDT 1M Chart)
Let's take a moment to check the trend before the new month begins.
There have been two major declines so far, and a third major decline is expected next year.
For the reason, please refer to the "3-Year Bull Market, 1-Year Bear Market Pattern" section below.
-
My target point for 2025 is around the Fibonacci ratio of 2.618 (133889.92).
However, if the price surges further, it could touch the Fibonacci range of 3 (151018.77) to 3.14 (157296.36).
If it rises above 133K, it's expected that prices will never fall below 43823.59 again.
Since the HA-Low indicator hasn't yet been created on the 1M chart, we need to monitor whether it appears when a downtrend begins.
Based on the current trend, the HA-Low indicator is expected to form around 73499.86.
More details will likely be available once the movement begins.
-
The basic trading strategy involves buying in the DOM(-60) ~ HA-Low range and selling in the HA-High ~ DOM(60) range.
However, if the price rises above the HA-High ~ DOM(60) range, a step-up trend is likely, while if the price falls below the DOM(-60) ~ HA-Low range, a step-down trend is likely.
Therefore, the basic trading strategy should be a segmented trading approach.
The further away from the HA-High indicator, the more likely it is that the DOM(60) indicator will act as a strong resistance when it forms.
Therefore, if the current price and the HA-High indicator are trading far apart, and the DOM(60) indicator forms, it is expected to face significant resistance.
-
Looking at the current trend formation, the high trend line is drawn correctly, but the low trend line is not.
This is because the StochRSI indicator failed to enter the oversold zone.
Therefore, the low trend line is marked with a dotted line, not a solid line.
Therefore, what we should pay attention to is the high trend line.
We need to see if the uptrend can continue along the high trend line.
-
(1D chart)
If we use the trend lines drawn on the 1M, 1W, and 1D charts to predict periods of volatility, the periods around August 5th and August 13th are significant periods of volatility.
By breaking this down further, the volatility periods are around July 31st, August 2nd-5th, and August 13th.
Therefore, trading strategies should be developed based on the assumption that the volatility period extends from July 30th to August 14th.
The current price is moving sideways in the 115,854.56-119,177.56 range.
This range, the HA-High ~ DOM (60), is a crucial area to consider for support.
This will determine whether the price will continue its upward trend by rising above 119,177.56, or whether it will turn downward by falling below 115,854.56.
If the price falls below 115854.56, it is expected to meet the M-Signal indicator on the 1W chart and reestablish the trend.
The HA-High indicator on the 1W chart is forming at 99705.62, and the DOM (60) indicator on the 1W chart is forming at 119086.64.
Therefore, when the price declines, it is important to check where the HA-High indicator on the 1W chart forms and determine whether there is support near that point.
-
The On-Board Value (OBV) indicator within the Low Line ~ High Line channel is showing a downward trend.
If the OBV falls below the Low Line, the price is expected to plummet.
Therefore, it is necessary to closely monitor the movements of the OBV indicator.
The Trend Check indicator is a comprehensive evaluation of the StochRSI, PVT-MACD Oscillator, and On-Board Value (OBV) indicator.
The TC (Trend Check) indicator interprets a rise from the 0 point as a buying trend, while a decline indicates a selling trend.
In other words, a rise from the 0 point is likely to indicate an uptrend, while a decline is likely to indicate a downtrend.
Currently, the TC (Trend Check) indicator is below the 0 point, suggesting a high probability of a downtrend.
However, if the TC (Trend Check) indicator touches a high or low, the trend may reverse.
In other words, touching a high increases the likelihood of a reversal from an uptrend to a downtrend, while touching a low increases the likelihood of a reversal from a downtrend to an uptrend.
When such movements occur, it's important to consider the support and resistance levels formed around the price level to determine a response.
In other words, consider the support and resistance levels formed at the current price level.
As a significant period of volatility approaches, prepare to transition from box trading to trend trading.
-
Thank you for reading to the end.
I wish you successful trading.
--------------------------------------------------
- Here's an explanation of the big picture.
(3-year bull market, 1-year bear market pattern)
I'll explain more in detail when the bear market begins.
------------------------------------------------------

BTCUSDT | Bitcoin needs liquidity to be able to go up more🚀 Trade Setup Details:
🕯 #BTC/USDT 🔽 Sell | Short 🔽
⌛️ TimeFrame: 1H
--------------------
🛡 Risk Management:
🛡 If Your Account Balance: $1000
🛡 If Your Loss-Limit: 1%
🛡 Then Your Signal Margin: $1204.82
--------------------
☄️ En1: 118829.28 (Amount: $120.48)
☄️ En2: 119162.54 (Amount: $421.69)
☄️ En3: 119400.34 (Amount: $542.17)
☄️ En4: 119638.61 (Amount: $120.48)
--------------------
☄️ If All Entries Are Activated, Then:
☄️ Average.En: 119283.83 ($1204.82)
--------------------
☑️ TP1: 118025.43 (+1.05%) (RR:1.27)
☑️ TP2: 117427.5 (+1.56%) (RR:1.88)
☑️ TP3: 116671.89 (+2.19%) (RR:2.64)
☑️ TP4: 115717.73 (+2.99%) (RR:3.6)
☑️ TP5: 114673.35 (+3.87%) (RR:4.66)
--------------------
❌ SL: 120276.34 (-0.83%) (-$10)
--------------------
💯 Maximum.Lev: 66X
⌛️ Trading Type: Swing Trading
‼️ Signal Risk: ⚠️ High-Risk! ⚠️
🔎 Technical Analysis Breakdown:
This technical analysis is based on Price Action, Elliott waves, SMC (Smart Money Concepts), and ICT (Inner Circle Trader) concepts. All entry points, Target Points, and Stop Losses are calculated using professional mathematical formulas. As a result, you can have an optimal trade setup based on great risk management.
⚠️ Disclaimer:
Trading involves significant risk, and past performance does not guarantee future results. This analysis is for informational purposes only and should not be considered financial advice. Always conduct your research and trade responsibly.
💡 Stay Updated:
Like this technical analysis? Follow me for more in-depth insights, technical setups, and market updates. Let's trade smarter together!
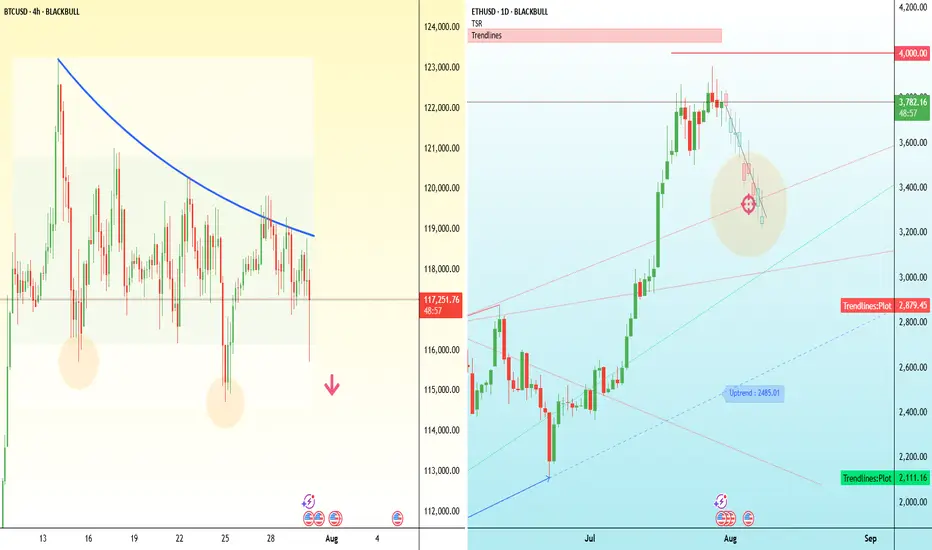
Major test for crypto bulls - BTC and ETH Bitcoin has dipped below $118,000, putting pressure on the bullish structure that’s held for the past two weeks.
The attempted breakout above $121,000 has failed, and price is now breaking down through the middle of the consolidation range, threatening short-term higher lows. On the 4H chart, this move resembles a failed breakout with a potential double-top near $121,000.
If Bitcoin can’t reclaim $116,000 quickly, the next downside levels to watch are $114,000 and $110,000.
Ethereum, meanwhile, has stalled just below $3,800 after a strong rally this month. Price action has flattened out over the past few days, with several failed attempts to push through that level. The key upside trigger remains $4,000.
But if $3,700 gives way, ETH may slide back to the $3,450–$3,300 region, where previous resistance and the rising trendline converge.