weekly BULL-FLAG!it looks like after the rally bitcoin had since early April, now this is a bull-flag pattern on weekly and that can push bitcoin to $140k.
Bitcoin (Cryptocurrency)

what's the trend?this is what i'm aiming, not to go against the community but against the institutions. something needs to change and bitcoin was made to give power to people, hopefully everyone acting in good faith.
we need cleansing.
"smart money" = a wise ass trying to take advantage of you.

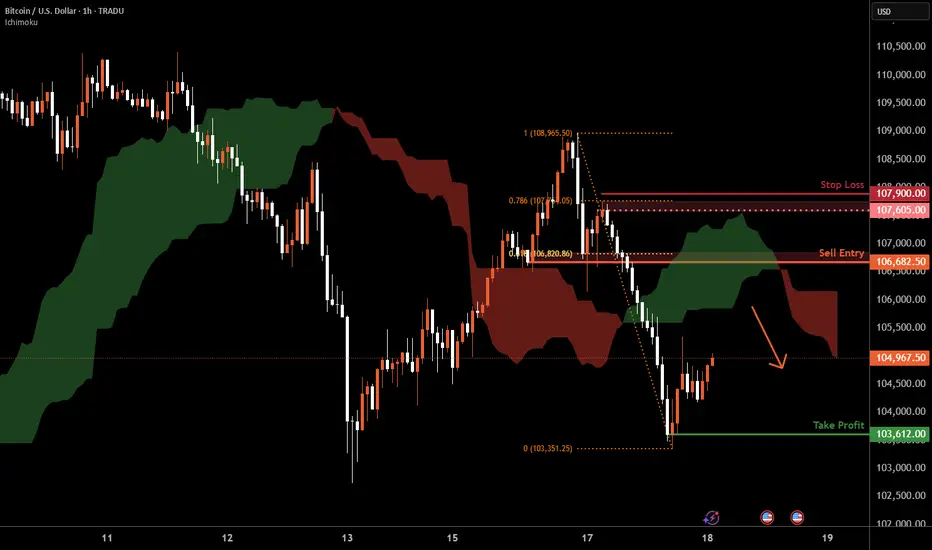
Bitcoin H1 | Pullback resistance at 61.8% Fibonacci retracementBitcoin (BTC/USD) is rising towards a pullback resistance and could potentially reverse off this level to drop lower.
Sell entry is at 106,682.50 which is a pullback resistance that aligns with the 61.8% Fibonacci retracement.
Stop loss is at 107,900.00 which is a level that sits above the 78.6% Fibonacci retracement and a swing-high resistance.
Take profit is at 103,612.00 which is a swing-low support.
High Risk Investment Warning
Trading Forex/CFDs on margin carries a high level of risk and may not be suitable for all investors. Leverage can work against you.
Stratos Markets Limited (tradu.com ):
CFDs are complex instruments and come with a high risk of losing money rapidly due to leverage. 63% of retail investor accounts lose money when trading CFDs with this provider. You should consider whether you understand how CFDs work and whether you can afford to take the high risk of losing your money.
Stratos Europe Ltd (tradu.com ):
CFDs are complex instruments and come with a high risk of losing money rapidly due to leverage. 63% of retail investor accounts lose money when trading CFDs with this provider. You should consider whether you understand how CFDs work and whether you can afford to take the high risk of losing your money.
Stratos Global LLC (tradu.com ):
Losses can exceed deposits.
Please be advised that the information presented on TradingView is provided to Tradu (‘Company’, ‘we’) by a third-party provider (‘TFA Global Pte Ltd’). Please be reminded that you are solely responsible for the trading decisions on your account. There is a very high degree of risk involved in trading. Any information and/or content is intended entirely for research, educational and informational purposes only and does not constitute investment or consultation advice or investment strategy. The information is not tailored to the investment needs of any specific person and therefore does not involve a consideration of any of the investment objectives, financial situation or needs of any viewer that may receive it. Kindly also note that past performance is not a reliable indicator of future results. Actual results may differ materially from those anticipated in forward-looking or past performance statements. We assume no liability as to the accuracy or completeness of any of the information and/or content provided herein and the Company cannot be held responsible for any omission, mistake nor for any loss or damage including without limitation to any loss of profit which may arise from reliance on any information supplied by TFA Global Pte Ltd.
The speaker(s) is neither an employee, agent nor representative of Tradu and is therefore acting independently. The opinions given are their own, constitute general market commentary, and do not constitute the opinion or advice of Tradu or any form of personal or investment advice. Tradu neither endorses nor guarantees offerings of third-party speakers, nor is Tradu responsible for the content, veracity or opinions of third-party speakers, presenters or participants.
Next Volatility Period: Around June 22
Hello, traders.
If you "Follow", you can always get new information quickly.
Have a nice day today.
-------------------------------------
(BTCUSDT 1M chart)
The morning star candle that we often heard about when studying candles appeared.
However, since the candle has not closed yet, the shape of the candle may change.
In stock charts, there were cases where the movement could be predicted with the shape of these candles, but in the coin market, it is impossible to predict.
The reason is that trading is possible 24 hours a day.
Most candle shapes occur with gaps, allowing for a comprehensive interpretation, but in the coin market, gaps are not likely to occur, so I think there is nothing that can be known from the shape of the candles.
Therefore, it is recommended not to try to analyze the chart with the actual shape or pattern of the candles.
However, you need to study to be able to read the arrangement of the candles in order to set support and resistance points.
Even this is not difficult to indicate support and resistance points because there are indicators that indicate support and resistance points.
-
(1W chart)
The 104463.99 point is the DOM (60) indicator point, which corresponds to the end of the high point.
Also, the 99705.62 point is the HA-High indicator point, which corresponds to the middle of the high points.
Therefore, the 99705.62-104463.99 section can be interpreted as the high point boundary section.
The actual trend is likely to occur while falling from 99705.62.
The importance of the 99705.62 point is increasing because the M-Signal indicator on the 1W chart is rising near the HA-High indicator point.
If it falls below the M-Signal indicator on the 1W chart, it is possible that the trend will be determined again when it meets the M-Signal indicator on the 1M chart.
Also, if it falls from the HA-High indicator, it can meet the HA-Low indicator.
Therefore, if the price starts to fall, you should check whether the HA-Low indicator is generated.
The fact that the HA-Low indicator was created means that it rose from the low range.
That is, just as the HA-High indicator corresponds to the midpoint of the highs, the HA-Low indicator corresponds to the midpoint of the lows.
The end point of the lows corresponds to the DOM(-60) indicator point.
-
(1D chart)
For this reason, it is important to see support around 104463.99-106133.74.
The trend is likely to appear after the next volatility period, around June 22nd (June 21st-23rd).
Therefore, we should consider the 104463.99-106133.74 range as the middle range,
- and see if it falls below 99705.62,
- or rises above 108316.90.
Accordingly, we should create a response strategy and be prepared not to panic when a trend appears.
-
The OBV is currently below the Low Line.
Therefore, if it does not receive support at the 104463.99 point, it is likely to fall again.
Since the OBV oscillator is still below the 0 point, we can see that the selling pressure is strong.
However, looking at the overall movement of the oscillator, we can see that the selling pressure is decreasing.
Therefore, if there is another decline, the key issue is whether there is support near 99705.62.
-
In summary, the area around 104463.99 is playing an important role as support and resistance.
Therefore, after the next volatility period, around June 22, we need to check and respond to the direction in which it deviates from the 99705.62-108316.90 range.
-
Thank you for reading to the end.
I hope you have a successful trade.
--------------------------------------------------
- This is an explanation of the big picture.
(3-year bull market, 1-year bear market pattern)
I will explain more details when the bear market starts.
------------------------------------------------------

Bitcoin Short-Term 4H Timeframe, Still Bullish But...Bitcoin continues bullish on the 4H timeframe and we have some positive signals coming out of the most recent swing and shakeout.
» The action went below 0.618 but is back above this level.
» The higher low did not reach 0.786 Fib. retracement support, which is a signal of strength.
» Trading volume continues to rise and as the action happens above $100,000, this signal works in favor of the bulls.
Short-term, Bitcoin continues green with the bulls in full control of the chart. When in doubt, zoom out; Crypto is going up.
This is obviously a consolidation pattern because we have higher lows but also lower highs. The revealing signal of course comes from the altcoins, look at Bitcoin Cash and you can get a good example.
The market will resolve bullish once the consolidation ends.
I say this based on market data and the charts.
If you agree leave a comment.
Thank you for reading.
Namaste.

Bitcoin Mid-Term, 4H Timeframe, Bullish ($119,165 Next Target)On the 4H timeframe we have a consolidation pattern with a bullish bias. Bitcoin is aiming higher after a close above EMA8 & 13 with higher lows.
The drop 13-June found support perfectly at 0.786 Fib. retracement on a wick. The session closed above 0.618. The action turned bullish immediately and we are seeing slow but steady growth.
The recent drop was a market reaction due to a geopolitical situation. As soon as the event is priced in, the market seeks balance and goes back to its previous trend.
Bitcoin's bullish bias is not only supported by strong prices, $105,600 is very strong, but also by the altcoins and the cyclical nature of the market.
While Bitcoin already produced several new all-time highs this year the altcoins are yet to do the same. A bull market happens every four years or the year after the halving. For Bitcoin this is already true but this is a marketwide event and the altcoins are yet to go there and this is a bullish factor and soon this will be obvious on the chart.
We are 5-6 days away only from very strong bullish action. Notice that this isn't a long time, it is less than a week. The altcoins will reveal this bullish bias much sooner than Bitcoin but Bitcoin will also grow and hit a new all-time high soon. This new all-time high will be the catalyst for everything to boom.
» Ignore the short-term it is all noise—crypto is going up.
The next target is $107,558, followed by $109,508 on this timeframe. The latter being a mild resistance.
The main target here is $119,165 and this is a good resistance zone. It can be rounded up to $120,000. If this level gets hit it will only confirm additional growth. The target that follows is $130,000 and the minimum for this cycle is $160,000 but we are aiming higher.
Feel free to follow for more.
I will continue to detail Bitcoin on all the timeframes as well as many of the top, mid- and small altcoins.
Thank you for your support.
It is appreciated.
Namaste.

BTCUSD: 1D MA50 and 100k form a strong support base.Bitcoin has turned neutral again on its 1D technical outlook (RSI = 45.783, MACD = 629.200, ADX = 20.857) and is about to get bearish as it hit its 1D MA50 today, erasing the gains of the last 3 days. The 1D MA50 has held two times since June 5th and another one might be what Bitcoin needs to justify the next rally. Besides this however, we got a heavier Support on the P1 trendline, which on the previous ATH (Dec 17th 2024) was a Resistance and since May 12th 2025 it turned into Support. Technically, as long as 100,000 holds, we expect a strong rebound into August that may repear the inverse of December 2024 - March 2025 (-31%) and rise by +31% (TP = 132,000).
## If you like our free content follow our profile to get more daily ideas. ##
## Comments and likes are greatly appreciated. ##

Bitcoin - Levels of the Range On the hourly time frame it is clear that BTC is within a rangebound environment. Using key levels such as the weekly highs and lows with Mondays highs and lows to to paint a picture of where support and resistance may be.
In the "weekly outlook" post for this week I suggested a retest of the $108,500 area, an orderblock that pushed prices lower and is notorious for protecting Stop losses of the shorts that pushed price lower, nearly instantly as the week starts we get that move to sweep the supply zone and stop hunt the short trades.
After a successful sweep the swing fail pattern typically follows when in a rangebound environment or absent of a trend. This structure plays out and the sell-off follows.
Price breaks through the Monday low with zero fight so momentum is with the bears in the low time frame. Should momentum continue the previous week low is @ $102,500 which is in line with HTF key level too.
RSI is also entering the oversold zone and in a rangebound environment can be when price reverses direction, as seen by the previous Monday High and Previous week low.
With FOMC just over 24 hours away volatility usually follows. No rate cut forecast however many think the interest rate should be brought down in line with inflation as the ECB has already done.
In conclusion, BTC is in a clear rangebound environment on the hourly time frame.
Stop loss hunt/supply zone sweep and then SFP, the LTF momentum is with the bears going into FOMC.
Next point of support at $102,500 (Previous week low) and could be boosted by the oversold RSI.
An FOMC rate cut should be bullish although currently thought to be unlikely.

Bitcoin Symmetrical Triangle & another pattern formingBTC is currently trading in a Symmetrical Triangle formation.
This is generally a continuation pattern.
There's also a longer term BTC pattern FORMING.
Do you see it?
Inverse Head & Shoulder.
But it is a ways off, time will tell.
Bitcoin Crypto

Ethereum Holds the Line – Is $2,300 the Key to the Next Rally?By examining the #Ethereum chart on the weekly (logarithmic) timeframe, we can see that after rising to $2,880, the price faced selling pressure and corrected down to $2,500. This upward move created a large Fair Value Gap (FVG) between $1,870 and $2,300, which is likely to be filled in the medium term if the price drops further.
However, as long as Ethereum continues trading above the $2,300 level and does not close below it, we can still expect further bullish movement.

HelenP. I Bitcoin will continue to move up inside triangleHi folks today I'm prepared for you Bitcoin analytics. After rebounding from the support level, the price initially showed strength and moved upward. However, the bullish momentum was short-lived, and the price began a downward correction, forming a well-defined descending channel. During this decline, the price dropped below the support zone, confirming short-term bearish dominance. Despite this breakdown, bulls regained control, and the price started forming a series of higher lows, resulting in the development of a symmetrical triangle. This structure signals compression and potential preparation for a breakout. The current price action confirms that BTC is now recovering within this triangle, supported by the upward trend line drawn from the recent lows. Given the strength of this recovery and the stabilization above the support zone, I expect the price to make a small correction and then continue climbing toward the resistance level at 110000. That’s why my current goal remains focused on this level, representing both a psychological and technical barrier aligned with previous local highs. If you like my analytics you may support me with your like/comment ❤️
Disclaimer: As part of ThinkMarkets’ Influencer Program, I am sponsored to share and publish their charts in my analysis.

HolderStat┆BTCUSD forming a triangleBINANCE:BTCUSDT is bouncing from the 104 k pennant foot on trend support, turning squeeze into bullish advance. Holding the rising line preserves upside bias; clearing 111 k unlocks 121 k and ATH chase 🏆

BTC Dips After ATH – $100K Support in Focus Amid TensionsBy analyzing the #Bitcoin chart on the weekly timeframe, we can see that after rallying to $111,980 and printing a new all-time high, price faced a correction down to $100,000.
Currently, Bitcoin is trading around $105,700, and with geopolitical tensions escalating, particularly the risk of war, we could see further downside — potentially taking price as low as $90,000.
However, if BTC manages to hold above the $100,000 level, there’s a strong chance we’ll see a short-term rally toward $120,000.
This analysis will be updated as the situation evolves. Stay tuned!
Please support me with your likes and comments to motivate me to share more analysis with you and share your opinion about the possible trend of this chart with me !
Best Regards , Arman Shaban

Geopolitical Tensions & Technical Pattern Point to BTC Decline!Bitcoin ( BINANCE:BTCUSDT ) fell about -5% after tensions between Israel and Iran escalated. Unfortunately , these tensions are still escalating, but Bitcoin has managed to recover about +3% so far.
Bitcoin is moving near the Resistance zone($107,120-$105,330) and Cumulative Short Liquidation Leverage .
In terms of Elliott Wave theory , it seems that Bitcoin is completing a corrective wave . The corrective wave structure could be Contracting Triangle . In case of a sharp decline in Bitcoin again, we can consider these waves as five descending waves (if Bitcoin does NOT touch $106,600 ).
I expect Bitcoin to start declining again and at least drop to the Support zone($107,120-$105,330 ). The second Target could be the Support line and Cumulative Long Liquidation Leverage .
Note: If Bitcoin can break the Resistance zone($107,120-$105,330), we can expect further increases in Bitcoin.
Please respect each other's ideas and express them politely if you agree or disagree.
Bitcoin Analyze (BTCUSDT), 1-hour time frame.
Be sure to follow the updated ideas.
Do not forget to put a Stop loss for your positions (For every position you want to open).
Please follow your strategy and updates; this is just my Idea, and I will gladly see your ideas in this post.
Please do not forget the ✅' like '✅ button 🙏😊 & Share it with your friends; thanks, and Trade safe.

BTCUSDTHi . after a crash market because of war , we can get big gain of this chance , MA 100 in 1h can hold and Reverse move to 110300$ . #BTC LONG Limit buy : 105800$ , Lev : 100x , SL : 105500$ , Target : 110300$

BITCOIN Is exactly where it should be this time on every Cycle!Bitcoin (BTCUSD) has made a new All Time High (ATH) last month, following the April 2025 rebound on the 1W MA50 (blue trend-line). No matter how odd this price action may look to some, BTC is simply replicating the pattern it has during every past Cycle around this time of its final year.
As you can see, besides April 2025, it made 1W MA50 pull-backs and rebounds on June 2021, July 2017 and July 2013. The consistency is remarkable and since we are already now half-way through June, historically Bitcoin only went upwards!
In fact, those pull-backs have been the strongest the market saw before the Cycles peaked on each and every occasion. Two Cycles peaked just above the 2.0 Fibonacci extension while in 2017 it peaked a little below the 5. Fib ext. This indicates that the minimum Cycle Top we can be expecting towards the end of the year is $160000 (marginally below the 2.0 Fib ext).
Many studies point towards the same Target. Do you think it's inevitable? Feel free to let us know in the comments section below!
-------------------------------------------------------------------------------
** Please LIKE 👍, FOLLOW ✅, SHARE 🙌 and COMMENT ✍ if you enjoy this idea! Also share your ideas and charts in the comments section below! This is best way to keep it relevant, support us, keep the content here free and allow the idea to reach as many people as possible. **
-------------------------------------------------------------------------------
💸💸💸💸💸💸
👇 👇 👇 👇 👇 👇

Bitcoin Pushed Crypto Market Into A Higher Degree CorrectionGood morning Crypto traders! Cryptos are coming lower and we can now see a five-wave drop on Bitcoin, which indicates for a deeper, higher degree correction, so Crypto TOTAL market cap chart may stay in consolidation within an ABC correction, which can retest 3.0T – 2.8T support zone before bulls return.
Bitcoin has impulsive characteristics on 4h time frame, and we can clearly see five waves up that can send the price even higher after a pullback. Now that it’s back to all-time highs, we can see it making a higher degree ABC correction, which can take some time, and it can retrace the price back to 97k-93k support zone before a bullish continuation.
However, we may now see a temporary corrective recovery in wave B, where some ALTcoins could still be doing well, if we consider that ALTcoin dominance may start kicking in. Yesterday we shared a chart of the ratio of TOTAL3(ALTcoins) market cap against Bitcoin with ticker TOTAL3ESBTC, which shows that ALTcoins may start outperforming BTC soon. It can be finishing final subwave C of (Y) of a correction in blue wave B which may cause a new strong rally into wave C that can bring the ALTseason similar as in the beginning of 2021.

BTC ANALYSIS (4H)Last week, Bitcoin made a sharp bullish move upward, aiming for retail liquidity, which made the forecast path more difficult.
The green zone is a support area where Bitcoin might react.
To collect the ATH liquidity, Bitcoin needs to break through the red zone.
Let’s see what happens | when the market direction isn’t clear, there’s no need to take unnecessary risks.
For risk management, please don't forget stop loss and capital management
Comment if you have any questions
Thank You

Bitcoin Will Continue Rising —Long-Term Chart —$200,000+ New ATHIn November 2021, the week after the all-time high was a crash. The weeks that followed were a continuation and the market went full red and didn't stop dropping until November 2022, a year later.
In May 2025, the week after the all-time high is neutral, sideways. Four weeks later and Bitcoin continues sideways consolidating near resistance, ready to break to new highs and continue rising.
Market conditions now are very, very different compared to 2021. Right now, we are only halfway through the current bull market, for Bitcoin, and we have room left available for plenty of growth.
In a matter of days, maybe 5-6 days, we get a new all-time high and this means not the end of the bull market but the start of the next and final bullish wave.
These targets on the chart are the most accurate of all numbers because they are based on almost 5 years of data.
Next target and minimum price for Bitcoin in the coming months is $155,601 but we know there is likely to be more, much more. With the institutional wave now in full force, banks opening to crypto because they have no other choice and the world evolving faster than anything we thought possible, we are aiming for $200,000 or more.
The next relevant level after $155,600 is $209,125. Which one is your target for this new 2025 all-time high?
Do you think Bitcoin will peak in late 2025 or early 2026?
Do you think you will manage to be successful in this round or are you bound to make the same mistakes? Over-trading, over-leverage, no being patient enough; not waiting for the right time to enter and not selling when the market is trading very high, greed; What will it be?
Do you think you have what it takes to succeed? You do!
Even if you made mistakes in the past or even if you are already doing good, you have what it takes.
If you are doing bad, this experience can be used to improve your game. If you are doing great, great, let's do better. There is never enough growth; we are happy, we are grateful but we accept abundance because we receive abundance thanks to hard work.
It is still very early but the market is starting to heat up. Once the bullish action starts, there is nothing that can stop us. The world will change for us. We will adapt to all market and geopolitical conditions, we will continue to improve and evolve.
The best one is not the one that makes no mistakes but the one that can extract learning from all experiences. Success is not being right all the time, success is never giving up.
Will you give up? Or, will you continue to trade long-term?
» Bitcoin is going up!
Namaste.

Bitcoin/USD 2-Hour Price ChartChart showing Bitcoin's 2-hour price movement against USD, currently at $106,647.03 (+0.96%), with a recovery trend from $105,000 and key levels at $109,000.92 and $104,544.34.

That wasn’t a breakout. That was the stop runBTC swept the high into 107,991 — precision tap of the premium fib. Now the delivery shifts. Price has already done its job: take liquidity, trigger late longs, and set up the real move.
Here’s the execution breakdown:
Price tagged the 0 level of the fib extension — 107,991 — and rejected
A clean 4H FVG sits just below around 106,195.9 (0.5), aligned with 0.382 and 0.618 fib levels (106,619.8 to 105,772.1)
This is the re-entry zone for Smart Money — not the top chasers
Expectations from here:
→ Rebalance into the 106.6–105.7k region
→ If that zone holds and price shifts structure bullish again, we retest 107.1 → 107.9 → break higher
→ If we lose 105.7 cleanly, I’m watching 104,399.9 — the deeper inefficiency magnet
This isn’t about confirmation. It’s about preparation.
More trades like this — clean, controlled, conviction-based — live in the profile description.

Bitcoin Consolidates Near Highs — Bullish Wedge Signals StrengthHolding Strong Amid Uncertainty:
Despite rising geopolitical tensions, Bitcoin remains resilient, trading near recent highs. This stability reflects strong institutional confidence and sustained accumulation by long-term holders.
Bullish Technical Setup:
The ongoing consolidation between $100,000 and $110,000 is forming a wedge pattern—a classic bullish continuation structure. This suggests the market is coiling for its next major move.
Key Levels to Watch:
Immediate Resistance: $112,500
Support Zone: Holding above $100,000 keeps the bullish case intact
Measured Move Target: $130,000–$135,000
Outlook:
This tight consolidation signals a healthy pause in a strong uptrend, positioning Bitcoin for a potential breakout and continuation higher. All signs point to the bulls remaining firmly in control.
#Bitcoin #BTC #TechnicalAnalysis #BullishWedge #CryptoMarket #InstitutionalBuying #PriceAction #Geopolitics #SupportAndResistance #BullRun

Hut 8 Corp (HUT) From Miner to Digital Infrastructure PowerhouseCompany Overview:
Hut 8 NASDAQ:HUT is transforming into a next-gen digital infrastructure leader, blending Bitcoin mining, AI compute, and cloud services for diversified, long-term growth.
Key Catalysts:
Major Operational Upgrades ⛏️
79% QoQ jump in deployed hashrate and 37% fleet efficiency gain in Q1 2025.
Positions HUT for cost-effective BTC production as crypto markets rebound.
Massive Bitcoin Reserves ₿
10,264 BTC on balance sheet (~$847M as of Mar 31, 2025).
Acts as a digital asset custodian + infrastructure operator, offering leveraged upside to BTC.
Diversification into Compute & AI Infrastructure 🧠
Q1 Digital Infrastructure + Compute revenue tops $21M.
Reduces mining dependency and captures tailwinds from AI and HPC demand.
Investment Outlook:
Bullish Case: We remain bullish on HUT above $15.00–$16.00.
Upside Target: $30.00–$32.00, driven by crypto exposure, AI-driven growth, and operational scaling.
⚙️ Hut 8 – Mining the Future of Digital Infrastructure.
#HUT #Bitcoin #CryptoMining #DigitalInfrastructure #AICompute #HPC #Web3 #BTCExposure
