Bitcoin (Cryptocurrency)

₿ Bitcoin: SlippedAfter holding steady for two days, Bitcoin broke lower yesterday, confirming a setback within green wave B. This countertrend move delays the anticipated climb, which we still expect to reach its peak in the upper blue Target Zone (coordinates: $117,553 – $130,891). From there, bearish wave C should take over. The upper blue zone remains a tactical area for partial profit-taking or hedging long positions with shorts. Wave C is expected to drive the price sharply lower into the blue Target Zone (coordinates: $62,395 – $51,323), where we anticipate the completion of orange wave a. Orange wave b may trigger a corrective bounce, but ultimately, renewed downside should wrap up the intermediate correction of blue wave (ii). Still, there’s a 30% chance that Bitcoin forms a higher high as part of blue wave alt.(i)—temporarily breaching the upper blue zone.
📈 Over 190 precise analyses, clear entry points, and defined Target Zones - that's what we do.

HelenP. I Bitcoin may continue to decline to trend lineHi folks today I'm prepared for you Bitcoin analytics. The chart began with a steady rising movement near the trend line, where the price consistently respected upward support and showed healthy momentum. After each test of the trend line, BTC managed to rebound strongly, confirming this level as dynamic support. One of the key reactions came when the price bounced from the 100300 zone, forming a solid base and continuing its bullish leg toward the resistance area. However, buyers lost momentum after breaking through intermediate support levels and reaching the resistance zone between 110700 and 111700. This resistance zone acted as a ceiling, halting further upside and triggering a local reversal. Since then, the price has been gradually retreating, printing lower highs and showing early signs of weakness. Currently, BTCUSDT is retracing, and the structure suggests that the market is leaning toward another test of the trend line. Given the previous reactions and technical setup, I expect the price to pull back toward the 102500 points, which aligns closely with the trend line. That’s why my current goal is set at this zone. If you like my analytics you may support me with your like/comment ❤️

TradeCityPro | Bitcoin Daily Analysis #116👋 Welcome to TradeCity Pro!
Let’s dive into the analysis of Bitcoin and the key crypto indices. As usual, I’m going to review the futures triggers for the New York session.
✅ Yesterday, a very important event occurred: Israel launched a military attack on Iran, targeting not only military facilities but also residential areas.
⚔️ Leaving aside the fact that war is always a global tragedy, the fact that Israel also hit civilian zones shows that the tensions between these two countries have entered a new phase.
💫 In addition to civilian casualties, key commanders of the Iranian military were assassinated in these strikes.
🏳️ Most countries such as the United States, France, and most of Europe supported Israel in this conflict, while only North Korea and Russia backed Iran.
📊 Given these rising tensions and the cancellation of Sunday’s negotiations between Iran and the U.S., the likelihood of war between Iran and Israel has greatly increased following the resolution signed yesterday.
⭐ This development has caused safe-haven assets like gold to move upward, while risk-on assets like crypto have started to decline. As you can see, Bitcoin has been falling since yesterday.
⏳ 1-Hour Timeframe
On the 1-hour chart, as mentioned, after an initial correction to the 108436 zone, Bitcoin continued its decline down to 103606, breaking through the support level we had marked due to the war-related news.
✨ Currently, the price has found support at 103606 and has started a corrective phase. RSI has also exited the Oversold area and is now heading toward the 50 zone.
📉 In my opinion, under the current market conditions, we should wait to see how Iran reacts to Israel's actions. If war breaks out, Bitcoin is likely to drop again.
⚡️ Personally, I’m holding off on opening any positions until we get more clarity on the fundamental developments between Iran and Israel. I'm also not closing any of my longer-term positions that were opened in lower zones like 88k.
🔔 However, if you are looking to open a position, you could enter on a break below 103606. I don’t currently have a trigger for a long position and would prefer to wait for a proper structure to develop.
👑 BTC.D Analysis
Bitcoin dominance moved upward along with the market decline and, after breaking through 64.18, continued its bullish leg up to 64.85.
🧩 It has since begun a corrective phase after hitting that resistance. If this correction continues, the next zone to watch is 64.49.
📅 Total2 Analysis
This index also dropped alongside Bitcoin yesterday, falling from 1.18 down to 1.12 after triggering a short.
🔍 The price has since corrected up to 1.14. If a new bearish leg begins, we can open a short position on a break below 1.12.
📅 USDT.D Analysis
Tether dominance moved upward after triggering 4.68 and reached 4.89.
💥 If 4.79 is broken, the correction could continue. If 4.89 is broken, the next bullish leg in dominance will begin.
❌ Disclaimer ❌
Trading futures is highly risky and dangerous. If you're not an expert, these triggers may not be suitable for you. You should first learn risk and capital management. You can also use the educational content from this channel.
Finally, these triggers reflect my personal opinions on price action, and the market may move completely against this analysis. So, do your own research before opening any position.

HolderStat┆BTCUSD local correctionBINANCE:BTCUSDT
→ Price coils between rising-channel mid-line & descending cap
↳ 108 k lid: clear it to unlock 112–117 k upper rail
⇢ Hold 105 k mid-rail to keep staircase intact
⤴ Drop < 104 k flips bias to 102 k base

WW3 IS COMING?! Stop kidding me. Today in X and my PM there were a lot of people who were screaming: “Oh nooo war is coming!!!!”
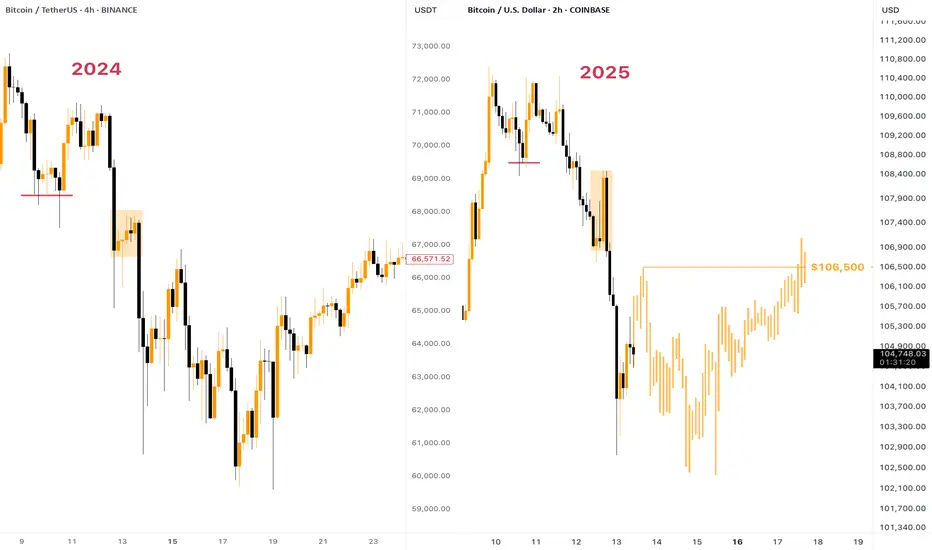
Guys, don’t freak out ahead of time. The same events happened a year ago (13-14th of April 2024) .
I don’t speak any politics here, just facts: Israel attacked Iran, then Iran attacked Israel. Finish. Everyone was afraid that the WW3 is coming, but it ended in a couple of days.
Something similar I expect to happen now too. No one need this war, what’s more - no one has spare billions&billions of dollars to fund it.
As for the chart — some fluctuations above the $101,000 support won’t do any harm to the global picture. More to say, the current chart literally copies the one from 2024: pump from the horizontal support that ended up with dump, then another fake pump and quick massive dump.
Expect to see some consolidation in the $101,000 - $105,000 range, then we can ride upwards.
Peace ✌️
BTC/USD Faces Key Support—What’s Next for Bitcoin? FenzoFx—Bitcoin dipped from its $112,000 monthly high, now trading near $104,900. Liquidity was swept, forming immediate support at $102,746.
Stochastic signals an oversold market, suggesting potential consolidation or an uptrend resumption. BTC/USD must close above $105,706 for bullish momentum, targeting $112,000.
A rejection at $102,746 may invalidate bullish outlooks, driving BTC toward $100,377.

btc weeklyCRYPTOCAP:BTC will literally unleash explosive power
pullbacks serve as a force for the next upswing

Markets Crash: Gold Soars, Crypto Dips!Israel’s strikes on Iran shook markets—Bitcoin and stocks tanked, gold soared. What’s next? Let’s unpack the best trading moves for this chaos!
Hey traders, Skeptic here!👋 Yesterday’s Israeli strikes on Iran’s military and nuclear sites, plus high-profile casualties, sent markets into a tailspin. If your positions got stopped out today, don’t sweat it—that’s normal in this mess. Today, I’m breaking down the most likely scenarios for financial markets, especially stocks and crypto, with no FOMO, no hype, just reason. Stick with me to navigate this storm!
📉Right now, markets are screaming risk-off . Stocks like the S&P 500, indices, and crypto like Bitcoin are bleeding as buyers have zero confidence. Everyone’s piling into safe-haven assets like gold, the Japanese yen, and the Swiss franc. Last night’s news triggered sharp drops in Bitcoin and SPX500, while gold’s rallying hard. This is classic flight-to-safety behavior, and it’s why your stops might’ve been hit. Let’s dive into the geopolitical scenarios driving this and then get to the charts.
📍First, the big picture.
Scenario one: Iran retaliates for Israel’s strikes, and we’re stuck in a tit-for-tat escalation for weeks. Markets stay risk-off, stocks and crypto keep sliding, and safe havens like gold thrive.
Scenario two: The US-Iran nuclear talks on Sunday, June 15th, lead to a deal, tensions cool, and markets stabilize. If those talks fail, I’m not optimistic— recent US inflation relief, might’ve pushed the Federal Reserve toward rate cuts to boost markets. Without de-escalation, rate cuts won’t save risky assets, and we’re looking at muted growth for crypto and stocks.
But if a deal happens, markets could rip—Bitcoin might hit $130K short-term and even $170K as the bull run’s ceiling. For now, uncertainty rules, so let’s see what the charts say.
👀 Let’s start with Bitcoin on the daily.
The first major support is $100K-$101K. If we lose that, we’re looking at a 3-4 month time-based correction . I know some of you see Bitcoin’s dip and think it’s a bargain, but hold up—if tensions escalate, breaking $100K-$101K is almost guaranteed. We could slide to $95K (0.382 Fibonacci retracement) or even $86K (0.618 retracement). No buying until Tuesday’s clarity—too risky. Shorting? Also a bad idea. After this sharp drop, where do you put your stop-loss? An 8% stop is the minimum, which trashes your risk-reward ratio. Best move? Sit tight, no positions, and wait for the dust to settle.
📈 Gold’s the star in this risk-off market.
On the 4-hour, as we said in last week’s watchlist, it broke the descending channel’s ceiling at 3333.86 and pulled back. Using our trick of cloning the prior channel and placing it above, it’s reacting perfectly at the new channel’s midline. A break above 3434.35 could push us to the channel ceiling at 3550.13 . Personally, I’d wait for more ranging here before going long—stops are too wide right now for a clean entry. If you caught our 3340 long trigger from the watchlist, you’re sitting pretty— just hold . Gold’s got more upside potential, but if you’re not in, don’t FOMO. Wait for a better setup.
🎯 Our EUR/USD long trigger from last week’s watchlist at 1.14555 was a winner
if you took it, you hit your risk-reward target and likely locked in profits. Nice work! The new long trigger is a break above 1.16142 resistance. No short triggers here, just like gold. With both major and secondary trends screaming uptrend, shorting against the flow is nonsense. I’d wait for key levels to break and confirm a bearish shift before even thinking about shorts. Trade with the trend, always.
📝our plan: Gold longs above 3434.35 target 3550.13; hold 3340 entries or wait for a range. EUR/USD longs above 1.16142, no shorts. Risk max 1% per trade, set alerts, and stay patient—geopolitical chaos means no FOMO moves.
I hope for a day with no wars, where we can focus on what matters—building value and humanity.🤍
That’s today’s breakdown, traders!
If this helped, smash that Boost button and Follow for more no-hype analysis. Drop a comment—what’s your next move? Want a coin or market analyzed? This is Skeptic, stay safe, protect your capital, and see you next time! <3

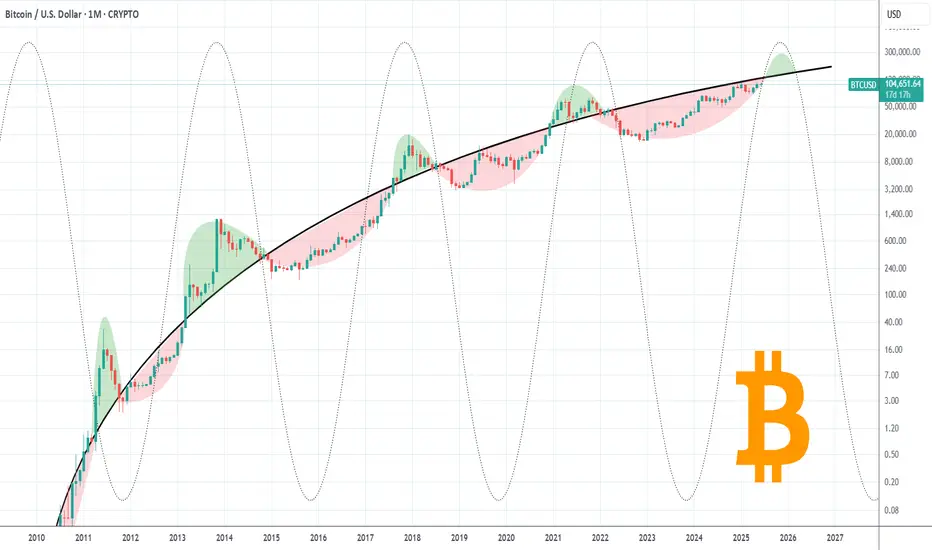
BITCOIN is only now starting the final Cycle rally!Bitcoin (BTCUSD) took a hit overnight following the Israel attack on Iran and at the moment the consequences of that action can't be quantified in great detail but on the long-term the bullish trend seems intact.
In fact it remains below the historic Pivot Growth Curve (PGC) that has separated BTC's peak pattern (green Arcs) from bottom and accumulation (red Arcs), and could be tested by next month.
Once broken, the real rally towards the Cycle's peak can start, with most previous studies we conducted showing that $150000 is a fair (if not modest) estimate.
Are you worried about the latest geopolitical conflict or this chart is enough to give you long-term assurances? Feel free to let us know in the comments section below!
-------------------------------------------------------------------------------
** Please LIKE 👍, FOLLOW ✅, SHARE 🙌 and COMMENT ✍ if you enjoy this idea! Also share your ideas and charts in the comments section below! This is best way to keep it relevant, support us, keep the content here free and allow the idea to reach as many people as possible. **
-------------------------------------------------------------------------------
💸💸💸💸💸💸
👇 👇 👇 👇 👇 👇
Stay liquid my friend $HYPEI am going to enjoy GETTEX:HYPE , it is very liquid, a great mover. Price discovery will be amazing when it comes. But right now we are in the accumulation phase
With a nice WXY #elliotwavepattern

BTC Reacts to Iran–Israel Escalation: Risk-Off Sentiment GrowsBitcoin (BTC/USDT) — Caught Between Fear & Fundamentals
Technical Outlook — 13 June, 2025
Current Market Condition:
Bitcoin has dropped to $103,818 after facing rejection from the $106.8K–$108K resistance zone, coinciding with heightened geopolitical stress following renewed military escalation between Iran and Israel. Traditional markets are showing signs of risk aversion, and while Bitcoin is often seen as a hedge, the current flight to USD liquidity and defensive assets is putting pressure on high-beta instruments like crypto.
The psychological $100K support zone, which aligns with the EMA 50 and a key Fib level, is the immediate area to watch. A failure here could expose Bitcoin to deeper retracement toward $96,800 and potentially $92K, especially if global tensions worsen or investors rotate further into cash and gold.
Key Technical Highlights:
Rejection at supply zone near $106,888–$108,000.
Support at $100K holds structural and psychological importance.
Stochastic shows bearish momentum crossover, increasing downside probability.
EMA 200 at $92K could act as ultimate cushion in a full-blown correction.
Volatility likely to remain elevated amid Middle East conflict and global uncertainty.
Trade Plan:
🔼 Bullish Relief Bounce (Long Bias):
Trigger: Reclaim and hold above $106,888 with rising volume
Target: $108K → $112K → $116K
Stop Loss: Below $103,500
🔻 Geopolitical Risk Sell-Off (Short Bias):
Trigger: Break and close below $100,000
Target: $96,816 → $92,000 → $88,000
Stop Loss: Above $102,500
📉 Dip Buy Strategy:
Trigger: Price stabilizes at $96.8K with divergence and calming geopolitical headlines
Target: $103K → $106K
Stop Loss: Below $95K
🛡️ Risk Management Note:
With geopolitical risk driving short-term sentiment, expect volatility spikes, whipsaws, and fake breakouts. Remain nimble and manage exposure carefully — especially during weekend sessions when crypto trades unhedged and news developments can occur without warning.
📢 If you found this analysis valuable, kindly consider boosting and following for more updates.
⚠️ Disclaimer: This content is intended for educational purposes only and does not constitute financial advice.
BTC - No champange toast Well, that was unfortunate. BTC too the very beating that was forecasted. Demonstrating the power of the combined methods that I use. Murrey Math, Elliot Wave, and K wave ( Kumar Wave ) We have a small chance, in the low single digits to recover from this. But the Lions share of probability remains with the Re test down toward $84k. I will update more later. That chart is in my profile. Good luck.

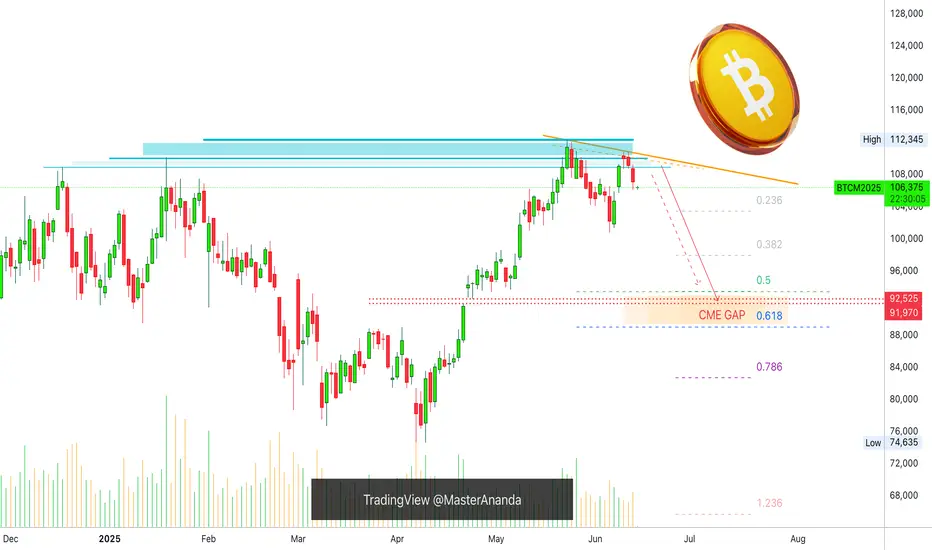
5 Bearish Signals —Bitcoin CME Gap (91,970 - 92,525)Bitcoin's bearish bias is confirmed clearly. Bearish signals are starting to pile up one on top of the other, let's recap those real quick:
1) Bitcoin is trading below its December 2024 high, it's January 2025 peak price and the recent 22-May all-time high. Trading below these levels open the doors for a move downward.
2) Recent lower high. 10-June closed lower compared to 22-May. This is a local lower high.
3) Overall low volume. Total volume decreasing since January 2025. No strong buying activity.
4) Sustained growth. Bitcoin grew straight up for 45 days. It is normal to see a retrace after sustained growth.
5) CME Gap. This is the latest signal that came to my attention and this gives further strength to the bearish case. The GAP sits between $91,970 and $92,525.
It is likely that Bitcoin will move lower before producing a new all-time high. Bitcoin is not likely to move below 80K. This is very unlikely.
Most likely Bitcoin will find support above 90K and if it moves below 90K this might be a brief occurrence lasting only a few hours or a few days at max. When all is set and done, we will continue to see long-term growth based on a bullish structure of higher highs and higher lows. The 7-April bottom will remain untouched.
Namaste.
Bitcoin's Price Action Reveals A Bearish Ethereum—Back To BasicsBitcoin is bearish, top confirmed; we know Ethereum and Bitcoin move together in the exact same way. This means that Ethereum will also move lower.
Here we have a higher high but lacking strength, volume is dropping. There will be a continuation of the retrace.
Consider waiting (SHORT) until after the FED decision result. The market can remain slightly bearish until after the event. The drop will open the doors for new entry prices. Market conditions can always change.
We are live with a 20X SHORT on Bitcoin, Ethereum will do the same. Just a small drop (can be a strong drop) ending in a higher low followed by a new wave of growth. Not all charts/pairs/projects are the same. Some will move down while others move up. Sell at resistance, buy at support.
Namaste.

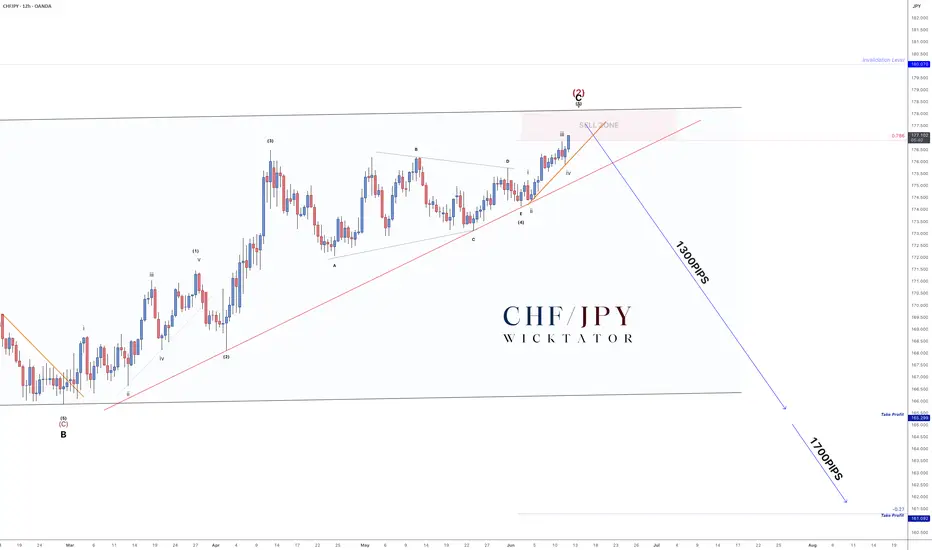
CHFJPY - How To Enter This MASSIVE 1700pip Swing Trade!As promised - here’s the lower timeframe breakdown after hitting 100+ likes.
We’re in wave 5, currently moving cleanly into the swing zone. Since wave 5 typically forms 5 subwaves, all we needed was to connect points 2 and 4 to draw our entry trendline.
Trade Idea:
- Entry on break of the orange trendline
- Stops above recent highs after entry
- Aggressive option: Enter inside the sell zone with stops above invalidation
Targets:
- TP1: 165.00 (≈1300 pips)
- TP2: 161.50 (≈1700 pips)
- Optional: Leave a runner for the longer swing move
Scroll down for the full 4H breakdown.
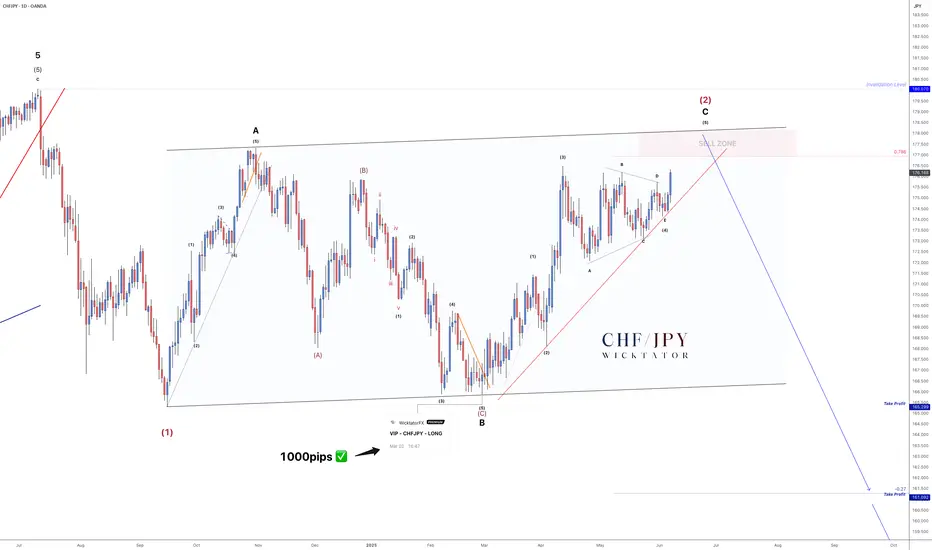
CHFJPY - 1700 Pip Reversal Incoming!The last time we looked at CHFJPY was back in October 2024, where we forecasted a large ABC correction. Fast forward to now - that correction is nearly complete!
We're currently in the 5th subwave of wave C, and everything points toward a massive drop setting up. We expect a move of at least 1500 pips.
On the Daily timeframe, structure is clear:
- Clean 5-3-5 ABC correction
- Price is approaching a key sell zone
- A clear entry trendline is in place — couldn’t ask for a cleaner setup
Trade Idea:
- Watch for rejection within the sell zone
- Aggressive entry: Inside sell zone with stops above invalidation
- Conservative entry: On break of trendline, stops above the break candle
Targets:
TP1: 165.00 (≈1300 pips)
TP2: 161.50 (≈1700 pips)
Optional: Leave a runner for a long-term swing
Let me know what you think in the comments.
See below for our last VIP setup for CHFJPY which played out perfectly. 1000pips secured!
Good luck and as always, trade safe!
Bitcoin's Correction Confirmed, 93-97K Next TargetBitcoin's bearish continuation is now confirmed with three consecutive days of bearish action, today being a full red candle.
Good afternoon my fellow trader, how are you feeling today?
Opportunities are endless in this market, and if you trade, you can profit from the bullish as well as the bearish waves. Good entry timing is all that is needed for a successful trade, the right map and mindset.
So the lower high is confirmed and today's action confirms an incoming lower low. The 100K support is very likely to break but this is not written in stone. This is a high probability scenario. We are aiming for a price range of $97,000 - $93,000. But this isn't necessarily the end. Depending on how this level is handled, we will be able to know if prices will go lower or what.
$88,000 is a good level in the case there is strong bearish volume when the above price range is challenged as support. Now it is all a wait and see. Patience is key.
Once the a new support zone settles, we adapt to the market and focus on green. The next step is red. Down we go.
Thank you for reading.
Namaste.

BTCUSD: Can it repeat the U.S. elections rally?Bitcoin is on a slight pullback, being only marginally bullish on its 1D technical outlook (RSI = 56.024, MACD = 1611.500, ADX = 23.439). Based on the 1W RSI we may be on the October 30th - November 4th 2024 pullback that preceded the U.S. elections. The decisive test will be on the 1D MA50 again, but as long as the S1 level holds, chances are we will see a similar +106.40% rally. We remain bullish on BTC, TP = 150,000.
## If you like our free content follow our profile to get more daily ideas. ##
## Comments and likes are greatly appreciated. ##

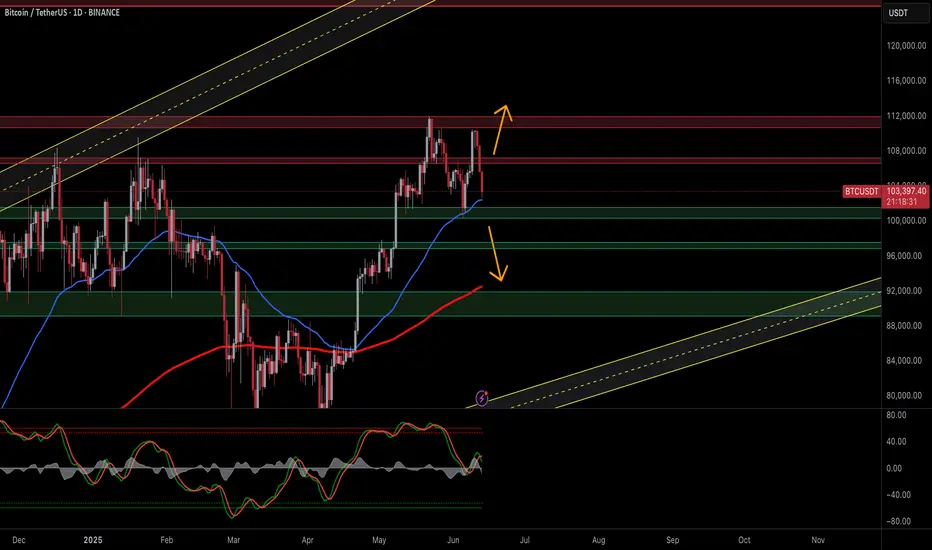
BTC losing momentum but support needs to holdBTC is showing some bearish signs. However, as long as the price can stay above $101k, the bias is still up.
Full TA: Link in the BIO

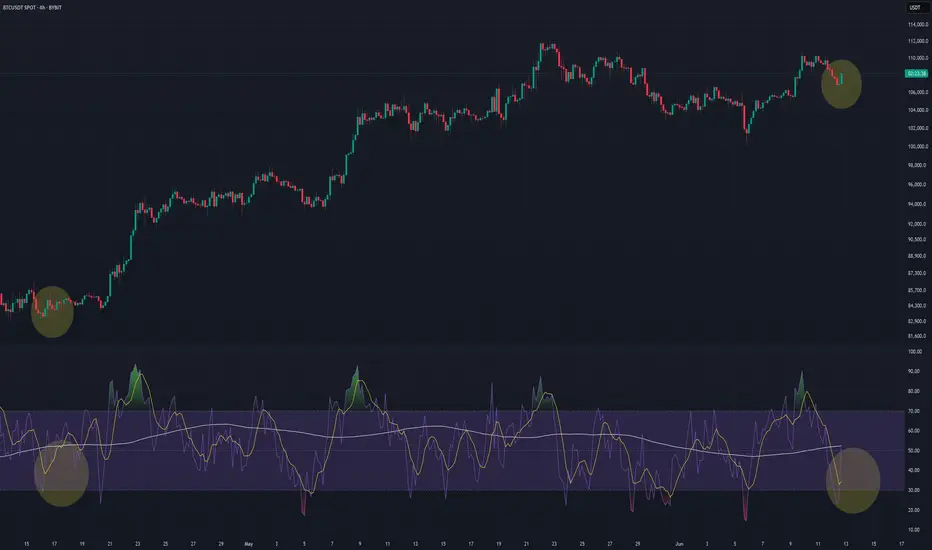
BTC Triple JumpRSI Fired ✔ Breakout Above $110,200 Next ➜ Targeting 140K
BTC is entering a critical phase on the 4H chart, and this setup looks remarkably similar to previous moments that led to sharp bullish continuation. Price is steadily forming higher lows and now pressing right up against the key resistance at $110,200 — the last confirmed swing high. 🧱
What makes this moment particularly interesting is what’s happening beneath the price: momentum is quietly shifting. Using a custom triple RSI setup — with short, medium, and long lengths — I’m seeing a familiar pattern unfold. The white line (longer-term RSI) has already crossed above the 50 level ✅, a strong signal of building trend strength. Meanwhile, both the short and medium RSIs are deep in the oversold zone 🔻 — a dynamic that, in the past, has front-run explosive rallies.
This exact structure has preceded multiple breakout moves over the past months. The RSI alignment acts as an initiative confirmation, and now price is approaching the final confirmation level: a break and 4H close above $110,200. If that happens, I expect a swift push toward $112,500–$114,000, with potential for much more.
🔥 This aligns perfectly with my previous idea, where I laid out a case for a major breakout in June that could drive BTC toward $140K. That outlook was based on higher-timeframe expansion patterns and macro structure — and what we’re seeing now could be the moment where it all starts.
As of now, it’s too early to talk about invalidation. The structure remains intact. Momentum is shifting. All that’s left is the breakout.
If you haven’t seen my 140K projection yet, check it out — this could be the first real ignition point. 🚀
BITCOIN (BTCUSD): Pullback From Support
Bitcoin nicely respected a key horizontal support.
A breakout of a resistance line of a falling wedge pattern
provides a strong bullish confirmation.
I think that the price will go up and reach at least 108.320 level.
❤️Please, support my work with like, thank you!❤️

TradeCityPro | Bitcoin Daily Analysis #115👋 Welcome to TradeCity Pro!
Let’s dive into the analysis of Bitcoin and the key crypto indices. As usual, I’ll be reviewing the futures triggers for the New York session.
⏳ 1-Hour Timeframe
On the 1-hour chart, as you can see, yesterday the price was rejected from the 110256 level I previously mentioned. Following that, with the activation of the 108617 trigger, Bitcoin experienced a downward leg.
📊 Personally, I didn’t open a short position after the break of that level, but if you did, I suggest taking profits now as the price has reached the marked support zone.
🔍 As for me, I’ll wait to see how the price reacts to this support. If it breaks down, we can open a short position.
📈 However, if the price finds support here, we can once again look for a long position. The trigger for this will be found in the lower timeframes.
👑 BTC.D Analysis
Let’s move to Bitcoin dominance. Yesterday, BTC.D made a pullback to the 64.18 zone and now seems ready for another drop.
✔️ If 63.96 breaks, BTC.D could enter another bearish leg. If instead, the 64.18 ceiling breaks, it could push up toward 64.49 or even 64.67.
📅 Total2 Analysis
Looking at the Total2 index, after reaching 1.24 yesterday, it started to correct and dropped down to 1.18, touching the support with a shadow.
✨ If the 1.2 level breaks to the upside, the price could move back toward 1.24. If 1.18 breaks down, the correction may continue further.
📅 USDT.D Analysis
Now onto USDT.D. After a brief correction up to the 4.68 level, it has resumed its downward movement. If 4.64 breaks, the decline could extend toward 4.56.
💥 If instead, the 4.68 top breaks, it might bounce back up toward 4.72.
❌ Disclaimer ❌
Trading futures is highly risky and dangerous. If you're not an expert, these triggers may not be suitable for you. You should first learn risk and capital management. You can also use the educational content from this channel.
Finally, these triggers reflect my personal opinions on price action, and the market may move completely against this analysis. So, do your own research before opening any position.
