BITCOIN BULLS ARE GAINING STRENGTH|LONG
BITCOIN SIGNAL
Trade Direction: long
Entry Level: 103,835.09
Target Level: 109,309.96
Stop Loss: 100,185.18
RISK PROFILE
Risk level: medium
Suggested risk: 1%
Timeframe: 9h
Disclosure: I am part of Trade Nation's Influencer program and receive a monthly fee for using their TradingView charts in my analysis.
✅LIKE AND COMMENT MY IDEAS✅
Bitcoin (Cryptocurrency)

BTC Dominance looking real heavy up hereWouldn't be surprised in the least if we see a freefall on BTC Dominance over the next few months.
Of course there is no guarantee, and things may look different in a month, however as it stands, I think there is a potential ALT cycle on the cards for 2025.
RSI needs a reset, amongst other things.

Bitcoin Rally Overextended: Patience is Key for the Next Move💹 BTC/USDC – Bullish Outlook, heres my Trade Plan.
Bitcoin (BTC/USDC) is currently maintaining a strong bullish trajectory 🚀, showing impressive momentum after breaking through recent resistance levels 🔓.
However, price is now overextended from the last swing low, and I’m anticipating a pullback into value 🔄 — specifically targeting the 50%–61.8% Fibonacci retracement zone drawn from the latest swing low to swing high 📐. This zone often acts as a rebalancing point for institutional traders and provides confluence for smart entries 🎯.
I’ll be closely watching this retracement area for signs of support forming, and more importantly, a bullish break in market structure 🧠📊. Only after that confirmation, would I consider executing a long position — no structure break, no trade ✅.
This isn’t about predicting — it’s about reacting with discipline.

Bitcoin Approaches Resistance as Momentum Cools: What’s Next?Bitcoin has been on a strong upward trend 🚀, but recent moves show signs of exhaustion as it approaches major resistance zones 🛑. The appearance of a three-drive pattern on the 4-hour chart, suggests the market could be due for a healthy correction 🔄. While the broader trend remains bullish, I'm watching for a potential pullback and then looking for renewed strength (bullish BoS) before considering new long positions. Patience and confirmation are key in these conditions! 👀✨

BITCOIN The beauty of structured patterns. $150k is next.Bitcoin (BTCUSD) has invalidated all bias calling for a deeper pull-back after May's new All Time High (ATH), as yesterday it broke above the previous ATH Resistance, invalidating the short-term Head and Shoulders pattern, while rebounding last week exactly on the dashed Lower Highs trend-line, confirming it as a Support level.
Within BTC's 3 year Channel Up pattern, we have seen this price action structure another 3 times. The minimum rise on such pattern has been +101% and that wasn't even a Lower Highs rebound. The other two that were exactly like the current formation, increased by a lot more.
As a result, we expect Bitcoin to complete a minimum +101% rise from the April 07 bottom, which translates to a clean $150000 Target.
Do you think the structure ill continue to hold up to $150k and possibly beyond? Feel free to let us know in the comments section below!
-------------------------------------------------------------------------------
** Please LIKE 👍, FOLLOW ✅, SHARE 🙌 and COMMENT ✍ if you enjoy this idea! Also share your ideas and charts in the comments section below! This is best way to keep it relevant, support us, keep the content here free and allow the idea to reach as many people as possible. **
-------------------------------------------------------------------------------
💸💸💸💸💸💸
👇 👇 👇 👇 👇 👇

MASSIVE NEW BREAKOUT - LiveMassive New Breakout in Bitcoin at Dual Resistance
Post with emojis:
🚨💥 Massive New Breakout in Bitcoin at Dual Resistance 📈🔥
Okay, time to revisit the BTC chart because we’ve just arrived at a crucial intersection that could define the next major move!
In our previous update, we anticipated a dip — and it played out perfectly. Using Fibonacci support, we entered long right at the sweet spot, just before a strong upward move that tested resistance levels.
And now... it’s official — BTC has just broken through that massive dual resistance! 🚀
This breakout pushes us back into the ascending channel, which had previously flipped to resistance. Two major technical levels — white and yellow zones — just got cleared in one explosive move.
What's next?
🔹 Monitor for a possible retest of the breakout zone
🔹 Eyes on the 113 key resistance — that’s the next likely magnet for price
🔹 For those already in longs (like me), it’s smart to take partial profits and trail stops 🧠💼
This is a textbook breakout structure, and we’ll need to watch volume and structure confirmation closely.
One Love,
The FXPROFESSOR 💙
Disclosure: I am happy to be part of the Trade Nation's Influencer program and receive a monthly fee for using their TradingView charts in my analysis. Awesome broker, where the trader really comes first! 🌟🤝📈

Massive New Breakout in Bitcoin at Dual Resistance- LiveMassive New Breakout in Bitcoin at Dual Resistance
Post with emojis:
🚨💥 Massive New Breakout in Bitcoin at Dual Resistance 📈🔥
Okay, time to revisit the BTC chart because we’ve just arrived at a crucial intersection that could define the next major move!
In our previous update, we anticipated a dip — and it played out perfectly. Using Fibonacci support, we entered long right at the sweet spot, just before a strong upward move that tested resistance levels.
And now... it’s official — BTC has just broken through that massive dual resistance! 🚀
This breakout pushes us back into the ascending channel, which had previously flipped to resistance. Two major technical levels — white and yellow zones — just got cleared in one explosive move.
What's next?
🔹 Monitor for a possible retest of the breakout zone
🔹 Eyes on the 113 key resistance — that’s the next likely magnet for price
🔹 For those already in longs (like me), it’s smart to take partial profits and trail stops 🧠💼
This is a textbook breakout structure, and we’ll need to watch volume and structure confirmation closely.
One Love,
The FXPROFESSOR 💙
Disclosure: I am happy to be part of the Trade Nation's Influencer program and receive a monthly fee for using their TradingView charts in my analysis. Awesome broker, where the trader really comes first! 🌟🤝📈

BTCUSD – continuing to buy as breakout confirms bullish setupBTCUSD is forming a classic “cup and handle” pattern, now breaking above key resistance. Price is holding within an upward channel, and if momentum stays strong, the next target could reach 160,000 and beyond.
It might seem hard to believe, but the structure points to continued bullish momentum. I’m not missing this opportunity and continue to build long positions as this breakout develops.

Bitcoin Breaks Out: Bullish Momentum Builds Above Key LevelsHello guys!
The chart of Bitcoin reveals a significant bullish breakout, characterized by two key technical developments:
Broken Ascending Channel:
Bitcoin was trading within an ascending parallel channel, gradually making higher highs and higher lows. This channel was recently breached to the downside, suggesting a temporary weakening in momentum.
False Breakdown and Strong Reversal:
Despite the initial breakdown from the channel, Bitcoin swiftly reversed and surged upwards, reclaiming previous support levels with strong bullish candles. This “fake-out” move often traps bears and reinforces bullish sentiment.
Trendline Breakout:
More notably, BTC has broken above a descending trendline, which had acted as a resistance zone. This breakout, backed by strong volume and momentum, indicates a shift in market structure from consolidation to potential expansion.
Projected Upside Target:
Based on the breakout projection drawn on the chart, the next major resistance appears near the $109,600 level. This aligns with the upper purple dashed line, which may represent a historical resistance zone or a Fibonacci extension.

$BTC Extremely Bullish Daily Close - Parabola Underway?Hawt diggity dayumm 🥵
CRYPTOCAP:BTC really going for it following my original idea behind the parabola formation 🤯
Reclaiming ATH high at $112k will confirm the move 🤞

Correction? Show Me the Correction —Bitcoin Is Going Up!There is no correction and this "double-top" is nothing similar to 2021.
First, the wave that led to the April 2021 ath was a major hyper bullish wave starting March 2020. A total of 392 days of bullish action non-stop with 1,615% total growth. From a low of $3,782 to a high of $64,854, Boom!
The wave that led to the January 2025 all-time high was not a mega hyper, hyper-bullish bullish wave, instead it came after a long period of consolidation and a flash crash, which means the establishment of a long-term support. It started August 2024 and lasted 168 days total growth 124%. Completely different, so don't tell me that market conditions are the same because they aren't, we are not stupid, actually, we are very smart, right my friends? Long-term followers, readers and supporters!
The first high in 2021 happened in April the second in November, 210 days apart.
In 2025, we have a top in January and another one in May, 119 days. Very, very different.
In 2021 the altcoins rallied, everything rallied and everything was trading at new all-time highs before the bear market.
In 2025, nothing has rallied and most of the market was trading at the bottom. So we had an early peak in 2021, we get a late peak in 2025.
Since we had a long-term double top in 2021, we get a blow-off top in 2025, late 2025. Do you understand?
I am the Master of the charts!
Bitcoin is not done; it isn't over. We have an entire bullish wave before the bull market is over. This bullish wave is the fifth wave which is the speculative wave, in this wave anything goes. The market will go crazy. There will be euphoria, passion, craziness, money, growth!
The altcoins will be hitting new all-time highs and everybody will go crazy. NFTs, DeFi, DePin, RWA, Memes, POW, Gaming, AI, new, big, small and old, all welcomed, everything will grow. When the pixelated rocks start selling for millions of dollars, that's when the bull market ends.
When people start saying "Bitcoin will go to $1,000,000 in this cycle." That's when the top is in.
When Bitcoin starts trading at $219,999 and starts to slow down and Ark Invest comes up and says, "Bitcoin is going to $5,000,000 next"; when Michael Saylor starts saying, "I will be buying the top forever..." Get ready because that's the end. It isn't happening, now people are still talking about corrections and doubt, that's not the end of a bull market, that's the transition period between an advance a correction and the next leg up.
Just wait and watch. Just watch my friend... Just watch!
I assure you, Bitcoin is going up!
Namaste.

Support and resistance zone: 104463.74-106133.74
Hello traders.
If you "Follow", you can always get new information quickly.
Have a nice day today.
-------------------------------------
(BTCUSDT 1W chart)
When a new candle is created, you should check if the HA-High indicator is created at the 99705.62 point.
The reason is that the HA-High indicator was created, which means that it has fallen from the high point range.
In other words, it also means that it can fall to around or below the 97705.62 point.
Since the current candle fell to around 99705.62 and then rose, it can rise like this when a new candle is created.
We have several indicators that can determine the high point.
Representative indicators include DOM (60), StochRSI 80, and HA-High.
Therefore, the high point range is 104463.99-104984.57 and 97705.62.
Therefore, in order to turn downward, it is likely to start when it falls below 104463.99-104984.57 and shows resistance, and it can be interpreted that the downtrend is confirmed when it falls below 97705.62.
If we think about it the other way around, if the price stays above 104463.99-104984.57, it will eventually create a new high.
-
When we first study charts, we start to become curious about charts as we learn about price moving averages.
As such, when we look at charts, our understanding of charts changes depending on how well we understand the average value.
However, when we first learn about price moving averages in chart analysis, we start to study all sorts of different analysis techniques as we realize that there are ambiguous parts in conducting transactions.
As a result, chart analysis becomes more and more difficult, and we end up giving up on chart analysis.
If you have studied chart analysis in your own way without giving up on it, you will realize that it will eventually converge to the average.
No matter what indicator or analysis technique you use, you will eventually converge to the average and then diverge.
Therefore, we should try to analyze the chart using the easiest and most convenient method.
The reason is that chart analysis is ultimately just a means to create a trading strategy and has no other meaning.
-
The basic trading strategy on my chart is to buy near the HA-Low indicator and sell near the HA-High indicator.
The HA-Low and HA-High indicators are indicators created for trading on the Heikin-Ashi chart and ultimately represent the average.
The HA-High indicator is the average value that represents the high point range, and the HA-Low indicator is the average value that represents the low point range.
Therefore, if it is supported and rises near the HA-Low indicator, it is a buying period, and if it is resisted and falls near the HA-High indicator, it is a selling period.
However, since it is an average, if it is supported and rises near the HA-High indicator, it is likely to show a stepwise upward trend, and if it is resisted and falls near the HA-Low indicator, it is likely to show a stepwise downward trend.
Because of this, we need to adopt a split trading method.
-
The auxiliary indicator, StochRSI, is an indicator that moves based on the 50 point.
Therefore, when the StochRSI indicator value is below 50, we need to focus on finding a buying point, and when it is above 50, we need to focus on finding a selling point.
A decisive hint for this is when it enters the overbought or oversold zone.
The auxiliary indicator, OBV, is an indicator that adds up the difference in trading volume according to price.
If you divide the OBV indicator into High Line and Low Line and understand the movement of OBV, you can understand the movement of the price to some extent.
However, since not all indicators follow the price trend exactly, you should not try to judge everything with just one indicator.
If you express the OBV indicator in the form of an oscillator, it will look similar to the MACD oscillator.
As I mentioned earlier, this is because the chart eventually converges to the average value.
Using this characteristic, we combined the OBV indicator with a MACD-type oscillator.
If it is located below 0 based on the 0 point, it means that the selling pressure is high, and if it is located above 0, it means that the buying pressure is high.
No matter what indicator or analysis technique you study, you must have a solid basic understanding of the average value.
If not, no matter how good the indicator or analysis technique you learn, you will not be able to analyze it as you studied and create a trading strategy when you actually trade.
-
(1D chart)
It is highly likely that the uptrend will resume if it rises above the HA-High indicator point of 108316.90.
To do so, it is important to see if it can receive support and rise around 104463.99-106133.74.
If it fails to rise, it will eventually show a downward trend again.
If it meets the HA-High indicator and falls, it is likely to fall until it meets the HA-Low indicator.
Currently, the HA-Low indicator is formed at the 89294.25 point, but as the price falls, the HA-Low indicator is likely to be newly created.
Therefore, we need to check if the HA-Low indicator is newly created when the price falls.
Since the OBV of the auxiliary indicator is located near the Low Line and the OBV oscillator is also located below the 0 point, we can see that the selling pressure is strong.
Therefore, we need to check whether the OBV rises above the High Line when it is supported near 104463.99-106133.74 or whether the OBV oscillator rises above the 0 point.
-
I think that all indicators or analysis techniques are ultimately tools that confirm whether there is support at the support and resistance points or sections drawn on the 1M, 1W, and 1D charts.
Therefore, in order to use indicators or analysis techniques, it depends on how well you understand and draw the support and resistance points or sections according to the arrangement of the candles.
Therefore, you need to first check how reliable the support and resistance points you drew are and practice creating a trading strategy accordingly.
Ultimately, it can be seen that how well the support and resistance points are drawn depends on how well the chart analysis or trading strategy is made.
-
If you look at the 1W chart and the 1D chart, you can see that the important volatility period is around June 22.
The volatility period of the 1W chart is from June 16 to 29.
The volatility period of the 1D chart is from June 10 to 14 and from June 21 to 23.
Therefore, when the HA-High indicator of the 1W chart is generated at the 99705.62 point, it is important to maintain the price above 99705.62 after passing the volatility period of the 1W chart.
Since the HA-High indicator on the 1D chart is formed at 108316.90, we need to see if it can be supported and rise near 108316.90.
In summary, we can see that the important support and resistance range in the volatility period is 99705.62-108316.90.
Among these ranges, it is expected that the wave will start depending on whether the current price is supported in the 104463.99-106133.74 range.
In other words, the 104463.99-106133.74 range corresponds to the middle range of the 99705.62-108316.90 range, the average value.
-
Thank you for reading to the end.
I hope you have a successful transaction.
--------------------------------------------------
- This is an explanation of the big picture.
(3-year bull market, 1-year bear market pattern)
I will explain more details when the bear market starts.
------------------------------------------------------

BITCOIN LOCALLY OVERBOUGHT|SHORT|
✅BITCOIN will soon retest a
Key resistance level of 112,000$
Which is an all-time-high
And the coin is locally overbought
So I think that the price will make a pullback
And go down to retest the demand level below at 109,000$
SHORT🔥
✅Like and subscribe to never miss a new idea!✅
Disclosure: I am part of Trade Nation's Influencer program and receive a monthly fee for using their TradingView charts in my analysis.

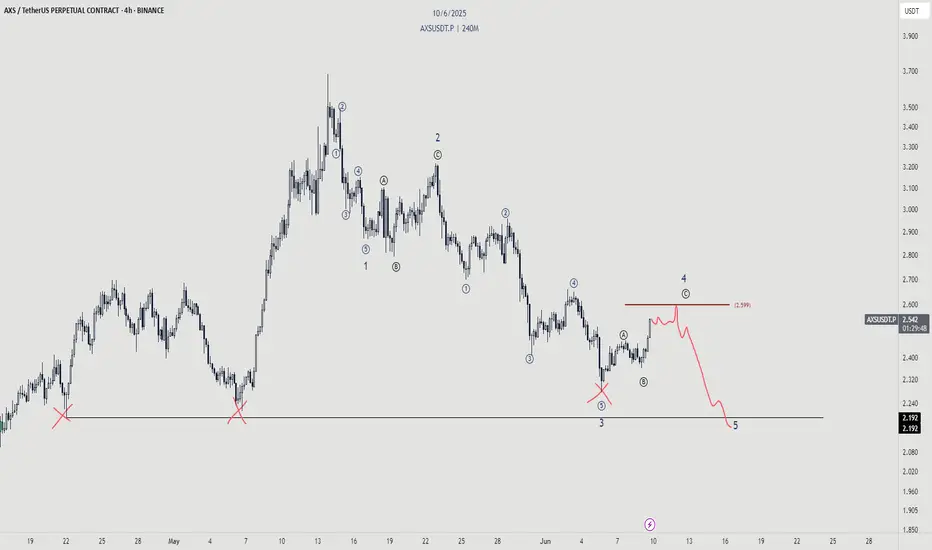
AXS - Dont be faked outWhile the bounce is nice, we should not forget about the real trend here.
We're still bearish overall and there is a shit ton of liquidity to be taken out. Don't be blinded
Bitcoin - Showing strength as it breaks key resistance levels!Bitcoin (BTC) recently demonstrated impressive strength by bouncing off a well-known confluence zone consisting of the golden pocket and a 4-hour fair value gap (FVG) around the $100,000 level. This technical area has historically acted as a reliable support and once again proved its significance, offering a solid foundation for the current rally.
Following this bounce, BTC surged to $108,000, decisively breaking above the 4-hour FVG near $107,000. With this breakout, the previously resistant zone is now expected to flip into support, adding further confidence to the bullish outlook. This type of price action is often seen in strong uptrends, where key resistance levels are reclaimed and converted into support, providing a base for further upside.
Importantly, BTC has also managed to push through the golden pocket resistance, a critical Fibonacci retracement area closely watched by traders. This breakout, in conjunction with the 4H FVG clearance, clears the path for a potential continuation toward Bitcoin’s all-time high.
Momentum is clearly building. Buying pressure is strong, and retracements have been shallow, indicating a market dominated by demand. While this is a bullish sign, a brief pullback or bounce off the newly formed support (the 4H FVG zone) would be healthy. Such a move would allow BTC to consolidate and build strength before potentially pushing toward new highs.
Overall, the technical landscape looks increasingly favorable for BTC. As long as it holds above the reclaimed support zones, the path to retesting, and possibly surpassing, the all-time high appears wide open.
Thanks for your support.
- Make sure to follow me so you don't miss out on the next analysis!
- Drop a like and leave a comment!

bitcoin road map (4h)As I mentioned, the wedge has been broken, and this could push the price above $110,000.
previous analysis
