BITCOIN 40K NEXT TARGET ?as i predicted last time bitcoin reached 30k if you listened to me and brought it congratulations on the sweet profits.
it seems like bitcoin started a bullish trend
i believe if we break the resistance we might see the price to 40k or more.
Bitcoinanalysis

₿itcoin will go ✈️UP✈️ by Falling Wedge Pattern⏰(15_Min)⚠️Yesterday, after the news of the approval of the Bitcoin ETF was confirmed to be Fake , Bitcoin fell again after breaking the🔴 Resistance zone($28,450-$28,000 )🔴.
🔄Currently, the 🔴Resistance zone($28,450-$28,000)🔴 has become a 🟢Support zone($28,450-$28,000)🟢 in my analysis.
🏁In terms of classic technical analysis , it seems that Bitcoin has succeeded in forming a Falling Wedge Pattern .
🔔I expect Bitcoin to rally to at least the ⬆️ Upper ⬆️🟡Price Reversal Zones(PRZ)🟡 after entering the ⬇️ Lower ⬇️ 🟡Price Reversal Zones(PRZ)🟡 and reacting to the Pitchfork and Fib channel lines .
--------------------------------------------------------------------------------
🌐➕ Positive News ➕🌐:
FTX customers could get $9 B shortfall claim payout by mid-2024.
The number of wallets holding between 100 and 1,000 Bitcoins has reached an all-time high this year.
Cathie Wood Says 'Hopes Are Rising' For Bitcoin ETF Approval By SEC
🌐➖ Negative News ➖🌐:
US Government Holds $5 B in Bitcoin: WSJ.
Bitcoin (BTC) Collapses 8% as BlackRock Denies ETF Approval Rumor.
Binance Will Stop Accepting New User Registrations in the UK Starting Today.
--------------------------------------------------------------------------------
Bitcoin Analyze ( BTCUSDT ), 15-minute time frame ⏰.
Do not forget to put Stop loss for your positions (For every position you want to open).
Please follow your strategy; this is just my Idea, and I will be glad to see your ideas in this post.
Please do not forget the ✅' like '✅ button 🙏😊 & Share it with your friends; thanks, and Trade safe.

BTC Might Go To 28.2 If Loses 29KBitcoin yesterday performed a nice liquidity grab to the upside.if it holds 29K we could see higher prices if not 282 or even 27.9 could be next
Thanks for watching

Bitcoin Analysis and Possible MovesBitcoin showing more sign of weakness everytime it tried to go higher. Will we see a decent drop today ? or it wants to go and make a new high ?
Thanks for watching

Bitcoin Chances of Sell-Off is Increasing!Bitcoin tried a pump to 29K (golden pocket) and slowly retracing it.failing to hold 28.2 could result in a drop.
Thanks for all your support

✈️Bitcoin Will Go Up again✈️🔨Bitcoin seems to be breaking the Ascending Channel and 🟢 Support zone($27,580-$27,300) 🟢.
🌊According to Elliott's wave theory , Bitcoin has completed a Zigzag correction(ABC/5-3-5) in the ascending channel, but we have to wait for the next moves to confirm the end of the main wave B .
💡Also, the RSI indicator managed to break the Uptrend line and is currently moving near the 50% line ; I expect the RSI indicator to pull back to the Uptrend line .👇
🔔I expect Bitcoin to at least decline to the next 🟢 Support zone($26,880-$26,500) 🟢 and then rise again and touch the minimum Resistance line again.
Bitcoin Analyze ( BTCUSDT ), Daily time frame ⏰.
Do not forget to put Stop loss for your positions (For every position you want to open).
Please follow your strategy; this is my Idea, and I will gladly see your ideas in this post.
Please do not forget the ✅' like '✅ button 🙏😊 & Share it with your friends; thanks, and Trade safe.

📊Bitcoin Mid-Term Analysis📊👋Hi everyone.
📈Today, I decided to analyze Bitcoin almost completely on a weekly time frame with the help of technical analysis tools to give you a good view for the mid-term .
✅After rising almost ➕15% for the past four weeks , Bitcoin has started to decline again (as I expected in previous posts ✅).
☠️One of the reasons for Bitcoin's fall again in terms of technical analysis was the Death Cross Signal .
📚☠️ Death Cross Signal ☠️: The death cross appears on a chart when an asset's short-term Moving Average(MA), usually the 50-day , crosses below its long-term moving average, usually the 200-day .
🌊According to Elliott's wave theory , Bitcoin completed its 5-impulse wave at $31,800 and is currently completing corrective waves. It is better to know that because the main wave A has 5 microwaves, the structure of the corrective pattern should be in the form of a Zigzag correction(ABC/5-3-5) .
🌊It seems that the main wave B has also ended, but to confirm this, we have to wait for the break of the Support line and the 🟢Support zone($26,880-$26,500)🟢 .
🌊After confirmation of the end of the main wave B , I expect the main wave C to finish in the 🟢Heavy Support zone($25,280-$23,900)🟢 or one of the 🟡Price Reversal Zones(PRZs)🟡 , in terms of timing, the end of the main wave C could be in one of the ⚫️ Time Reversal Zones(TRZs) ⚫️.
❗️ Note ❗️: The price and time of the end of the main wave C depends on the fundamental conditions of the cryptocurrency market and other parameters ( 💲Interest rate💲_⚔️War⚔️_🐳Behavior of whales🐳_🔄On-chain Data🔄_etc. )
🔔I expect Bitcoin to rise to at least the previous high($31,800) after the correction waves are completed.
🙏In the end, I have to apologize for the fact that the chart is busy, but in my opinion, all the lines and indicators were needed for your better understanding of the analysis, and I also hope that this analysis has an 📚educational📚 aspect for you.
------------------------------------------------------------
I would be happy to share your opinion about Bitcoin for the mid and even long-term below this post.
------------------------------------------------------------
Bitcoin Analyze ( BTCUSDT ), Weekly time frame ⏰.
Do not forget to put Stop loss for your positions (For every position you want to open).
Please follow your strategy; this is just my Idea, and I will gladly see your ideas in this post.
Please do not forget the ✅' like '✅ button 🙏😊 & Share it with your friends; thanks, and Trade safe.

Bitcoin is not in a downtrend yetRead the description carefully:
Before you read the description we must say that we have no bias towards any symbol and we only publish what the chart shows us.
If the green range is maintained, it is possible to make a new high, but it is really difficult, but not impossible! For this, the green range should be maintained.
If the green area is maintained, a new Bitcoin rally will begin in September or October.
In the upper regions, there are liquidity pools that, if collected, will provide the necessary fuel to move towards the lower regions.
An important support that can stop the correction that is going to happen is the $11,000-$12,000 area.
Bitcoin is bullish until the $24,749 area has not been broken with a candle body on the daily time frame.
This is a long-term analysis, you should not fomo.
What will be the violation of this analysis? A heavy fall in the coming days and the loss of the green area!

₿itcoin will go UP by Bullish 🏁Flag🏁 Pattern⏰(15_Min)👋Hi guys, I hope that you had a great weekend.🥳
✅Bitcoin seems to have managed to break the 🔴 Resistance zone($27,600-$27,300)🔴 by Breakout Candle and is currently completing a pullback to this line.
🏁In terms of classic technical analysis , it seems that Bitcoin has succeeded in forming a Bullish Flag Pattern.
🔔I expect Bitcoin to rise toward the 🔴 Resistance zone($28,450-$28,060) 🔴 after breaking the upper line of the descending channel .
Bitcoin Analyze ( BTCUSDT ), 15-minute time frame ⏰.
Do not forget to put Stop loss for your positions (For every position you want to open).
Please follow your strategy; this is just my Idea, and I will be glad to see your ideas in this post.
Please do not forget the ✅' like '✅ button 🙏😊 & Share it with your friends; thanks, and Trade safe.

BTC Fake Pump Into Complete CollapseBitcoin Pumped to 30K yesterday.we expected it but not like this.it grabbed all the liquidity to the topside and could collapse from here.Targets and S/R explained.Lower Time Frame shows weakness
If you find this video informative please share it with others.
Thanks for all your support

Bitcoin Weekly Overview And New TargetsBitcoin Last week only dumped to 26.5K forming a possible bottom for this week.if the bottom does not hold we go a lot lower. new targets and previous week overview included
Thanks for watching

₿itcoin is Ready to Fall again⏰(1-Hour)⏰✅₿itcoin started to grow as I expected in the previous post on the 1-hour time frame.
🏃♂️Bitcoin is currently moving near the 🔴 Resistance zone($27,600-$27,300) 🔴, Resistance lines , 🟡 Price Reversal Zones(PRZ) 🟡,🔵 100_EMA(Daily) 🔵 and Downtrend line .
🌊In terms of Elliott wave theory , Bitcoin seems to be completing the last wave of the Double Three Correction(WXY) .
🔔I expect Bitcoin to start going down again after hitting the Resistance lines and the 🟡 Price Reversal Zones(PRZ) 🟡.
🔔The first 🎯Target🎯 of Bitcoin can be a Support line .
--------------------------------------------------------------------------------
🌐➕ Positive News ➕🌐:
Ferrari to accept crypto for luxury car purchases: Reuters.
California Signs Crypto Bill Into Law.
Bloomberg Analyst Predicts Likelihood Of A Spot Bitcoin ETF By January 2024.
Legendary Investor Jim Rogers Warns Era of US Dollar Dominance Is Coming to an End.
US Government Has No Option Except Currency Debasement, and Bitcoin (BTC) Stands To Benefit: Bloomberg Analyst.
First Stage of Bitcoin Bull Market ‘Well and Truly Underway,’ Says Analyst Jason Pizzino – But There’s a Catch.
California Sets 2025 Start for Digital Asset Regulatory Framework.
🌐➖ Negative News ➖🌐:
Cryptocurrency Exchange Volume Report Released: Here’s How Binance, Coinbase, Bybit and 10 Other Exchanges Performed
--------------------------------------------------------------------------------
Bitcoin Analyze ( BTCUSDT ), 1-hour time frame ⏰.
Do not forget to put Stop loss for your positions (For every position you want to open).
Please follow your strategy; this is just my Idea, and I will gladly see your ideas in this post.
Please do not forget the ✅' like '✅ button 🙏😊 & Share it with your friends; thanks, and Trade safe.

Bitcoin Analyze(Road map)🗺️⏰(1-Hour)⏰👋 Hi everyone.
🙏 First, I have to apologize for the busy chart, but I will try to draw all the important zones and lines for you so that the posts have an 📚 Educational aspect 📚.
🏃♂️Bitcoin is moving in the 🟢Support zone($26,880-$26,500)🟢 near the 🟣 Yearly Pivot Point($26,737) 🟣, Support lines and 🔵 50_SMA(Daily) 🔵.
🌊According to the theory of Elliott waves , Bitcoin seems to be completing its 5th wave with the help of the Expanding Ending Diagonal .
💡Also, we can see Regular Divergence(RD+) between two Consecutive valleys .
🔔I expect Bitcoin to move towards the Resistance line and 🔴 Resistance zone($27,600-$27,300) 🔴 after breaking the upper line of the Expanding Ending Diagonal .
❗️ Note ❗️: Below the 🟢Support zone($26,880-$26,500)🟢 , Bitcoin has a 🔵 CME Gap($26,400-$26,290) 🔵, which I don't think Bitcoin will fill this gap in this attack, but if this zone is filled, the scenario will change .
--------------------------------------------------------------------------------
🌐➕ Positive News ➕🌐:
First Abu Dhabi Bank completes cross-border payments testing on JPMorgan Onyx.
Telegram And TON Foundation Collaborate With Alibaba Cloud In Quest For Fastest Blockchain.
Bitcoin Lightning Network growth jumps 1,200% in 2 years.
Billionaire Paul Tudor Jones Still Likes Bitcoin Despite Price Drop.
Tether Continues To Flow Into Exchanges.
JPMorgan debuts tokenization platform, BlackRock among key clients: Report.
Crypto HODLers Stash Bitcoin Worth $1.35B Each Month, Onchain Data Show.
ARK Invest updates spot Bitcoin ETF proposal in response to SEC criticisms.
🌐➖ Negative News ➖🌐:
Crypto exchange Bitstamp to end Canadian services in January
Jim Cramer thinks 'Mr. Bitcoin is about to go down big'
--------------------------------------------------------------------------------
Bitcoin Analyze ( BTCUSDT ), 1-hour time frame ⏰.
Do not forget to put Stop loss for your positions (For every position you want to open).
Please follow your strategy; this is just my Idea, and I will gladly see your ideas in this post.
Please do not forget the ✅' like '✅ button 🙏😊 & Share it with your friends; thanks, and Trade safe.

Bitcoin - Short; For now... Then, dependent on what happens around the $20,000 level, up, then down, ... etc., etc.
This is all speculation, of course, then again, that is the name of the game. - Right?!
Trade it as it unfolds.

BITCOIN: Bearishness Before UpsideHowdy risks-taker!
I've had time to take a probing look at bitcoin this weekend and see what I think I found.
I do expect some large-scale bearish activity on bitcoin in the coming weeks. The pair looks anytime ready to plummet in any case. We've been struggling to keep any bullish steam and sellers are pretty much in control.
But make no mistake about it, the pair is inherently bullish in my view and the question is how long to keep going down before we see definite rallies?
For now, this is the idea I am interested to engage with until proven otherwise as we often are.

Bitcoin's Technical Landscape: On a CrossroadAs we transition from late 2022 to early 2023, Bitcoin's resounding bullish trajectory appears to be facing headwinds. A detailed technical analysis reveals subtle signs of waning momentum. Specifically, the last two peaks were marked with an RSI just marginally surpassing 70, indicating potential overbought conditions. Concurrently, the asset's price struggles to stay affixed above its 50-day moving average, a critical threshold for many traders.
A pivotal juncture lies at the $28,500 mark. Should Bitcoin descend below this level, it would act as a bearish cue. Subsequent potential support zones to monitor include $27,220, aligning with the 200-day moving average, followed by $25,000, resonating with the previous low and the March high. Notably, the $23,350 level stands out as it represents a significant volume node based on volume profile data.
However, should Bitcoin demonstrate resilience by upholding its medium-term upward trendline and reclaiming ground above the 50-day average, we could witness a consolidation phase, paving the path for a potential bullish resurgence.

Will The Dump Stops Today Or 25.5 Today ?Bitcoin been dumping and the liquidity to the upside decreased too.Will it stop the dump and perform a pull back or it continues the dump towards 25.5K or lower
Thanks for watching

Bitcoin Cleared Lower Liquidity For A Higher PriceBitcoin yesterday performed a Long squeez building more liquidity to the upside.Still hope for a short squeez but if we go lower to 25K.full scenario explained
Thanks for watching

BTC mini dump comingBtc forming ascending broadening wedge pattern. Soon it will breakdown and price will go down.

⚠️Bitcoin will Go Down Again⏰(1-Hour)⏰⚠️👋Hi everyone, I hope that you have a great weekend.🥳
🌊It seems that the corrective structure of Bitcoin continues so that the Wave A had an Expanding Leading Diagonal structure, and in general, it seems that the corrective structure will be a Zigzag type(ABC/5-3-5) .
📚It is better to know that generally, on Saturdays and Sundays , Volume Trading is low , so there is a high probability that Bitcoin will move in the form of Range in the next two days and will make its main move at the beginning of next week.
💡Also, we can see Regular Divergence(RD-) between two consecutive peaks.
🔔I expect Bitcoin to eventually break back below the 🟢 Support zone($27,920-$27,800) 🟢 and once again attack the 🟢 Heavy Support zone($27,600-$27,300) 🟢 and the lower line of the Ascending Channel .
❗️ Note ❗️: If BTC can break the 🔴 Heavy Resistance zone($28,440-$28,060) 🔴, the scenario will change.
--------------------------------------------------------------------------------
🌐➕ Positive News ➕🌐:
Spot Bitcoin ETFs Could Send BTC Skyrocketing by Over 3,200%, Says InvestAnswers Host.
Bitcoin miners Marathon, Riot, CleanSpark increase BTC output in September.
Hong Kong crypto VC opens $100M fund for Asian blockchain startups.
Robert F. Kennedy Jr. Pledges to Protect Bitcoin When President.
🌐➖ Negative News ➖🌐:
JPEX converts user stablecoins to native token without notice: Report.
Ledger lays off 12% of staff, citing ‘macroeconomic headwinds’.
Binance Losing Market Dominance at Rapid Pace.
Dark Side Of Crypto: $7 Billion Laundered Across Chains, According To Elliptic.
--------------------------------------------------------------------------------
Bitcoin Analyze ( BTCUSDT ), 1-hour time frame ⏰.
Do not forget to put Stop loss for your positions (For every position you want to open).
Please follow your strategy; this is just my Idea, and I will gladly see your ideas in this post.
Please do not forget the ✅' like '✅ button 🙏😊 & Share it with your friends; thanks, and Trade safe.

Bitcoin will ⚔️Attack⚔️ to Downtrend line⏰(15_min)⏰👋Hi, everyone.
🏃Bitcoin is running on 🟢 Heavy Support zone($27,600-$27,300) 🟢 and 🟡 Price Reversal Zone(PRZ) 🟡.
🌊In terms of Elliott wave theory , Bitcoin seems to be completing a Zigzag Correction(ABC/5-3-5) so that wave B could end at 🟡 Price Reversal Zone(PRZ) 🟡.
🔔I expect Bitcoin to Attack the Downtrend line in the coming hours to complete Wave C .
--------------------------------------------------------------------------------
🌐➕ Positive News ➕🌐:
The user account "Satoshi" says that he/she will publish documents to prove her identity in 2024 (On Twitter).
Bitcoiner drops BitVM paper — Bringing Ethereum-like contracts to Bitcoin.
Weekly Crypto Inflows Surge by 370%, According to CoinShares.
Bitcoin’s exchange balance plummets to five-year low.
Arthur Hayes Says AI and Historic Money Printing Will Create ‘Most Epic’ Bull Market for Crypto.
Former BlackRock Manager Says Prepare For $17.7 Trillion Inflow Into Bitcoin If This Happens.
Bitcoin is a ‘super logical’ step on the tech tree — OpenAI CEO.
Bitcoin Is Better Than Digital Gold: Matrixport.
South Korea’s Crypto Market Cap Leaps to $21.1 Billion in H1
🌐➖ Negative News ➖🌐:
Binance users in Hong Kong lose $450K in wave of fraud texts: HK police.
Huobi & KuCoin Added to UK Warning List for Operating Without Registration.
Binance Losing Market Dominance at Rapid Pace.
Instagram’s Stance on Bitcoin: Why Accounts Get Suspended.
Bitcoin Could Plunge by Nearly 50%, According to Crypto Analyst Nicholas Merten – Here’s Why.
Stablecoin Market Hits 2-Year Lows In Terms Of Market Cap – What’s Going On?
Bitcoin Mining Giant Bitmain Halted Employee Salaries.
--------------------------------------------------------------------------------
Bitcoin Analyze ( BTCUSDT ), 15-minute time frame ⏰.
Do not forget to put Stop loss for your positions (For every position you want to open).
Please follow your strategy; this is just my Idea, and I will be glad to see your ideas in this post.
Please do not forget the ✅' like '✅ button 🙏😊 & Share it with your friends; thanks, and Trade safe.

Bitcoin Possible Short Squeez IncomingBitcoin grabbed a big liquidity to the downside and now the liquidity at 28K is more than 1 Billion. will btc comes back to retake 28K ? Watch this to find out
Thanks for your support

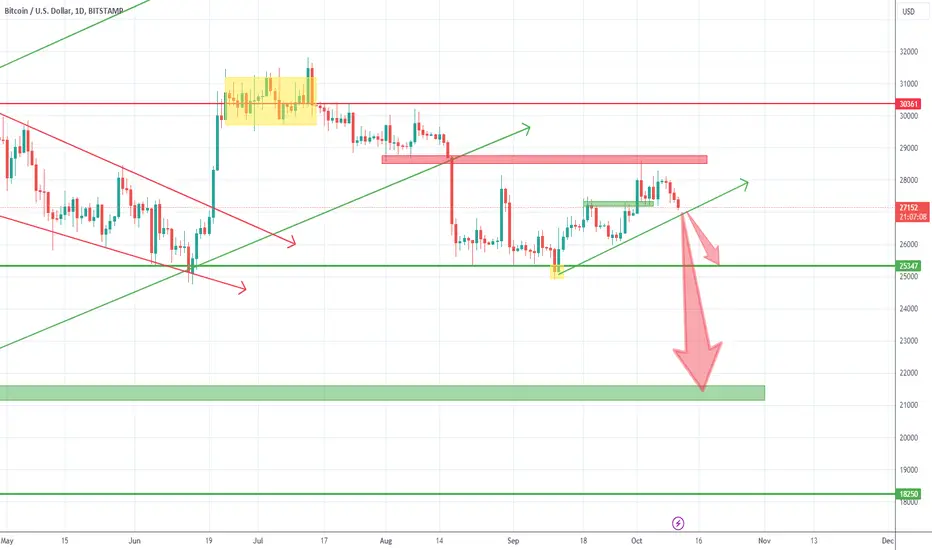
Bitcoin could dive soonAfter the reversal from 25k and the reach of my target at 28.500, Bitcoin started to consolidate.
Friday we had a new attempt to reconquer resistance and bulls failed again and BtcUsd started to fall again.
At the time of writing the price sits on confluence support, but the structure is not bullish at all and we could witness a break down
In such an instance, the first target for bears is 25k horizontal support, but, in the longer-term 21k is not out of the question.
I'm bearish on BTC as long as the price is under 28.500