#Bitcoin Sideways Movement, BTC Is Bearish Below $22.5kPast Performance of Bitcoin
Bitcoin is down from recent highs and steady when writing. From the daily chart, prices remain in a tight consolidation, marking the general state of affairs over the weekend. As it is, the failure of buyers to reverse losses and push higher indicates that bears are still in control. Most importantly for traders, the February 9 bear breakout bar validates the short-term trend.
#Bitcoin Technical Analysis
BTC is within a bear breakout formation following last week's slip below the bull flag and support line, now resistance, at $22.5k. Though there are higher highs relative to the lower BB, the February 9 bearish engulfing bar sets the pace. From an effort versus result perspective, traders can still find shorting opportunities below the resistance line at $22.5k. However, losses below last week's lows at around $21.5k may see BTC drop toward $20k in a bear-trend continuation formation.
What to Expect from #BTC?
Traders remain confident from a top-down preview. In the near term, how prices react at $22.5k on the upper end and $21.5k would shape BTC going forward. Technically, Bitcoin sellers are in a commanding position, and prices may drop to new February lows in sessions ahead.
Resistance level to watch out for: $22.5k
Support level to watch out for: $21.5k
Disclaimer: Opinions expressed are not investment advice. Do your research.
Bitcoinanalysis

#Bitcoin Breaks Out Below the Bull Flag, Back to $21.5k?Past Performance of Bitcoin
Bitcoin prices fell on February 9, candlestick arrangement reveals. The coin is down three percent in the last trading day and eight percent in the previous week. The trend is shifting, favoring sellers after a strong performance from mid-December 2022.
#Bitcoin Technical Analysis
Bitcoin prices fell yesterday, dropping below the middle BB and the support line of the bull flag. Since the breakout is with rising trading volumes, traders might find entries to short the emerging trend. Every high towards the former support line at $22.5k presents trading opportunities for traders to short. The first bear target, emerging from this formation, will be previous resistance, now support at $21.5k. Further losses may see BTC slip to the 50 percent Fibonacci retracement level of the December to February peaks trade range at $20k.
What to Expect from #BTC?
The cool-off was expected after the past few weeks' surge. The path of least resistance, following the breakout, is southwards. Unless otherwise there is a strong surge, reversing yesterday's losses, traders can set their targets at $1.5k in the near term.
Resistance level to watch out for: $22.5k
Support level to watch out for: $21.5k
Disclaimer: Opinions expressed are not investment advice. Do your research.

Bitcoin analysis per week ( Divergence ) 📉📈Divergence is one of the well-known and widely used methods for determining price reversal areas, whether positive or negative, and thus helps to determine entry or exit areas 📉📈
Divergence can be used with momentum indicators in general like: '' MACD ''-'' RSI ''-'' Stochastic oscillator ''.
We notice in the picture a difference between the price on the chart and the '' RSI '' indicator,
So now the price is in a downward trend opposite the indicator that is in an upward direction, and this indicates an upcoming positivity.📉
Divergence is one of the many trading methods that we use to build an integrated strategy, and of course, we can use it in any time frame we want ✍️
⚠ You must wait for a signal or entry sign in order to buy bitcoins.

BTCUSD💥1H-TIMEFRAME ANALYSISBTCUSD💥1H-TIMEFRAME ANALYSIS
💗Hello ladies and gentlemen
This is my new idea for 💥BITCOIN
I hope my idea is clear
Support me by like and share thank you
Stay Safe💯💲💲💲
Good luck💰😍
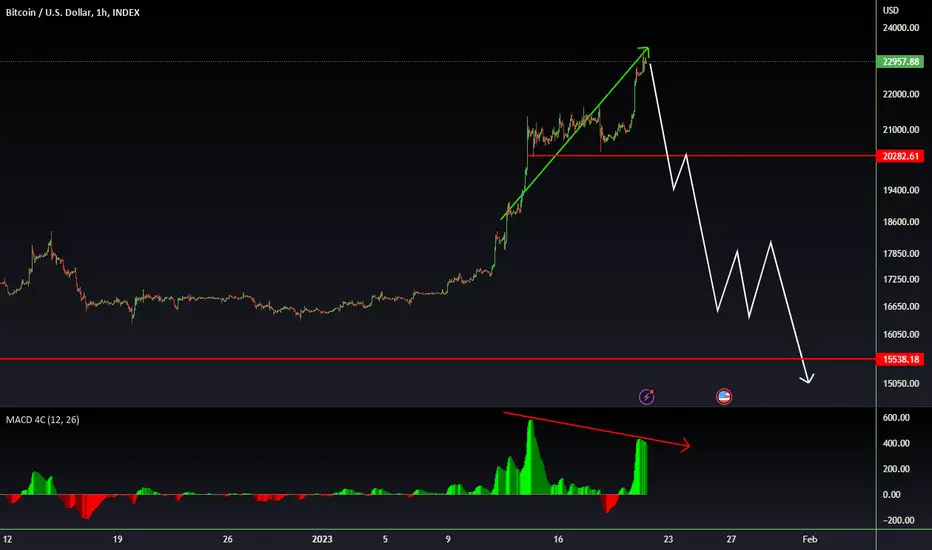
Bitcoin will fall to a historic price!Bitcoin | BTCUSD | Bitcoin vs US Dollar | Bitcoin vs Tether | BTCUSDT
This idea for Feb 8, isn't right and cannot happen

Btc Moving In RangeCurrently Ranging Incase of bounce from lower support Expecting 1 More Test Towards Resistance 24k
Incase Of Downside Breakout Expecting Test Of Support As A First Stop 21.2k & 2nd 20.6k
Incase Of Upside Breakout Expecting Massive Bounce In Coming Days

BTC major move to the downside imminent In this video I've analysed BTC and its price action then I analysed liquidation cluster of bitocin and where the liquidity is after that I analysed SPX since its connedted to btc and at the end short DXY review
IMO btc will go up around 23600 or 23200 before going downwards and a slow bleed has been started , there is a head and shoulder play that Ive discussed in the video
Please Boost and comment as it motivates me for more videos
Also is video better or picture ?
Thanks for watching

#Bitcoin Consolidates inside a $1.5k Range, Bulls Retain ControlPast Performance of Bitcoin
Bitcoin prices are volatile at spot rates, reading from the performance in the daily chart. Prices edged lower yesterday, only for bullish pressure to develop during the New York session. Overall, buyers stand a chance, provided prices are inside the bull flag. In the days ahead, traders can watch how prices react either above$24k or below $22.5k support.
#Bitcoin Technical Analysis
As mentioned earlier, BTC prices have support at around $22.5k. This is a critical level, also flashing with the base of the flag. As prices consolidate between $24k and the support, swing traders might take their profits on every attempt higher. Meanwhile, conservative traders might wait for entries on breakout in either direction. Any surge above $24k may trigger demand, lifting the coin towards $25k or better. Conversely, losses may see BTC slip to $21.5k in a retest. Ideally, any breakout must be with rising trading volumes above the recent averages.
What to Expect from #BTC?
Bulls are in control despite the recent lower lows from the upper BB. This indicates that upside momentum is waning. Nonetheless, buyers remain in control unless there is a definitive close in either direction.
Resistance level to watch out for: $24k
Support level to watch out for: $22.5k
Disclaimer: Opinions expressed are not investment advice. Do your research.

#Bitcoin - thoughts out loud #2 Good afternoon, dear colleagues!
Dear colleagues, I sincerely thank you all for your attention and wish success to everyone!
And remember one thing:
"sometimes you win/sometimes you learn"

#Bitcoin Prices Inside A Bull Flag, Will Buyers Succeed?Past Performance of Bitcoin
Bitcoin prices are stable at spot rates, steady inside a bull flag as demand for the coin during the New York session supported prices. With the dynamic support line by the middle BB still vital in shaping BTC's short to medium-term formation, traders may look for entries on break out. Any surge above the bull flag may see the coin rallying above $25k.
#Bitcoin Technical Analysis
BTC remains in a tight range, fluctuating inside a bull flag as traders search for entries. As it is, buyers are in control, a net positive for optimistic traders. There will be clarity once BTC breaks out, either above $24k or $22.5k. Ideally, this liquidation should be with rising trading volumes, indicating participation. For buyers, any surge above $24k may lift BTC towards $25k or better. Conversely, losses below the base of the flag might see BTC slide to $21k and January 20 lows of $21k.
What to Expect from #BTC?
The primary trend remains northwards. Nonetheless, there are attempts to slow down the upside. This is expected considering the welcomed expansion from mid-January. Conservative traders can still wait for a clear trend definition before committing, targeting $25k, or $21k, depending on the eventual breakout direction.
Resistance level to watch out for: $24k
Support level to watch out for: $21.5k
Disclaimer: Opinions expressed are not investment advice. Do your research.

Bitcoin, The Fast and Furious!Bitcoin Idea and Analysis | BTCUSDT Analysis | BTCUSD
Bitcoin will rise rapidly in the next 24 hour!!
✅ ✅ Risk warning, disclaimer: the above is a personal market judgment and analysis based on published information and historical chart data on The trading view,
And only some of these analyzes are my actual real trades.
I hope Traders consider I am Not responsible for your trades and investment decision.

#Bitcoin in Range above $22.5k in a Bull FlagPast Performance of Bitcoin
Bitcoin is firm, and buyers appear to be soaking in selling pressure, reading from the BTC price action in the daily chart. BTC is trading above the middle BB and $22.5k, the immediate support level. As it is, aggressive traders can load on dips. However, conservative traders can wait for prices to tear above the bull flag and $24k before doubling down, targeting immediate resistance lines.
#Bitcoin Technical Analysis
The path of least resistance is overly northwards. There were attempts at lower lows earlier, but buyers have yet to confidently confirm the strong uptrend of mid-January. Technically, once prices break above $24k with expanding participation levels, forcing the coin above the bull flag is when traders can buy the dips, targeting $25k or better. For now, there is a risk of BTC slipping below the middle BB, and $22.5k is a cool-off that may provide sellers an opportunity to ride the emerging trend. Considering the current consolidation, the best course of action is to wait for a clear trend definition above or below immediate reaction levels.
What to Expect from #BTC?
Bitcoin is boxed in a tight trade range with caps at $22.5k and $24k. Inside a bull flag, a breakout with expanding volumes in either direction may determine the short-term BTC trend.
Resistance level to watch out for: $24k
Support level to watch out for: $22.5k
Disclaimer: Opinions expressed are not investment advice. Do your research.

#Bitcoin Slips 6% from $24k, Bears Retest Key Support LinePast Performance of Bitcoin
Bitcoin is relatively low, dropping on the last trading day as the upside momentum fades. The coin is down six percent from last week's highs. At yesterday's pace, BTC may post more losses in the days ahead. However, the drawdown could be accelerated should there be losses below $22.5k as BTC melts below January 30 lows.
#Bitcoin Technical Analysis
Overall, BTC is bullish. The current formation boxes prices inside a bull flag. Still, buyers have a chance, but that could be amplified if BTC breaks above last week's highs, closing above $24. What's required for buyers to take charge is a surge past immediate resistance levels with rising volumes. Should bears take over, BTC could drop below $22.5k and the middle BB by today's close. In that likelihood, the coin may slip to retest $21.5k in a breakout formation. This could allow traders to double down, riding the emerging trend.
What to Expect from #BTC?
Traders are confident of the coin's uptrend in the medium term. However, for now, buyers must defend critical support. Any confirmation of yesterday's losses may compound the liquidation, forcing BTC to immediate support lines at $21.5k and round number at $20k.
Resistance level to watch out for: $24k
Support level to watch out for: $21.5k
Disclaimer: Opinions expressed are not investment advice. Do your research.

Bitcoin Looks Pretty Solid For Recovery Descending Broadening Wedge Breakout has already confirmed
Moving Averge golden crossover Is Happening While Btc Testing Crucial Resistance
If Golden Cross Happen And btc Breaks Crucial Resistance Got cleared In Between 24 To 25k Area
Then Btc Can Recover Sharply
Out Midterm Target Will Be 45k Area

#Bitcoin Slowing Down, Will BTC Drop below $22.5k?Past Performance of Bitcoin
Bitcoin prices might be consolidating in the first few days of February. However, the coin is up roughly 50% from January lows. The token remains in a bullish formation, and there could be more upsides, despite the current rejection. As it is, the immediate resistance is at $24k, while buyers must keep prices above $22.5k for the uptrend to hold.
#Bitcoin Technical Analysis
Overall, there are hints of weakness after the surge of last month. Buyers still need to conclusively break out, and there are lower lows relative to the upper BB. This suggests waning upside momentum. Notably, resistance remains at $24k while support is around $22.5k. With yesterday's bar closing as bearish with a long upper wick pointing to selling pressure, BTC traders should closely monitor price action. Until there is a breakout in either direction, conservative traders can stay out. Losses below $22.5k will confirm losses of January 30, triggering a sell-off back to $20k.
What to Expect from #BTC?
The uptrend is defined. However, price retracements are inevitable. After last month's climbs, traders must watch how prices fair in the next few days. A close above this week's highs may see BTC rally, even soaring above $25k. If not, a dump toward $20k could be in the cards.
Resistance level to watch out for: $24k
Support level to watch out for: $22.5k
Disclaimer: Opinions expressed are not investment advice. Do your research.

Bitcoin BTC analysisUpdate from my last bitcoin analysis. Short term bullish (net 3-6 months), long term, we'll see once we retest the red lines indicating resistance & then
fall back & hold the white diagonal line, signaling a trend continuation to the upside. If this happens, that's when I'll look to add to my crypto positions.
News does't matter to me. I'm a trader. All trades show up in the chart. Talk with no trades taking place = distraction.
Only cryptos I'm taking seriously:
Bitcoin - just to trade & make money
Ripple/xrp - if governments/businesses allow it as payment or the ledger gets used by large investors
Solana - only because its used heavily in gaming
XTZ - I was in it for the rate of return but they've dropped that from 6 to 3%, so I'm not adding as much
Cardona/AAVE - small positions just to see if the tech gets taken seriously (not betting big on these)
