Bitcoin - " Even if ...... "Even if Bitcoin did nothing more than slink along its multi-year trend-line it would be well over $25K by this time next year. Forget BAKKT, forget the halving, forget everything. If Bitcoin just follows its long-term trend that is what you would get. From $10.5K right now to $25.5K in about a year. That's not bad for one year. And that is just if it continues to do what it has done for years. But..... what do you think might happen when it hits the top of those intersecting yellow lines? Hmmmmmm
I've said it many times and I'll say it again. Those still calling for sub-6K and sub-3K prices are just fooling themselves. If they really want to ever own any Bitcoin they would be better off dollar cost averaging into a long term hodl position by buying the dips rather than holding out for a fantasy. Time is working against them. Time is working against everybody.
Even the 30 Week Simple Moving Average is over $7,200 right now (purple line) and the current Bitcoin price is sitting right on top of the 20 Week SMA. (orange line) Anybody that thinks we are going to bust the multi-year trend line AND bust through these two long term averages are just kidding themselves. You will NEVER see sub-6K Bitcoin ever again. So rather than continuing to indulge your fantasy why don't you get with the program and start putting a little Bitcoin into your stack while you still can? Unless of course you'd rather hang on to your dollars. At the moment the dollar still has about 3 to 4 cents purchasing power since the day they were first printed. That's right, a $25,000 car today would have cost you about $750 or less many years ago when the dollar was actually worth something. Like I said, right now you have about 3 to 4 cents left but that too will soon be gone as the Fed lowers rates and starts printing more dollars. But hey, stack as you will. It's none of my business what you do. I just know what I'm doing. :0)
And that's just my 2 Satoshi on the matter.
Good luck!
BBS out.
Bitcoinbearslayer

Bitcoin - Just posting for future reference.I just want to see if this count is even remotely close considering there is very little to go by at this point....
Good luck out there.

Bitcoin - The Double Three is complete! Or is it?Hello my fellow Bitcoinistas!
I hope you enjoyed your long weekend for those of you that had one. I certainly did. :0)
I'm going to go out on a limb here and suggest that the main correction is over. That's right, over.
Unless this "Double Three" correction were to turn into a "Triple Three" correction which means we would need to tack on another X Wave followed by another smaller corrective pattern.
I don't think this will be the case. I think the market has had about enough of this shit and is ready to move on. I know I am.
If this last impulsive move up is the beginning of Wave 1 of the next 5 Wave move up then Wave 2 could retrace almost all the way back down to were wave 1 started. (Down by the blue Wave 5 and Y on this chart) It doesn't have to, I'm just staying it could retrace quite a bit and still not violate the rules. In other words I would not chase it. If I were looking to add to my longs I would wait for the pullback before I commit. That's not advice, that's just me.
If I'm wrong, I'm wrong, but I don't see any other way to count it right now.
I hope this post finds you all well and in the money.
BBS out !
For more information about the "Double Three" look here: " www.elliottwave.net "

Bitcoin - Back to the Zig ZagI hate corrections. I've tried to make that triangle work every way I know how and it just doesn't fit. I've gone back to looking at a 5-3-5 Zig Zag as the final move for this Double Three correction.
Wave 1 and 2 are now obvious. When I put the Fibs on Wave 2 (not shown) it was a perfect fit. That now means we are in Wave 3 down. Where does it end exactly? We can only guess. If you look at this chart you will see I did make a guess and then pulled the fibs off that guess to finish out a guess for Wave 4 which lets me guess at Wave 5. All in all everything from Wave 2 down is a big fat guess.
If any of this is true then what is my conclusion?
Wave 5, and this correction, could end anywhere from just under $9K to just under $8K. (Not much help I know) All I know for sure is that we are getting closer every day. What may work out to our advantage is that we continue to drift around and build out the rest of these waves right up until BAKKT opens on September 23rd. Then the flood gates open, this correction officially is ends, and Bitcoin starts its rocket shot to the moon!
One can dream.....
I'm still long hanging on like a bull dog. :0)
BBS out

Bitcoin - Up is Down and Down is upWell the last bullish looking triangle broke bearish so maybe this bearish looking triangle will break bullish. If not, I think $8,500 is on the menu. At this point I wouldn't mind seeing $8,500 so people will STFU about the fake CME paper market gap.

SLV goes BAM !!!If I had not been a Gold Bug looking for sound money years ago I probably never would have bought into Bitcoin when I did. Once you know what real money is, you know how to recognize it when you see it. It's also why I continue to buy the metals as well as the cryptos and the metal derivatives with the cash I can't get out the market without penalty.
Gold, Silver, Bitcoin and even some Litecoin is what is going to get you from this side of the crash to the other side with the least personal damage IMO. Even If I lose 100% of my paper metals due to counter-party risk it just means my physical stack will be 5 or 10 X by then.
Good luck out there. It's going to get rough.

Bitcoin - Is the WXY correction about to end?Hello my fellow Bitcoinistas!
Is it possible? Is this complex correction about to end? It could be. After reading up on "double three" corrections we have a Flat, followed by an (any three) X Wave, followed by a 5-3-5 ZigZag OR...…………… a TRIANGLE. Well, this crazy shit they call a chart looks more like a triangle forming than anything else.
Do you agree?
See the following link for an example
" www.elliottwave.net "
Scroll down to the section labeled "Combinations (double and triple threes)
I'm still long since the beginning of time and plan to remain long no matter how this plays out. With BAKKT starting in a few weeks it's not time to get cold feet IMO. Good Luck!

Bitcoin - WATCH OUT MOON !Good Morning my fellow Bitcoinistas! I am still pondering how this 3rd corrective pattern will end, but end it will. And when it does end WATCH OUT MOON !
For those of you new to my work I am still 100% long Bitcoin and have always held a small long position since 2013. Yes, I have traded a little BTC here and there over the years and taken some profit but my primary focus has always been to accumulate as much as I can before the big pay day arrives.
Well....... I think the big pay day is about to arrive. Or should I say the beginning of MANY big pay days is about to arrive. Or better yet, the first big pay day of a life of pay days is quickly approaching. Yes, I believe that if you hold enough Satoshi now you may soon be able to start taking a weekly or monthly pay check against them for the rest of your life. If you have an entire Bitcoin or more you may be able to not only take a pay check every week for the rest of your life but pass down generational wealth to your family too. It may still take a few years to reach that extreme level but I believe it is very possible to see in your life time if you are 70 or younger right now assuming you make it to at least 80. That's right, in less than a decade if it event takes that long. Look how far Bitcoin has come in one decade when NOBODY was watching. Now the entire world is watching and all the Big Players are lining up to take their piece of the pie. No matter what the pie is, and no matter how small or how large the pie is, these people ALWAYS have believed that it is their God Given right to own the majority of the pie. Am I wrong? They have done it with Stocks, Bonds, all Commodities, Real Estate, Currencies of the world, etc. etc. They gobble up anything and everything of value and leave the scraps for the rest of the population. What do you think they are about to do with Bitcoin ?
I thought at first, maybe they are buying up Bitcoin so they can destroy it. For what? So all of their paper denominated assets go to zero as the dollar continues to lose value or hyper-inflates to zero? No, that can't be it. They don't want to save the dollar. They couldn't give two shits about the dollar. What they want to save is their wealth and power. For the really rich, and the really wise, hanging on to a dying financial system and debt based monetary system does not make any sense. What does makes sense is for them to protect the dollar and prop it up just long enough form them to make their escape into something new. They know that the old financial system is going down and anything attached to it will go down with it. They KNOW this.
So what is their answer? In a word - Bitcoin
Bitcoin is the only financial asset available that has absolutely no counter-party risk when you hold your own keys. Not even gold or silver can make that claim when it is stored in somebody else's vault. They need a life boat that is completely independent of any of the other financial markets that my implode from their mismanagement.
So when other markets and currencies decline where are the value of those dollars going to go? For the well informed they are going into Bitcoin. For the brainwashed bag holders their dollars will ride those markets down to the basement.
You are the fortunate ones in my opinion because you are paying attention and taking action. Others just think Bitcoin is another fad that will soon pass like cell phones or the Internet. Too bad for them. Crypto will soon be running the world and you are either ahead of the curve or you are not. By the time most people come to this epiphany it will be too late for them. They will remain the day to day debt slaves they've always been working paycheck to paycheck just to make ends meet. Even after their paychecks are denominated it Satoshi it will be too late for them to amass great wealth starting from zero. One benefit on their side, however, is that anything they save in Bitcoin will not be eaten away by inflation like their dollars of the past. So in that situation even the lowly savers might have a chance to put together a little nest egg for themselves over time unlike today.
YOU HOWEVER HAVE A ONCE IN A LIFE TIME OPPORTUNITY IN FRONT OF YOU RIGHT NOW!
Yes I meant to yell. I needed to get your attention and I'll end this extra long monologue with these final thoughts: Trading is a great skill if you are good at it. Those that are good at it have made tremendous profits in terms of dollars over the years. I, however, have never been particularly great at trading. I have done very well recognizing trends, patterns, and looking long term down the road while others are looking short term at their own selfies but I am not that great at perfectly trading those ideas. That's why I HODL more than trade. I, and I suspect you, have been blessed with the curiosity of looking for what is NEXT instead of just focusing on the nonsense that is dangled in our face every day. I believe what is next is Bitcoin and I believe that now it is the time to HODL and accumulate more than it is time for trading. (unless you are really good at it) I thought about raising cash at the peak of the next move but where is that? How high will it go? When will it turn? Will it turn? I don't know. What if it goes lower? How much lower will it go? I don't know. The market has done a particularly good job this time of disguising its intent. So even though I can't tell exactly what the price is going to do next based on looking at the charts (that which is dangled in my face) I can get a good idea of what is coming next by watching what the big money players are doing. What are they doing? Buying massive quantities of Bitcoin OTC and spending millions and million of dollars to build out the infrastructure needed to promote their new found investment of the century - Bitcoin.
I have long believed that the easiest way to get rich is to watch what the rich people are doing and then do that. Well, we finally have a vehicle available in which we can do exactly what they are doing even before many of them get to do it themselves. We all have the ability to buy and hold Bitcoin NOW. But what happens when all of the available supply is gone? The early opportunity is gone too. Think about that for a minute. What happens when all of the available bitcoin is sucked up into their new financial system, contracts, etc? How does the average Joe get any? Answer: He works his ass off to earn it. Just like he does today for the dollars he earns.
That's why I am still buying and HODLing as much as I can regardless of price. I am buying my future pay checks now while they are still cheap rather than continue to work for them later. If I am wrong I'll never be wealthy. But that was never really an option anyway before Bitcoin. So what do I really have to lose by holding Bitcoin?
NOTHING
BBS out.
P.S - If you have an answer as to what type of corrective pattern will complete the over all Double Three correction I'd love to see it.
Thanks.


Bitcoin - Two possibilitiesGood morning my fellow Bitcoinistas!
It looks like the pattern from my previous charts are playing out very well. A 3-3-5 Flat, X Wave, followed now by what looks to be a 5-3-5 Zig Zag.
This chart zooms in on the Zig Zag to show how the count may play out. If Waves 1 and 2 are complete then we are currently in Wave 3. This Wave should complete soon IMO, and then we begin grinding out Wave 4 over the next day or so. The final Wave 5, however, is what most people are interested in. I have two possible targets on this chart circled in orange and marked with the yellow horizontal lines. The first target is around $9,000 as there is much support in that area and where many shorts may start to cover and many bulls begin scaling in long. The horizontal red line marks the CME futures gap everyone has been talking about forever. This seems like an obvious target but if we dip down that low I would expect us to overshoot it a bit. That's why I have the second lower target.
This entire complex corrective move plays well into the BAKKT futures opening on September 23rd. I suspect they are taking full advantage of these lower prices and will continue to buy Over The Counter and possibly even on the down low through the Exchanges so long as they don't spook the sheep. They may even be using the CME futures to assist.
Once they have loaded up their rocket ships with all the cheap Bitcoin they can get, the BAKKT futures open, and at that point I would see no reason to try to hold back prices any longer.
Why? Would you invest hundreds of millions of dollars to create a platform to promote your newest safe haven asset and then shit all over it? At first I thought that may be their objective but in reality they need Bitcoin to succeed as much as we do. Where else are they going to store their wealth when all of the markets around the world begin to explode and fiat after fiat fails?
No, this is their safe haven exit strategy in my opinion. Mine too and has been for years. They don't care about speed, smart contracts, defi apps, point of sale, etc. They care about scarcity, cryptographic security, decentralization, mobility, and the fact that their holdings cannot be counterfeit. All the qualities needed for the mega rich to stay mega rich. I plan to join them.
BBS out.

Bitcoin and the complex correctionI hate to say it guys but this correction might not be over. What I can say with confidence, however, is that we have already completed a text book 3-3-5 Flat Correction and that did not end the overall correction. Then we completed what looks to be a large ABC pattern or X Wave and that did not end it.
From what I have studied some corrections become more complex by chaining multiple Elliot Wave corrections together before the overall correction finally ends. A "Double Three" for example will complete one corrective wave pattern, have an X Wave, followed by another corrective pattern and then it's over. There is also something called a Triple three which has a corrective pattern, x wave, corrective pattern, x wave, and then ends on the third corrective pattern. Hopefully we won't have time for all that nonsense.
What appears to have happened is that we definitely completed a 3-3-5 Flat corrective pattern and I'm assuming the big ABC that followed was the X Wave and we are now trying to finish up with the final corrective pattern. The Zig Zag makes the most sense at this point and looks to be what may be playing out. The Zig Zag is a 5-3-5 type corrective wave pattern.
For Elliot Wave pattern traders looking to profit from this move they might exit their longs or go short at the top of the Zig Zag B wave and cover or go long again at the bottom of Wave 5 at the end of the pattern. Of course hitting those marks exactly is easier said than done and by the time you actually realize what pattern is forming it is often too late for the best entries or exits. Unless of course you know the Fib retrace levels which can give you a bit of a heads up on where the waves will most likely begin and end.
At any rate, like always, this is not advice, just one person's opinion of the current chart situation. I thought about raising cash at the top of Wave B but will probably wait and just add more longs to my position at the bottom of the Zig Zag if that plays out. Yes, very possibly around $8,500 :0(
No matter how you play the chart over the next several weeks good luck!
BBS out.

Bitcoin - I was wrong but now I'm strong!I worked the hell out of that last count and gave it every opportunity to succeed. But, at the end of the day, it failed. First I got sad, then I got mad, then I got back to work!
This chart is the result.
The triangle is a perfect fit, the WXY fits, and, if we are to continue higher, the current count with Fibonacci confirmation fits. A bounce off the 61.8 or 78.6 at the bottom of the triangle would complete Wave 2 and be a good indication that I am back on the sent of the bear trail. If I catch them I'm hanging another bear head on the wall and putting another bear rug in front of the fireplace!
BBS out.

Bitcoin - Close but no cigar!So long as the price of Wave 4 does not start making 4 hour or 1 day closes below the top of Wave 1 the Bulls are still in the game. Are the tables turning Bears? Did you get trapped by the Bitcoin Bear Slayer? LOL I guess we will all find out soon enough....

BTCUSD Possible Bears Taking Control??BTCUSD Bitcoin on the daily time frame as been in this up trend now for around 9 days and just yesterday has broken this up trend line im looking at the 4 hour time chart as we are in an Equilibrium pattern and looking to break Bullish or Bearish tonight or early in the morning this could confirm the swing to Bearish if we break below 11450.

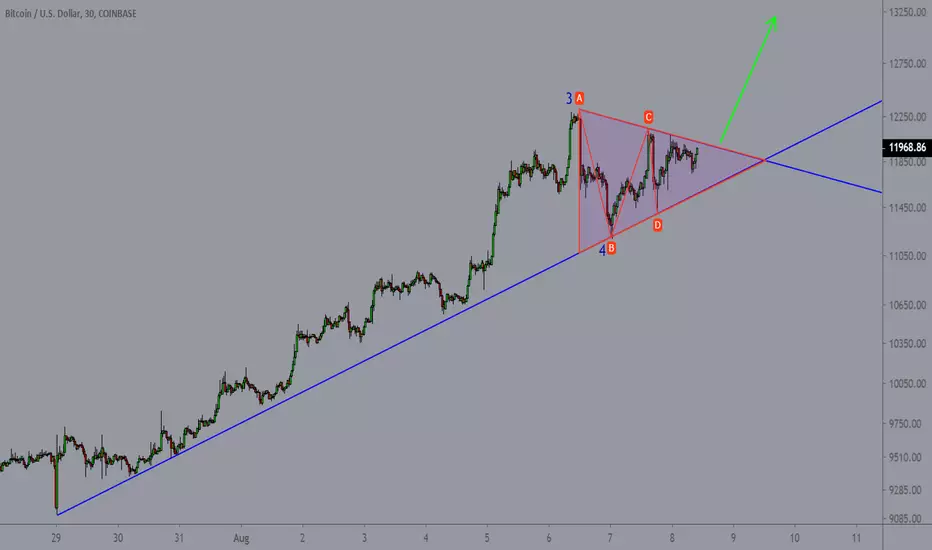
Bitcoin - The breakout magnitude is growingIt appears to me that the longer this breakout builds the larger the magnitude of the breakout will be. My previous 5 wave count out of this triangle has about doubled in size when I had to recount it this morning. What I have drawn above may be the minimums. Wave 3 up could far exceed the 1.618 Fib before pausing to start Wave 4 making the total move even larger.
Good luck!
Bitcoin and the Perfect TriangleGood morning,
This triangle is another very good reason we may be going up to complete Wave 5 soon.
Good luck today!
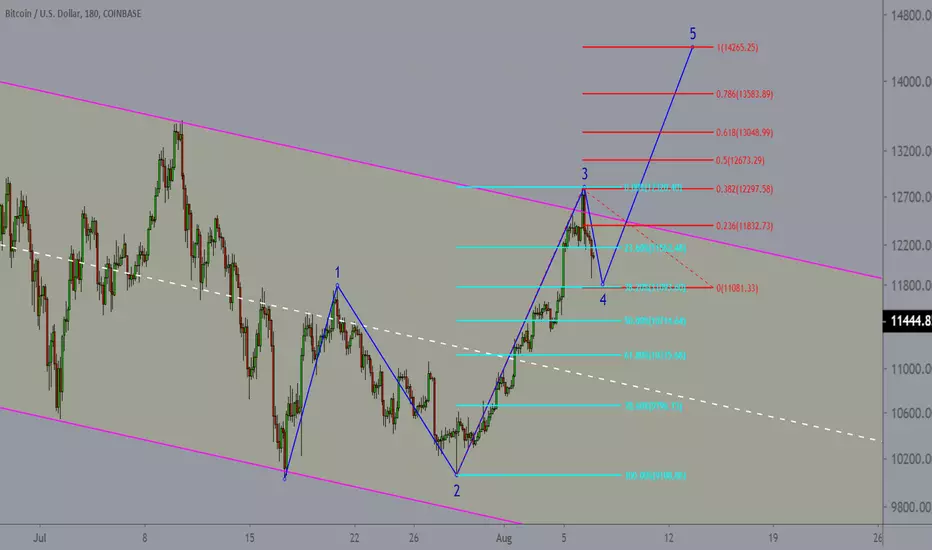
Bitcoin working on Wave 4 of 5?This is what I am currently look for. If the Fibs workout the entire last move up may have been the completion of Wave 3 and we are working on Wave 4.
Still long, still a hodler, still doing what hodlers do - Hodling. :0)
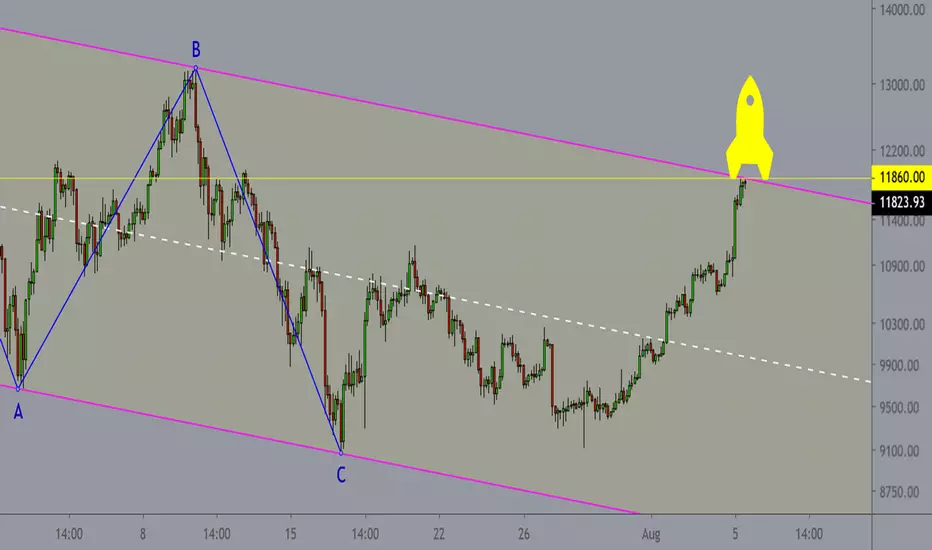
Bitcoin is on the launch padIs the market ready to light the fuse and break out of this channel, flag, correction, etc. or do we pull back one more time?
Stay tuned.....
Bitcoin - Crack should be illegalHello my fellow Bitcoinistas!
Wow what a ride of late. As you can see on the weekly chart the 20/40 moving averages, once crossed, do not uncross until the bull run is over. This could take years.
You will also notice that the 20 week MA is about $8,300 right now while the 40 week MA is about $6,100.
Anybody still calling for sub $6K Bitcoin must be smoking crack or something. That's the only logical explanation and it should be illegal.
Can you still buy and sell this market for short term profits? Sure you can. But are you consistently that good? I'm not. I'd rather just buy the dips and hold on. It's been a winning strategy so far because I DO NOT SEE BITCOIN EVER GOING TO ZERO. It is here to stay. BILLIONS HAVE BEEN INVESTED INTO BITCOIN by people with far more money than me. That's all I need to know.
But like it was said long ago: "All good things come to he who waits." Well I've been waiting for years and I'm still willing to wait awhile longer. How about you? Are you willing to wait or do you have to have it all right now? If you need to have it all right now then take your profits and make room for those who are willing to wait. I want to know that my new peer group went through similar trials and tribulations like I did to become wealthy. That way we all have similar stories to tell, reflect on, and laugh about. I'm not looking to hang out with some Johnny come lately who just happened to fall ass-backwards into a good trade. They're a dime a dozen.
Thanks!

Bitcoin - 3-3-5 Flat Correction or is it?Since price did not break the previous low I am counting it as the bottom of wave 2. The next Wave 3 will be the tell. If Wave 3 consists of 5 sub-waves that measure impulsive instead of corrective then what we have seen is most likely a 3-3-5 Flat correction and BTC will start moving up from here.
If, however, the Fibs of the Wave 3 sub-waves measure correctively then further downside would be expected. Instead of being a 12345 move North it could turn into more of an ABC correction and start moving down again. Like I said, the tell will be in how the next sub-waves play out.
I'm still long unless this next move turns out to be corrective. If so, I'll bail and look for a better entry at lower prices.
No matter how you play it. Good luck!
BBS out.
P.S. If you are not familiar with the term 3-3-5 Flat Correction do a Goggle search and look at some of the examples. You will quickly see this is a good match for what is currently going on. The only question is whether it continues to play out like this morphs into something else.

Bitcoin - LongI'm long again. After reviewing the post of some of my supporters, other opinions I value, and stepping back and looking again at my count I believe the bottom of 2 is still valid even though it slightly extended past the 78.6 Fib. My line in the sand is the wave V of C line at the bottom of the chart. If this level gets broken I'm out again to reevaluate the situation.
Until then fug the Bears. I've got my sword and a hard on. It's time to fight!
BBS out.
P.S. When I say take out the line I mean take it out. If we just double bottom I'm adding to my long position

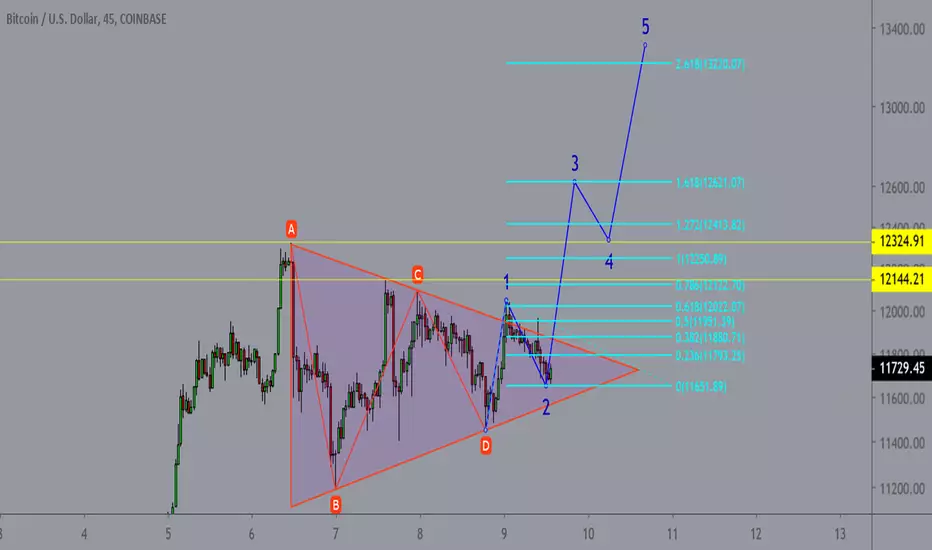
Bitcoin - The Bigger PictureThis is my current hypothesis. It remains valid so long and the price does not break below the blue 2 and invalidates the count. If it does break below the blue 2 then my expectation would be to complete a larger 3 wave ABC down and start the new 5 wave count up from there. Unless and until this count gets violated I'm sticking with it.
Good luck and have a nice day.
BBS out.

Bitcoin - Next verse just like the firstNow that we have clearly finished wave 5 of the previous move we are on Wave 1 of the current move. Wave 2 will often retrace as far down as the 61.8 or 78.6 Fib level of Wave 1. As you can see on this chart it looks like Wave 1 has topped out just over $10K and is pulling back to put in the bottom of Wave 2. If this plays out to the lower fibs I plan to add to my longs down around those level. If it does not pull back that far I'll just sit on what I have and ride it to the upside.
Good luck and have a nice day!
BBS out.
