Bitcoinbuy


🐻 Satoshi, Are You Out There?!?! (BTC)🤔 Bitcoin is once again showing very bad signs under that 10k resistance. The bears are driving the permabulls insane!!!! 🤣
Week after week after week we struggled to breach and now you can see that our candles are compressing at resistance, never a good sign! 🚫
I have two early confirmations printing on the ema dots indicator down below. 2 red dots forming, now we just need the 3rd to align with a red candle Crossover. We will get the close on june 14th for the 3 day chart. 🚨
Stay on your toes and on high alert! This could get ugly! 🤢🤮🤢🤮
Best of luck, Don't forget to hit that follow and to smash that like button! ✌😁✌❤❤❤
We will follow up with an update on this post.
Have an awesome weekend! 🍺🍺🍺
🥇MLT | MAJOR LEAGUE TRADER

Bitcoin bullish in upcoming days we will see 12,000$ markMomentum has turned bullish so expect the price to rally up after a small correction

BTC/USD WEEKLY TIMEFRAME ANALYSIS!!!-Trend line is being broken and supported, This coincides beautifully with the Support structure created by the failed HALVING PUSH.
-During the halving, Price was forced to stay above the 8000USD Mark. Which is a fantastic indication that price will remain above.
-Completed "M" Reversal Pattern. With a beautiful "W" Continuation pattern formation from the daily consolidation at the trend line and HALVING SUPPORT STRUCTURE!
-Another LONG indication is the strongly, CLOSE formed SUPPORT STRUCTURE THAT TOOK 2 YEARS AND 7 MONTHS.
Video with more detail coming soon!

Bitcoin is going to cross 10000$ | Oct 2019 & February 2020 HighCurrently Bitcoin is trading above a minor S/R area and between two trend Support & Resistance !
from here if Bitcoin don't break down the minor S/R level then bitcoin can go from the current price to as high as 10400$(Octuber 2019 & February 2020 High!)
if Bitcoin break down the minor S/R level then it will get supported by the uptrend support area(8900-9000$) and the 200MA most likely and then rally to 10400$
If we buy now then we can put a stop loss below minor S/R area ! and we can wait to see the price movement and take entry as our plan above!
All the Best ! 👍
Stay Tuned ! : )

Bitcoin BUYSIGNAL #DaytradeHey tradomaniacs,
welcome to another free trade-plan .
Important: This is meant to be a preparation for you. As always we will have to wait for a confirmation.
Market-Buy: 9330,00
Stop-Loss: 9080,00
Target 1: 9540,00
Target 2: 9790,00
Target 3: 9950,00
Stop-Loss: 250 pips
Risk: 1%
Risk-Reward: 2,42
LEAVE A LIKE AND A COMMENT - I appreciate every support! =)
Peace and good trades
Irasor
Wanna see more? Don`t forget to follow me.


Trading Bitcoin | Buy Orders | Elliott Wave (Mar 2020) - Part 3Intermediate (2) (green) Structure - Zig-Zag
Leading diagonal in Minor A (red).
Running Flat in Minor B (red).
Impulse in Minor C (red).
Intermediate (3) (green) - Expectations
Bullish Impulse, Extension in a Rally.
Technicals - Favorable Details
- Descending Channel within a Complex Correction
- Bearish Divergence at the termination points of Minor C (red)
- Potential Hidden Divergence at key Fibonacci Retracement levels.
- Bull-Flag Pattern in Intermediate (2) (green)
- 61.8% Fibonacci Retracements of Intermediate (1) (green)

Bitcoin targets 9973 with 99% probability until 11th March 2020I have done a statistical analysis on BTCUSD chart and looks like there's 99% probability that Bitcoin will hit 9973.40 until 11th March. We can expect a pump anytime sooner. Just watch and get ready.
PS. I think this move will start sooner but for now, i can say until 11th March 2020
Disclaimer: This is not a financial or investment advice.
Remember to follow me for more
Trade safe,
Atilla Yurtseven

BITCOIN - 3 REASONS for a BUY-SETUP TRADING plan LOADINGUP!!Welcome new subscribers, Feel free to relate with my trade analyses.. Update me on your running positions. Thank you. Congratulations on our previous massive buy on description below. Happy to share my BITCOIN IDEA And also give 3 potential reasons we would expect a short sell, And buy long, Just my idea thanks! Leave a like and follow for mainly NASDAQ indices updates!
3 POTENTIAL REASONS FOR A LONG BUY-SETUP LOADING:
- STRONG & S/R
- BULLISH PENNANTS
- CUP & HANDLE FORMATION
Bullish Pennants - Continuation pattern that marks a pause in the movement of a price halfway through a strong uptrend, giving you an opportunity to go long and profit from the rest of the price rise. so we sell short to bottom trend-line then buy long to 10k/12k as long as Strong support/Bullish trend isn't broken then buy
Strong Support & Resistance: As we've also seen how trade respectively reversed on 1st resistance heading to Supports(Law of S/R), so wait for Reversals(Patterns, Candles) If no break then we go all the way to 10k Then if broken 1st resistance we go straight up to TOP RESISTANCE ON 12K price
Cup & Handle formation: Also as we can see,The Cup with Handle is a bullish continuation pattern that marks a consolidation period followed by a breakout. And Cup formed and waiting for handle completion to form properly back up for a bull reversal to 10k or 12k
So these are my little thoughts on BITCOIN trading From previous analyses on Feb 3rd. I would have gave more reasons with additional indicators/patterns, But i selected the 3 most effective to avoid a buggy charts. SO With such 3 great potentials prove with 90% possibilities hopefully we achieve said Targets once again and not been affected by the recent bearish movements on major stocks due to the global pandemic panics. [ SO therefore we sell short & Buy long! Trade safely guys & stay very alert when we get to the Buy parameters Then invest!
Please Like and share your ideas on this particular pair too. Also always apply proper risk managements thanks!

Bitcoin Rally 2020BITSTAMP:BTCUSD
Bitcoin BTCUSD just breaking out above 9000. It appears to have momentum in the hourly charts, enough to to break above, stay above and to close the week above 9000.
This is a very significant level for the next phase as it appears as a confirmation qualification for a major rally to 18000.
The Weekly BTCUSD chart is very reliable and captures less volatility spikes. Signals on the weekly chart also allows better and more robust analysis and signals in the long term.
At the time of publishing, there is significant and higher than usual probability to indicate a start of the next rally.
Note that there is a lead rotation between BTC and Alt coins such as LTCUSD (Litecoin) and ETHUSD (Ethereum).
Overall, in summary, this one worth keeping your eye on...
HEADS UP!

BITCOIN UPDATE: Critical Decision-Making AreaAs projected, Bitcoin has reached the $8000 - $8500 area. This is a critical decision-making area for BTC. Price can either head higher or decline to $5500 area, as mentioned in the previous analysis.
To confirm the major bull run has started, I would like to see price breaches the $14500 level in a five-wave structure.
What's your current view on Bitcoin?

BITCOIN ABOUT TO PRINT A DAILY DOUBLE BOTTOMBitcoin price hit the neck line, now become a strong support level. Price rally the second time from there and about to show a daily bullish engulfing candle.
Pending daily double bottom to send price to potential new high.

BITCOIN "BTCUSD" Hourly Chart UpdateThis is the lower timeframe analysis of Bitcoin. While the invalidation level remains intact we should be expecting a rally either short term or longterm.
Time will tell!
Best,
Veejahbee.

Elliot Wave: BTCUSD "BITCOIN" Intraday Buy SetupBitcoin is now setting the stage for wave 3 of (3) of ((3)) advance.
A significant rally should commence once the current correction is completed. I'm projecting that the upper trendline will accumulate sellers and signal the completion of wave ((3)). Looking to add more positions at $7450 area, while the key level on the chart is where we don't want price to breach while the correction is still unfolding.
Also, kindly follow below link for subsequent intraday updates on Bitcoin. I will not be posting a standalone intraday like this.
What's your take on Bitcoin? Do you trade it or just buy and hold?
Kindly let me know in the comment and tag colleague traders that want to trade Bitcoin.
Thanks for reading!
Veejahbee.

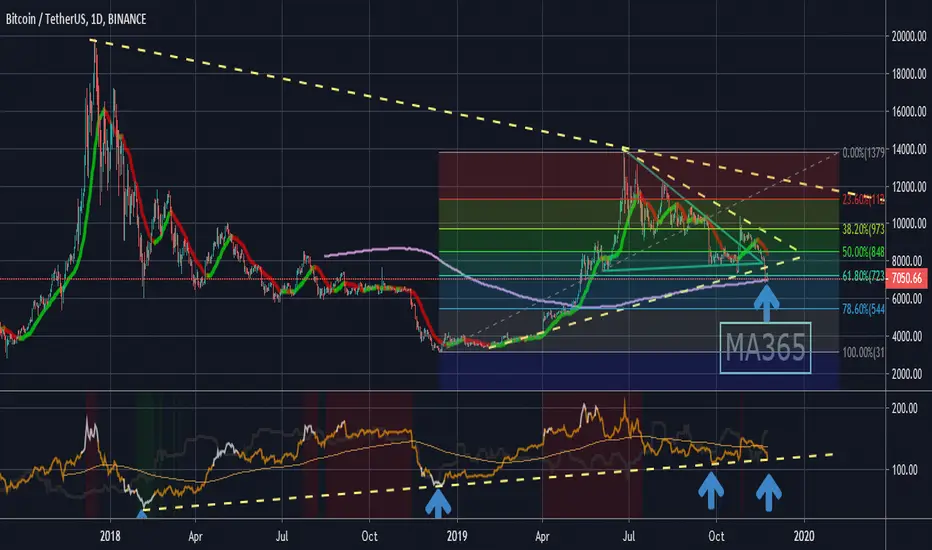
Bitcoin Update: BTCUSD Has Bottomed and Major Rally Has BegunBitcoin started the correction from $13774.7 on 25th, June 2019, and now it seems to have bottomed at $6617.9 area on 25th November 2019.
The retracement lasted for five months and seemed to end on the exact day in November, "25th." So crazy how market work.
The corrective wave which unfolded has double three zigzag seemed to have found a bottom at $6617.9 critical support circa. The zone was comprising the low of the previous fourth wave at one & two lesser degree, 61.8 Fibonacci retracement of the advance from $3220.8, and fourth bounce of descending wedge support.
Today's also mark the first day we see a strong bullish rejection candle coming off the critical demand zone. So it's highly probable time to get in if you're considering investing or trade Bitcoin or other cryptos since Bitcoin is their primary price driver.
Checking to see if we see impulse move on lower timeframe:
So from yesterday's low, bitcoin rose in five-wave impulse, and according to EW theory, impulse determines the direction of the market and follows by three-wave correction. The retracement which seems not completed yet due to the shallow structure, I'm expecting the correction to reach 50% Fib area before the rally resumes. Yesterday's low must be held to believe we had a bottomed indeed.
If this wave count is correct, we should anticipate a rally from or near the current level and advance towards the resistance with 0.786 and 1.0 Fibonacci extension, as indicated on the chart.
Best of luck on the chart!
Veejahbee.


Bitcoin Bullish CaseIf you're looking for a bullish bias for Bitcoin then
take a look at the Daily chart. After that massive impulse move to $10.5k price has been slowly grinding it's way lower and lower to where price is chilling out now at $8.8k. If you're looking for a time to buy the pullback of that impulse move now may be you're time. There is a pretty obvious falling wedge that is coming to an apex and price is right around that sweetspot 61.8 region.
Buy zone - $8300-8700
Let me know what you think!


BTC Bull run bottoming likely + Bull Div fractalsBitcoin bottoming from here is likely due to signs of fractals and bullish divergence at the oscillator which are the MACD and RSI. Inline as well with CCI (Removed it so the chart is not congested). Inline with Elliott Wave theory and its subwaves finishing along with Fibonacci golden ratios 61.8 matching it. I see 2 possible bottom. 1st support box is the strongest inline with Wave 4 of the previous impulsive wave. Corrections of Elliott wave likely ends where wave 4 ended. But if not we can see another bottom which is the 2nd green box support which I considered as it inlines with the golden ratios as well.
If it breaks support likely we can see another drop and correction is over making this analysis invalid.

BTC BUY!!!BTC BUY OPPORTUNITY:
The market has secured Very strong bullish momentum so we can place our stops relatively close to the entry price.This will allow us to have a better RR ratio.However we must take into account wickfishing when placing stops and TPs.
I would place multiple entries for this, with stops at break even or a small loss, keeping our RR high in the 10 region.
It looks like BTCs Bull run may start soon, My bias is we shall be staring November with strong bullish momentum possibly up to 16k. We shall have to see.
