BCH-4h. The price goes to the range of $ 257-268.The month on the BCH market passed in a wide consolidation range.
Buyers managed to barely update the previous high and give false hope to buyers to continue the trend.
Since December 21, the price has fallen by 25% virtually unhindered. The main volumes are concentrated within this consolidation in the range of $310-320 . Buyers have lost control of this range. If BTC does not break the $22,500 mark and goes to update the historical high - BCH buyers have a chance to regain control of $310-320 .
However, it is safest to buy a coin in the range of $257-268.
________________
We create both short-term ideas (for a local understanding of the market situation) and medium-term forecasts of price movements.
Subscribe to us and get daily concise analytics!
Bitcoincash

Bitcoin Cash (BCH) - December 22Hello?
Dear traders, nice to meet you.
"Like" is a huge force for me.
By "following" you can always get new information quickly.
Thank you for always supporting me.
-------------------------------------------------- -----
We are holding the price above the 278.26196606-293.00097721 section, so there is always the possibility of further gains.
It remains to be seen if it can gain support and rise at the uptrend line (4) and at 324.1.
Between December 30th and January 8th, we should watch for any movement that deviates from the 293.00097721-367.31848226 segment.
If you break above the uptrend line (2) and get support, I think there is a high possibility that it will rise to the 435.40010001-454.59999980 section with further gains.
If I break below the downtrend line (1) and get resistance, I think there is a possibility to touch the 209.23112174-230.18881201 section.
-------------------------------------------------- -------------------------------------------
** All indicators are lagging indicators.
So, it's important to be aware that the indicator moves accordingly with the movement of price and volume.
Just for convenience, we are talking upside down for interpretation of the indicators.
** Check support, resistance, and abbreviation points.
** Support or resistance is based on the closing price of the 1D chart.
** All explanations are for reference only and do not guarantee profit or loss on investment.
Explanation of abbreviations displayed on the chart
R: A point or section of resistance that requires a response to preserve profits
S-L: Stop-Loss point or section
S: A point or segment that can be bought for profit generation as a support point or segment
(Short-term Stop Loss can be said to be a point where profits and losses can be preserved or additionally entered through installment trading. You should trade from a short-term investment perspective.)

BCH/USDT Falling to Channel SupportBCH/USDT continues to fall after failing to close above the upper trend-line of the channel.
With crypto seeing a small retracement all over the board, I'm seeing BCH drop even further towards the lower support line. Do your own DD.

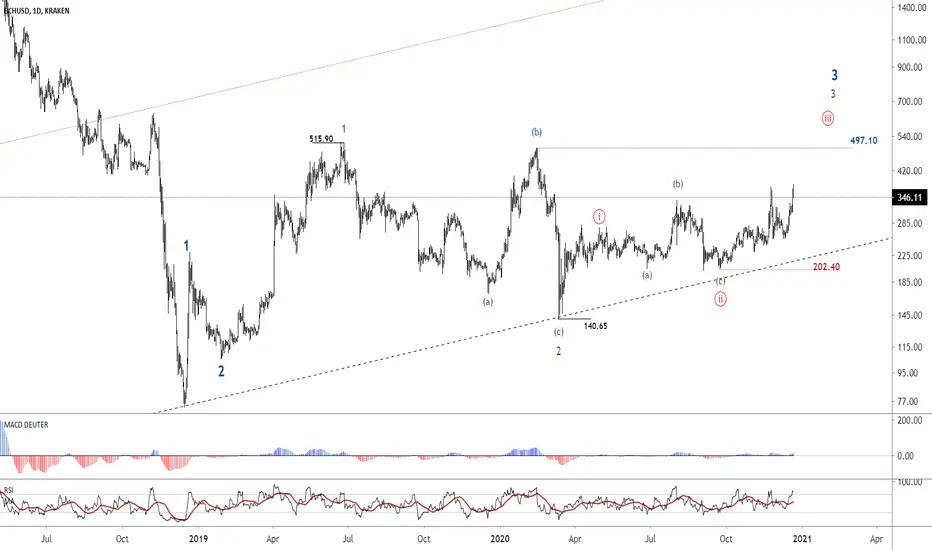
Trying to gain popularity and formation of ascending movement In the weekly chart, there are two important ranges. The first range is $ 497.10, by crossing this range, we can be hopeful for an uptrend formation for the targets of $ 2,200 to $ 3,000. Also, if the price crosses the range of $ 231.07, it may encounter the Triangle pattern, in which a long corrective movement is predictable and then we expect a descending movement up to the range of $ 45-50.
( weekly Chart )
In the daily chart, we can have this wave count that wave 2 has ended in the range of 140.65, and the price is forming wave iii. However, to confirm the uptrend, the price must cross the range of $ 497.10.
Personally, I’m interested in putting my investment in Light Coin (SHA256).
Bitcoin Cash - Daily UpdateBottom Line: A third wave rally is in its early stages.
Key Levels: Above 280.33, 324.90, 337.64 Below 133.74, 204.46, 231.43
Outlook: Higher in a developing third wave advance against 204.46.
Analysis: We continue watching for evidence a small second wave correction is at or near an end. Key support for our outlook is 245.59, with critical support at 231.43.

#BITCOIN CASH #BCH USDT ( Mid Term )
Are you ready to be patient to make some profits
The rise may take some weeks
Targets ( Mid Term )
T1 : 452$
T2 : 590$
Profit : 125%
Targets ( Long Term )
TP3 : 1750$
TP4 : 2844$
Profit : 930%
Stop : 196$

Bitcoin viewAnother boom is already started. In previous run-up after break out it goes more than 222% (closing basis) in 91 days. This time if we consider half of percentage of previous run-up that is 111% appox and considering 91 days (closing basis) . So possible minimum target is 22905.
Disclaimer:- your capital at risk. Consult before investing your financial advisor.

BCH Bitcoin Cash I am just not buying it. Looks like a rising wedge and we all know how they usually end. Still think there will be another shake out

BCH Long term bullishMA's flipping bullish on weekly chart, other indicators support bullish action coming.
Also spotting HH - HL trajectories
Just an idea, BCH was one of the first coins going crazy after the previous 2017 Bitcoin ATH break.
DO YOU KNOW:
The break of the 2014 ATH happened on February 20, 2017
On February 27, 2017, the altcoin market cap doubled and the 10-month bull run begins
So, no advice but hold on. I also see an upcoming run for the alts

Ahead of the Curve - InformativeThis is an informative post rather than an analysis.
Hopefully someone extracts some value from it.
I believe in staying ahead of the curve, in doing this, we don't need to make fast moves. Being patient often pays.
For example Bitcoin Cash, has a goal at the end of its Roadmap "mankind scale" which includes 50 transactions a day for 10 billion people.
Positioning ourselves for these events in the roadmap, can provide a new way at looking at scaling and in my mind 'payment options'
We are starting to see the adoption of Bitcoin ATM's and Bitcoin payments within stores. "the obvious option is "buy bitcoin??!" which I feel a lot of people stick to.
However is this ahead of the curve?
In the grand scheme of things it most likely is, but are there better options?
Bitcoin Cash for example, a fork of Bitcoin, is processing more payments than Bitcoin in Africa, coupled with an underdeveloped and youthful TA situation. Gives large prospect for growth. The 'mankind scale' creates a thought provoking assumption. That the majority of the world will be using cryptocurrency. (im not an expert at population inflation rates)
In my opinion Ethereum is the clear winner in diversifying and revolutionizing the way we view currency. With the introduction of DeFi. And my portfolio reflects this decision.
Thankyou for reading my thoughts.
Remember its not just Bitcoin.
Bixley

💡 Don't miss the great buy opportunity in Bitcoin Cash/BitcoinTrading suggestion:
. There is a possibility of temporary retracement to suggested support line (0.0143). if so, traders can set orders based on Price Action and expect to reach short-term targets.
Technical analysis:
. Bitcoin Cash/Bitcoin BCHBTC is in a range bound and the beginning of uptrend is expected.
. The price is below the 21-Day WEMA which acts as a dynamic resistance.
. The RSI is at 70.
Take Profits:
TP1= @ 0.01610
TP2= @ 0.01760
TP3= @ 0.01890
TP4= @ 0.02040
TP5= @ 0.02330
SL= Break below S2
❤️ If you find this helpful and want more FREE forecasts in TradingView
. . . . . Please show your support back,
. . . . . . . . Hit the 👍 LIKE button,
. . . . . . . . . . . Drop some feedback below in the comment!
❤️ Your Support is very much 🙏 appreciated! ❤️
💎 Want us to help you become a better Forex trader ?
Now, It's your turn !
Be sure to leave a comment let us know how do you see this opportunity and forecast.
Trade well, ❤️
ForecastCity English Support Team ❤️

BCH/BTC 6h (Binance Spot) Descending triangle near breakoutBitcoin Cash is preparing for next big move, I believe it will be upwards.
Current Price= 0.015772
Buy Entry= 0.015898 - 0.015408
Take Profit= 0.017398 | 0.018854 | 0.021621
Stop Loss= 0.014495
Risk/Reward= 1:1.5 | 1:2.75 | 1:5.13
Expected Profit= +11.11% | +20.41% | +38.08%
Possible Loss= -7.43%
Fib. Retracement= 0.5 | 0.786 | 1.272
Margin Leverage= 1x
Estimated Gain-time= 480h

Low risk, high reward oppurtunity on BCHThis one hasn't shown much promise until now. Eve&eve on shorter time scales right along the 200 daily sma. Could be a low risk entry for BCH and weekly has huge upside potential. stay above the 200 daily sma with an appropriate stop.

Bitcoin Cash (BCH) - December 15Good morning?
Dear traders, nice to meet you.
"Like" is a huge force for me.
By "following" you can always get new information quickly.
Thank you for always supporting me.
-------------------------------------------------- -----
We must see if we can climb above the resistance section of 278.26196606-293.00097721 and break above the 293.00097721 point.
If it falls at 278.26196606, it is a short-term Stop Loss.
If it rises from the 293.00097721 point, a move is expected to break above the 324.1 point.
-------------------------------------------------- -------------------------------------------
** All indicators are lagging indicators.
So, it's important to be aware that the indicator moves accordingly with the movement of price and volume.
Just for convenience, we are talking upside down for interpretation of the indicators.
** Check support, resistance, and abbreviation points.
** Support or resistance is based on the closing price of the 1D chart.
** All explanations are for reference only and do not guarantee profit or loss on investment.
Explanation of abbreviations displayed on the chart
R: A point or section of resistance that requires a response to preserve profits
S-L: Stop-Loss point or section
S: A point or segment that can be bought for profit generation as a support point or segment
(Short-term Stop Loss can be said to be a point where profits and losses can be preserved or additionally entered through installment trading. You should trade from a short-term investment perspective.)

MY LAST CHART BEFORE THE REAL EXPECTED REJECTION USDT DATA EXPLThis will be my last chart on tradingview before bitcoin starting to get the real rejection where i was talking before about it.
And as we have seen usdt whales really playing with usdt as i did add yesterday. we have seen this change after my chart of yesterday.
We have hit the the target above 19200, and yes we have hit also 19400 as expected in my before chart.
But for now be alert with all up trend orders ! depending on usdt data Bitcoin about to get the real rejection
I follow every day, the most important transactions, and the most important data what we should to know, and from there i make my trends.
Again price are now above 19K, and i have said it at time the real rejections could start any time.
usdt whale data was the same for most of the time, also in 2017
Have good time, and see you at below 18K trend!
# know that the real rejection dont shows before effects as on RSI, or other indicators, when it happend it go fast, and at most of time trend looks to increase.
it can take some time / but the data shows me the signals as 2017. this should be a start of down trend . dont use this personally as advice, and trade on your way.
Usdt data dont play for noting in this case.
usdt data oversold for downtrend on trend M923G
Follow/like for more content below 18K target.

BITCOIN CASH - BUYING FROM SUPPORT- ASSET HAS LANDED ON STRUCTURE DEMAND
- GOOD PLACE FOR BAG HOLDERS TO RELOAD
- 31.5% DISCOUNTED FROM LAST PEAK.
- 43% TO RETEST LAST MAJOR HIGH.
- CONFLUENCE WITH TRENDLINE SUPPORT.

USDT SHOWS TAKE OVER EFFECT VOLUM - WHALE TREND DAY trade 16-17KFiat data shows again a new increase trend on volume, what means this for bitcoin next time?
As usdt and more fiat assets shows new grow, expecting that we can see this on the chart next time.
The days trading still expecting 17K - 16K ---> long term target 16K , and even 14K possible.
But we know bitcoin not go directly always, BTC go in lines, and as traders we should take that lines.
Bitcoin now above 18K, and for some is this maybe the reason to go up trend - i can understand why. but depending on fiat data, i am still expecting more breakdown trend.
Do always your own study. bitcoin is not only for down trade to trade, but we should check all 2 zones.
Checking bitcoin only above 18680 for possible up trend rage -- but still risk for rejection.
What means this all ..
Dont take to much risk, and trade safe. Bitcoin go in lines, and fully picture are breakdown trend.
Thanks for reading this info above, and i have a great day all (:
follow/like for more content.
Thank you!

BCHUSDT - Daily analysis BCHUSDT has been printing an ascending channel since March.
Price Is testing the ascending channel support.
We could see a bounce off the channel support ⬆️ or a breakdown below the channel support ⬇️.
Possible price actions indicated on the chart.

BCHUSDT formed bullish BAT | Upto 38% move expectedOn the daily chart, the price action of Bitcoin Cash has completed bullish BAT pattern, now it has entered in the potential reversal zone. There are also 100 and 200 simple moving averages supports in the potential reversal zone.
Buying And Sell Targets:
The buying and sell targets according to harmonic BAT pattern should be:
Potential reversal or buying zone: $262.77 to $248.88
Fibonacci projection or sell zone: $295.91 to $345.57
Stop Loss:
The potential reversal zone area that is up to $248.88 can be used as stop loss in case of complete candlestick closes below this level.
Possible profit and loss ratio:
As per above targets this trade has a profit possibility of 38.8% and as per the above-mentioned stop loss, the loss possibility is 6%.
Note: Above idea is for educational purpose only.

Bitcoin Cash (BCH) - December 10Hello?
Dear traders, nice to meet you.
"Like" is a huge force for me.
By "following" you can always get new information quickly.
Thank you for always supporting me.
-------------------------------------------------- -----
You should watch for any movement that deviates from the 230.18881201-278.26196606 section.
We should watch if there is a flow that breaks through the volume profile section of the 209.23112174-230.18881201 section and the 278.26196606-293.00097721 section.
You should also watch for movements that deviate between the uptrend line (3) and the downtrend line (1).
I think BCH in 2020 was weak.
So, if you check where you're supporting it, you can expect a lot of profits in 2021.
-------------------------------------------------- -------------------------------------------
** Check support, resistance, and abbreviation points.
** Support or resistance is based on the closing price of the 1D chart.
** All explanations are for reference only and do not guarantee profit or loss on investment.
Explanation of abbreviations displayed on the chart
R: A point or section of resistance that requires a response to preserve profits
S-L: Stop-Loss point or section
S: A point or segment that can be bought for profit generation as a support point or segment
(Short-term Stop Loss can be said to be a point where profits and losses can be preserved or additionally entered through installment trading. You should trade from a short-term investment perspective.)

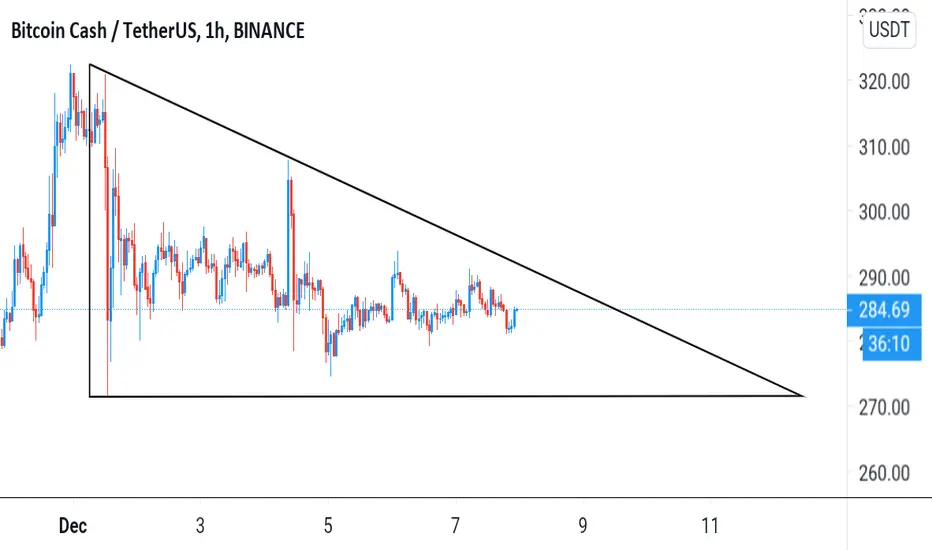
BCHUSDT - Descending triangle BCHUSDT is printing a descending triangle pattern on the 1H timeframe.
Breakout is imminent.

the early 2010 2011 buyers can crash bitcoin! 14K are the targewe see more times comments about whales, and whales. but the most Risk for crash trend on market are not the whales fully. the whales only sell a part to make other part sell more btc.
The real RISK, where the most dont talk about it are the the early buyers of bitcoin, they own more than 1000 btc for every onwer. and if just a small part of them sell. bitcoin will have a bad time.
The most early buyers did not expect all bitcoin will increase so huge. and as we know some of them did miss the 2017 sell from 19K to 3K , and have hodl until this time.
By data blockchain we still can see the the early bitcoin holders on trend.
What means this?
if they expect same as 2017, they can choice to sell, than we will get a huge dump on bitcoin trend.
# Dont be fomo as 2017, and make good study on btc, with great stoplimit.
Everting on bitcoin is possible - trade safe with your own plan. what i have add here are my personally expecting.
Have good time all (:
