BCH completed Butterfly move for almost 400% big moveHi dear friends, hope you are well, and welcome to the new update on Bitcoin Cash.
On the long-term monthly chart, the price action of the BCH with Bitcoin pair has completed the last leg of the bullish Butterfly pattern and entered the potential reversal zone. The 1.618 Fibonacci retracement level goes in the negative zone and it is not possible for the priceline to enter the negative territory, sofar the priceline has found good support at 0.01052 btc , therefore I have set the buying range from 1.27 Fib level to 0.01052 btc , however, if in the near future there will be some changes, like the priceline finds any new support then I will be keep sharing with you.
There is also a very good downtrend line support as well.
This trade has a huge profit possibility of 399%, and the high loss possibility upto 9%.
Note: Above idea is for educational purpose only. It is advised to diversify and strictly follow the stop loss, and don't get stuck with trade.
Bitcoincashforecast

BCH still got lots of potentialsWarning: our thoughts are ours; not financial advice.
BCH may seem slow, but it's sure on course. HODL on.
We could see BCH as high as $1,000 in the short-term.

Bitcoin Cash Poses To Be A Good Investment Right NowWarning: our thoughts are ours alone; not financial advice.
Not everyone believes in bitcoin cash or what it stands for. But like bitcoin, we also think it's a great speculative asset.
In our opinion, there's still opportunity to bag BCH as much as possible right now. Target, $600 and beyond.
Trade with caution.

Bitcoin Cash BCH 4 hour vs 1 Day timeframeBitcoin Cash BCH receives a sell signal on the 4 hours timeframe and another sell on the daily.
Please leave me a message if you want to test the buy and sell indicators that i am using.

BCH 1D Strong buyer is gaining position for a long time, up soonIt seems that large BCH investors still have big plans for growth.
Otherwise, we do not find another logical explanation, looking at the accumulation of coins during 2019-2020.
In 2019, the coin was sold twice above $380 , fixing the profit.
However, during the 9 months of 2020, the coin was very diligently bought in a narrow range.
Also, at the end of 2020, there was a break of the historical purple trend - up , which stretches from a high $4,000. The beginning for strong growth is laid.
Now it is important for BCHUSDT buyers and manipulators that the price does not fall below $360-400 , we take the average value, the level of $380 and record it in memory as the most important mark.
If the bullish scenario continues, it will be possible to buy tasty in the above-mentioned zone.
We will fix 300% profit, around $1200 for the BTC fork - BCHUSD.
PS:
We wrote about a possible BTCUSD cost fall two days ago in the weekly digest, read it in full)
_______________________________
Since 2016 , we have been analyzing and trading the cryptocurrency market.
We transform our knowledge, trading moods and experience into ideas. Each "like under the idea" boosts the level of our happiness by 0.05% . If we help you to be calmer and richer - help us to be happier :)

Bitcoin Cash - Time to diversify and buyBitcoin cash has been forgotten but our chart is giving us a go-ahead to buy.
Proposed take profit levels for short, mid and long-term on our chart

BCH reached strong resistance - BCH/USD entry levels - LONGBCH rocket was launched a little bit later than on BTC, but it is here. We reached an important resistance around $632. We are heading for a correction, but Bitcoin Cash is still bullish. You have several options to jump in.
ENTRY LEVELS BCH/USD LONG:
$532
$497
$466
If we break the price of $632, buy with a pullback but be careful.


BCH - A choppy way to $650BCH has been lagging behind (and there is a good reason for it = shit doest doesnt fly)
If we can rally to $500-$520, breakout out of it and retest, we have a chance to go up to $640-660.

Bitcoin Cash (BCH) long term BCH is always under the radar. Some think its a Chinese scam, others dont know anything about it.
It appears that we are in an uptrend channel with a possibility of doubling from here.
However could always go to zero too ;o I am going to lean towards the statement above though
Merry Christmas and have a glorious weekend!

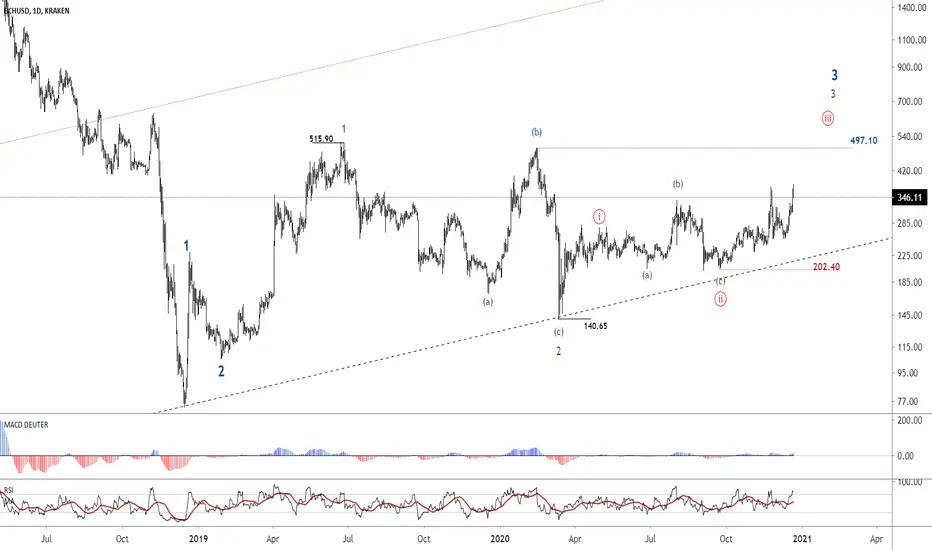
Trying to gain popularity and formation of ascending movement In the weekly chart, there are two important ranges. The first range is $ 497.10, by crossing this range, we can be hopeful for an uptrend formation for the targets of $ 2,200 to $ 3,000. Also, if the price crosses the range of $ 231.07, it may encounter the Triangle pattern, in which a long corrective movement is predictable and then we expect a descending movement up to the range of $ 45-50.
( weekly Chart )
In the daily chart, we can have this wave count that wave 2 has ended in the range of 140.65, and the price is forming wave iii. However, to confirm the uptrend, the price must cross the range of $ 497.10.
Personally, I’m interested in putting my investment in Light Coin (SHA256).
BITCON CASH MULTIPLE TIMEFRAME ANALYSISi really don't the bitcoin breaking the last green trend line, any entry on a crosse between price and the trend line is a good entry.

BCHUSDT formed bullish BAT | Upto 38% move expectedOn the daily chart, the price action of Bitcoin Cash has completed bullish BAT pattern, now it has entered in the potential reversal zone. There are also 100 and 200 simple moving averages supports in the potential reversal zone.
Buying And Sell Targets:
The buying and sell targets according to harmonic BAT pattern should be:
Potential reversal or buying zone: $262.77 to $248.88
Fibonacci projection or sell zone: $295.91 to $345.57
Stop Loss:
The potential reversal zone area that is up to $248.88 can be used as stop loss in case of complete candlestick closes below this level.
Possible profit and loss ratio:
As per above targets this trade has a profit possibility of 38.8% and as per the above-mentioned stop loss, the loss possibility is 6%.
Note: Above idea is for educational purpose only.

Bitcoin Cash clasped between key resistance and support
Bitcoin Cash lost the ground above $300 again following rejection at $320.
BCH/USD is stuck between the 50 SMA resistance near $300 and the 100 SMA support at $280.
Bitcoin Cash recently recovered from the Thanksgiving Day crypto crash. The losses on Thursday last week failed to embrace support at all the three moving averages; the 50 SMA, 100 SMA, and 200 SMA on the 4-hour chart. Buyer congestion at $250 saved the altcoin from diving further.
The rebound from the crucial support reclaimed the position above $300 earlier this week. However, BCH hit a wall at $320, cutting short the anticipated spike to November’s peak at $373. A correction came into the picture, pulling Bitcoin Cash into a 13% dip.
Meanwhile, BCH/USD seems to have embraced support at the 100 SMA, highlighted at $280. The price is doddering at $289 amid the push to recover the lost ground toward $300. On the upside, movement is likely to be limited at the 50 SMA, slightly under $300.
The resistance at the 50 SMA and the support at the 100 SMA might keep Bitcoin Cash in a range before a breakout comes into the picture. Trading above the 50 SMA and the hurdle at $300 will call for more buy orders as the uptrend heading to $373 and $400 is validated.
On the downside, it is essential to hold above the 100 SMA to avert looming declines back to the primary support at $250. The 200 SMA is in line to absorb some of the selling pressure, preventing BCH from diving massively towards $200.
Bitcoin Cash intraday levels
Spot rate: $288
Relative change: 0.55
Percentage change: 0.2%
Trend: Sideways trading bias
Volatility: Expanding

Bitcoin Cash - I am waiting for a two scenarios I am waiting for a false break out
I do not exclude the second scenario.
False break out or break out ??
Friends, push the like button, write a comment, and share with your mates - that would be the best THANK YOU.
P.S. I personally will open entry if the price will show it according to my strategy.
Always make your analysis before a trade

BCH/USD Retraced to the Support Level - What Is Next?In this technical analysis, I will follow-up on the previous idea on BCH now that we have finally arrived at a moment where we can enter a long position. The price retraced beautifully to the horizontal one that used to be resistance. In the bullish scenario of the S/R flip and the old resistance zone turning into new support, I expect the price to rise until the next resistance - giving us a 14% trade opportunity.
All information can be found on the chart. I tried to make it as self-explanatory as possible. In case you still have any questions, free free to leave a comment or send me a personal message.

Bitcoin cash symmetrical traingleBCH / USDT
🌟 Techincal Analysis🌟
The price was Consolidating last days and
Forming symmetrical traingle
The Higher chance it will break it up
Why ? Because
most tether coins moved recently but bitcoin cash not
If breakout upward happens iam sure we can see BCH trading in 3xx$ area easy
However break it down then we can see 220-200$ area ( strongest support )and i dont think that will happen unless btc dump (hard)
Please have a plan before trading
Good luck and happy trading 🌹

Bitcoin Cash - $BCH - Back in Business!WAVE 3 in progress! The best time to buy is now!
I'm LONG / BULLISH position. I expect that $BCHUSD will rise up.
This would mean that BITCOIN CASH will gain more value against USD.
What is the right way? Looking for relevant timeframes, with patience and planning, NO DESPERATION .
No one goes into the market thinking they should buy at the high and sell at the low. The problem is that at the moment when faced with the ups and downs of the market, it’s hard to resist the urge to do those things.
Trading is all about spotting emotional excesses either to the downside or the upside. You want to be on the right side of those emotional reactions and not the wrong.
If you want to win in this market, you need to be COLD and CALCULIST .
To the moon is too close, go beyond!!!
Well, keep you updated as this timely issue evolves.
Good luck!
#CRYPTO $BCHUSD #BCHBTC #BCH #BITCOINCASH #ALTSEASON2020
$BTC $BCH $BNB $XLM $EOS $ETH $ADA $LTC $TRX $XRP $IOTA $LINK $XTZ $BTT $XMR $NEO $BTT $MATIC $XMR $MRK $XEM $ONT $DASH $BAT $ZRX $LSK $NANO $REP
#altcoins #bitcointrading #BuyTheFear #BuyTheDip

BCH / USD Daily Price Action PlanBitcoin Cash under resistance and now moving down to possible support line.
Will it hold for 6th time?

BCH/USD LONG TERM SWING SET UPTitle: BCH/USD BUY SIGNAL
Asset : Crypto
Type : Limit Order
Time Frame : H4
Entry 1 $290
Entry 2 $270
Sl $250.00
Tp.1 $330.00
Tp.2 $400.00
Tp.3 $470.00
Tp.4 $540.00
Tp.4 $610.00
Tp.5 $680.00
Tp.6 $750.00
This week marked an important milestone for Bitcoin Cash, as last Wednesday the crypto-asset reached block height 630,000 and cut the mining reward by half to 6.25 BCH every 10 minutes. This event happens every four years or more specifically after 210,000 have been mined.
While most of the crypto news sites were talking about how this halving took almost 2 hours to be completed and how some miners left the network after this, we decided to analyze what happened on that day from a different and more data-centric perspective.
A quick summary of Bitcoin Cash:
Bitcoin Cash is a hard-forked version of the original Bitcoin Blockchain similar to Litecoin or Dash. It was created in August 2017 and the main intention was to increase the block size that would allow more transactions to be processed. Major stakeholders such as Roger Ver proposed to increase the size of blocks to 8 MB. The number of transactions on Bitcoin Cash’s blockchain can reach 25,000 per block. It also differs from Bitcoin in the fact that it does not incorporate SegWit as a solution to accommodate more transactions.
Now that we have a basic understanding of the project, let’s dig into some key data points of that day by leveraging the IntoTheBlock platform.
1. The daily addresses activity went through the roof.
On Wednesday, the same day the Halvening occurred, there was a huge spike in the number of active addresses in the Bitcoin Cash network.
A total of 161 thousand addresses were active on that day, which represents a 388% increase compared to the 33 thousand active addresses on Monday.
The number of new addresses entering the network also saw a big increase of 357% during the last 7 days as did the number of addresses leaving the network (zero balance) by 363.76%.
2.Perpetual Swaps Volume reached a 7-day high.
A quick explanation: perpetual swaps are a kind of derivative that does not have an expiration date.
Bitcoin Cash perpetual swaps volume saw a big recovery on Wednesday, reaching a 7-day high of $465.96 million. On Wednesday, the volume for perpetual swaps increased by 103% compared to the previous day.
3. The number of on-chain transactions also increased dramatically.
At IntoTheBlock we measure the number and volume of on-chain transactions in a given period. On April 8, a total of 95.85 thousand transactions and 1.62m BCH were moved. This number represents a 7-day high and a 180% increase compared to the previous day.
4.The Average Time Between Transactions was also affected
As I mentioned before, the block number 630,000 took almost two hours to be completed, and this can be reflected in the average time between on-chain transactions.
Before this occurred, the average time on the last 30-days was 10 minutes (same as the block time), but with the problem during the halving, that number increase to 26 minutes on April 9.
5. Most of the activity on Halving day came from the West.
As the number of on-chain transactions that Wednesday increased dramatically, we were able to identify that most of the activity on that day came from the East, meaning that 90.43% of the on-chain transactions during that day happened between 10:01 PM to 10:00 AM UTC. This represents quite a bit of an anomaly since the predominance of transactions from All Time was 54% in the west.
As you can see, on-chain activity combined with other factors as derivatives provides us a much deeper and insightful understanding of this asset.
While the mining activity for Bitcoin Cash was affected after the halving, other indicators tell us that Bitcoin Cash has a strong on-chain fundamental with a good community behind it.

Bitcoin Cash Price Analysis: BCH/USD Clears The Path To $400
Bitcoin Cash reclaims support above $300 as buyers build the momentum to take down the $400 resistance.
BCH/USD faces increasing selling pressure at $310 ahead of the next key hurdle at $320.
Bitcoin Cash price hit a wall at $326 in the wake of rallying prices across the cryptocurrency market. A flash drop occurred culminating in a devastating drop to $245 on August 2. BCH/USD spent most of last week nurturing a bullish trend first towards $300 and later $400.
For a period of time, the price remained pivotal at $300 with the upside limited at $320. On the downside, support had been established the 50% Fibonacci retracement level taken between the last swing high of $337.80 to a swing low of $235.01.
The 50 Simple Moving Average (SMA) has also contributed a lot in keeping the price in check as well as keeping bulls focused on sustaining gains above $300. A break above the trendline resistance during the Asian hours have seen an engulfing candle printed above $300.
Bitcoin Cash is trading at $308 at the time of writing. It is facing massive selling pressure at $310. If buyers pull above this zone, gains beyond $320 will become apparent.
Technically, the bullish case to $400 is supported by several technical levels from the RSI and the MACD. The RSI has reversed the trend upwards and currently eyes 70. In other words, the influence by the bulls continues to grow steadily.
Similarly, the MACD is likely to hold above the midline in the short term but if a bullish divergence comes into the picture, a spike to $400 will become even more apparent. For now, establishing support above $300 should be among the bulls’ highest priorities as it would encourage more buyers to enter the market, completing their mission to $400.
Bitcoin Cash Intraday Levels
Spot rate: $308
Relative change: 7.21
Percentage change: 2.41%
Trend: Bullish bias
Volatility: High

Bitcoin Cash: In-depth Breakout Analysis 1D (Jul. 26)X Force Global Analysis:
Bitcoin cash (BCH) has been showing signs of reversals through a descending wedge on a downtrend. In this analysis, we take a look at Bitcoin Cash's technical evidence to assess its bullish probabilities.
Analysis
- To begin with, we can notice extremely extended bullish divergences on the daily, as prices form lower lows and indicators form higher lows
- The Relative Strength Index (RSI) shows a steady increase over time, demonstrating increasing trend strength
- The Moving Average Convergence Divergence (MACD) also forms higher lows and higher highs as a sign of momentum
- The Stochastic indicator also contributes to the bullish divergence formation on the daily, adding weight to a bullish case
- Counting Elliott Waves within the descending bullish wedge, we can count Elliott triangle waves (ABCDE) leading to a breakout
- The Exponential Moving Average Ribbons are converging, looking to form a potential golden cross
- We have managed to close above the 0.5 Fibonacci retracement resistance, providing confirmation of a breakout
- Bitcoin cash has also managed to close above the Ichimoku cloud resistance for the first time in many weeks, signaling a potential long term trend reversal
What We Believe
We believe that the outlook on BCH is extremely bullish based on a plethora of technicals that point to the same direction. This could potentially be the beginning of a long term trend reversal.
Trade Safe.

BCH/BTC 1D Jul. 25Suggested Entry: 25215
Target 1: 26650
Target 2: 27800
Target 3: 28840
Stop Loss: 24250
The reason why Bitcoin Cash (BCH or BCHABC) is bullish despite having a similar setup to XRP is for two main reasons:
- Technical indicators support a stronger evidence for bullish momentum
- While confirmation is yet to be provided, it could be argued that BCH has broken out of the descending wedge pattern
As a descending wedge pattern in a downtrend is typically identified as a bullish reversal pattern, we suggest a long position with targets leading up to previous historical resistance levels, and a tight stop loss below significant support.
Trade safe.
