BCHUSD Has Formed Very Big Bullish Gartley Setup For Big MoveHi friends hope you are well and welcome to the new update on Bitcoin cash. In my previous post I explained why the Bitcoin cash can move down to hit the support of the wedge. At this time the price action is at the support of the wedge pattern now we will try to understand what the price action can do next.
The movement within a wedge:
Price action of Bitcoin cash is moving within a wedge on daily chart since March 2020. At this time the price action is moved down up to the support. If we watch the balance of power indicator then it can be clearly seen that the balance of power is distributed equally between the bears and bulls. I have also placed the moon phases indicator on this wedge pattern. And we can observe that the new dark moon is appeared above the support of the wedge that is very positive signal. Now it will be difficult for the price action to cross down this level of dark moon. If we watch the volume profile that I have placed on the complete priceline of BCH moving within this pattern then it can be easily observed that the trader’s interest is very low below $225 and from the upside it is very low above $255. So it is showing that the priceline is moving at the level where the trader’s interest is very weak therefore the price action can move up to the resistance from here.
Formation of bullish reversal pattern:
In previous post we have already seen that the price action of the BCH is forming the different harmonic BAT patterns with the consistency and continuity on the daily chart. First it formed a bearish BAT then it formed a bullish BAT then again price action formed a bearish BAT move as below:
now again the price action has formed another bullish BAT pattern. And at this time it is gearing up from the potential reversal zone of this new bullish BAT. This is BAT is a clear sign of a bullish reversal of the price action of BCH. Now we can expect that the priceline will be moved up to the resistance of the wedge pattern to make another attempt for the breakout.
At the support:
After the drop of March 2020 the price action bounced from the last support of $170 and broke out the next resistance level of $225. The next resistance level would be at $304. At this time the price action is moving at the support of $225 but as all signals are moving in the favor of bulls therefore this time we can expect that the price action will move up to next resistance level to make an attempt for breakout.
A very big bullish Gartley formation:
Now I would like to take you to the monthly chart where the price action has formed a very big bullish Gartley pattern. At this time the price action is moving in the potential reversal zone of this big bullish Gartley. Now as per Fibonacci sequence the potential reversal zone or buying zone and Fibonacci projection area or sell zone are as below:
Potential reversal or buying zone: $242.32 to $167.94
Fibonacci projection or sell zone: $300.84 to $441.41
After watching these targets we can expect up to 160% bullish rallyby this big bullish Gartley pattern. But if the price action will be able to cross up 0.786 Fibonacci projection of A to D leg then the Bitcoin cash can start a very big parabolic bullish move that can lead the priceline to achieve higher than the previous highest price ever in the history of Bitcoin cash.
Conclusion:
From small time period to long term time period charts all patterns and indicators are turning bullish. Therefore we can expect a bullish reversal move from here at least up to the resistance of the wedge pattern.
Note: This idea is education purpose only and not intended to be investment advice, please seek a duly licensed professional and do you own research before any investment.
Bitcoincashforecast

BCHUSD | A Downward Correction Rally Before Bullish MoveHi friends hope you are doing good and welcome to the new update of Bitcoin cash. After the strong best trend that was started from Feb to March 2020. The price action of the BCH completed the final bearish leg of bullish Shark pattern on the 4 day chart. And on 19th March I posted an idea on this move of Bitcoin cash. I predicted as per Fibonacci sequence of this bullish Shark the price action should move up and enter in the Fibonacci projection area of C to D leg from 0.382 to 0.786 Fib projection. And finally after mid of March the price action moved up and as per prediction it entered in this Fibonacci projection area. And so far it has produced more than 56% bullish rally.
Wedge formation and moon phases are giving bearish signals:
Now on the daily chart the price action of Bitcoin cash is moving in a wedge since March 2020. The Bitcoin cash has several touches at the support and the price action has also made several attempts for the breakout. But so far the BCH is not able to break out the resistance of this wedge. Here I have placed the moon phases indicator. On upside you can watch the full moon and on the downside the dark moon can be seen. The distance between one full moon to another full moon and from one dark moon to other dark moon is called synodic cycle that is 29.5 days long. Now after the completion of the recent synodic cycle we can see that the new full moon was appeared down than the previous full moon. And the new full moon is inside the wedge below the resistance. And the recent dark moon was appeared below the support and it down than the previous dark moon. So here the moon phases indicator is giving the bearish signal and indicating that the price action might be moved down from here. Moreover I've also placed bollinger bands indicator and we can see that the upper bands of the bollinger bands is below the resistance of the wedge pattern and the price action is not able to cross up the resistance of bollinger bands and can start another downward move up to the suppor. here I have also implemented the volume profile indicator on the complete price action moving within this pattern that is showing that trader’s interest is strong up to the support that is around $225. Therefore a possible move up to the support is expected. However we take a look at volume indicator then even though there is not a big volume but buying volume is being appeared with the continuity and consistently, therefore the buying volume can cancel these bearish signals.
Now if we take a look at the balance of power indicator then it can be clearly observed that the balance of power is equally distributed between the bears and bulls. On the chart there are 6 obvious downward moves and 6 openly upward moves by this indicator. And the price action is also following the moves of the balance of power. At this time this indicator has made its 6th upward move and the price action has reached at the resistance. Therefore we can expect the seventh downward move by this indicators.
Consistent formation of BATs:
Now let me show you the formation of different harmonic BATs with the continuity. On the daily chart the price action of BCH has completed the formation of third BAT pattern and it is forming these harmonic patterns consistently. Let’s dig these patterns out to watch the how perfectly they are formed:
After initial leg the A to B leg is retraced between 0.382 to 0.50 Fibonacci. And B to C leg is projected between 0.382 to 0.886 Fib projection of A to B leg. And the final leg has been retraced between 0.786 to 0.886 Fibonacci retracement level. And all these BATs has followed the same Fib sequence. Therefore after the completion of third bearish BAT pattern we can expect a downward move from here.
Simple moving averages and resistance of 200 SMA:
Now if we watch the simple moving averages with the time period of 25, 50, 100 and 200 then the price action has crossed up all the moving averages. But only 200 SMA is left to crossed up and if we take a closer look on the chart then it can be easily observed that since April 2020 the price action has made several attempts to break out this simple moving average but so far it is unsuccessful. And at this time the priceline of BCH is struggling at this 200 SMA resistance level again. However this time the priceline of Bitcoin cash has the support of 100 simple moving average, therefore if price action will be dropped from here then it may re-test the 100 simple moving average as a support before any other move to the upside.
Support and resistance levels:
I the month of Feb 2020 the price action was very strong bullish and reached very close to the key level resistance of $500 but unfortunately after reaching at $497 a strong bearish trend was started that leaded the priceline to the first support at $147. After getting bounced from this support level the priceline of BCH broke out the next resistance of $220 and re-tested the previous resistances as support and moved up to breakout the next resistance at $260. So far it is moving between these support and resistance levels between $220 and $260 and now it has formed a parallel channel between these levels. Once the price action will breakout this resistance then it can go to the next resistance at $304 and after breaking out $304 the next resistance would be at $355 and in case of breaking out this hurdle the key level resistance would be at$ 500. If the priceline will breakout $500 then it can reach the highest right ever in the history of Bitcoin cash very soon.
Ichimoku cloud and directional movement:
On the long-term weekly chart the Bitcoin cash is never able to cross up the ichimoku cloud since this cloud is appeared in the history of BCH as per coinbase exchange. We have witnessed several attempts since may 2019 to break out this cloud but unfortunately so far the price action is moving below the cloud. This time the cloud is turned very weak and the lagging span of the ichimoku is crossing up the candlesticks. This is the first bullish signal that we have received now we can wait for the conversion line to cross up the baseline. And once it will be happened then the ichimoku cloud will be turn bullish and it will be easy for the priceline to breakout this cloud and breaking out this cloud will become a very strong support for the price line of Bitcoin cash to start a very long term bullish rally.
If we take a look at directional movement indicator then positive directional indicator has crossed up the negative direction indicator. That is the bullish signal indicating that on the long-term the Bitcoin cash can started a bullish rally. Before this in April 2019 when the positive directional indicator crossed up the negative directional indicators then Bitcoin cash produced 330 % bullish rally. And after that in January 2020 when again +DI crossed up the –DI then the price action of Bitcoin cash started a bullish rally up to 138%. Now the wait is only for the ADX to move up to assign the power to the bulls.
Big bullish Gartley a firm signal for long term bullish move soon:
Now I would like to recall a very big bullish Gartley pattern that is formed on the monthly chart by the price action of Bitcoin cash. I also a posted this pattern in my previous post as well. After entering in the potential reversal zone now the price action is moving just above this PRZ level and it can start movement to the upside very soon. This bullish Gartley can be very helpful for the priceline to start a long term bullish move.
Conclusion:
On the daily chart the bearish signals are more than the bullish signals. Therefore we can expect a correction rally up to the support of the wedge that has been formed on the daily chart. But on the long-term chart the Bitcoin cash is turning very strong bullish specially after the completion of very big bullish Gartley pattern on the monthly chart. So the countdown for a very big upward move has begun.
Note: This idea is education purpose only and not intended to be investment advice, please seek a duly licensed professional and do you own research before any investment.

Will Bitcoin Cash Breakout $500 Key Level Resistance???A double top at resistance level:
Hi friends hope you are well and welcome to the new update on bitcoin cash in today's technical analysis will will try to find out the different bearish and bullish signals and patterns. First of all I would like to take you to the daily chart where we have the different support and resistance levels and if we take a look back in the month of March 2020 then we can see that after the waterfall crash the priceline has hit at the support at $147. And from this support the priceline recovered and broke out the $200 resistance again. And after breaking out the 200 resistance level it has re-tested the previous resistance as support and moved up to break out the next resistance level at $260.But here we have some critical situation cause after a hard attempt for breakout in April 2020 the priceline dropped down again and moved up to re-attempt for the breakout from $260 resistance level. But again the price action is dropping down. So if this drop will be continued then we will have a double bottom formation that can produce more strong bearish rally to the downside.
The priceline is being rejected by the SMAs:
Now if we take a look at the different simple moving averages with the time petiod of 25, 50, 100 and 200 on the same daily chart then it can be easily observed that first priceline broke out the 25 and 50 simple moving averages but when the price action attempted to break out the 200 simple moving average then it is rejected by the 200 SMA. The 200 SMA is almost at the same level where we have the $260 priceline resistance. So the priceline is being rejected at the same time by the $260 priceline resistance level and the 200 simple moving average resistance level as wel. And the Bitcoin cash is forming a double top formation on the chart of the moving averages as wel. Now it can be easy for the price action of Bitcoin cash to break down the 25 and 50 simple moving average supports. Because the pressure from the upside is stronger than the pressure from the downside. As we have bigger moving averages above the price action and those are 100 in 200 SMAs and smaller moving averages below the priceline and those are 25 and 50 simple moving averages.
Priceline could not reach the resistance of up channel:
The BCH has also formed an up channel on the daily chart but this time the Bitcoin cash could not reach up to the resistance of this up channel. If the price action will break down the support of 25 and 50 simple moving averages then it can also break down the support of this channel as well . Because we have the 25 simple moving average at the same level where we have the support of this up channel and in case of breaking down the support of the channel the priceline can easily reach at the support of $200.
The bullish harmonic move on long term chart:
Now I would like to take you to the very long term monthly chart and here we have a very positive move by the price action of Bitcoin cash. And that is the priceline of BCH has formed a very big bullish gartley pattern same as like the Bitcoin has formed on the monthly chart. Even though the price action has spiked beyond the support of the potential reversal zone of this pattern. But within very next cande stick it has been retraced back in the potential reversal zone. Therefore we can ignore the extra spike.
Here I would like to recall a bullish shark harmonic move of the Bitcoin cash that I posted on the 19th of March 2020 in my previous article. This was the pattern that helped the priceline to re-enter in the potential reversal zone of the big bullish Gartley pattern that has been formed on the monthly chart. As we can see that after entering in the buying zone of the bullish shark pattern on the 4 day chart the BCH took a powerful bullish divergence that produced more than 102 percent profit. Now from the buying zone of the bullish Gartley pattern we can expect up to 163% profit spike. So if you want to take it as a single trade then you can buy it within the potential reversal zone of this big gartley pattern and sell it within the Fibonacci projection or sell area as I have defined on the chart but in this case you should make your stop-loss the potential reversal zone that is up to $168.
But if you want to hold it for the long term then you need to watch out for the breakout from the different resistance levels as we have discussed on the short-term daily chart. And if you are looking for that Bitcoincash achieve the highest price ever in its history then we need to watch out for the breakout from $500 resistance level. That is the strongest key level resistance for the Bitcoin cash.
Bullish Shark on 4 day chart:
Ichimoku cloud:
Now I would like to take you to the weekly chart where long term bullish signal can be appeared in the future by the ichimoku cloud. As we can see that so far the price action of Bitcoin cash is not able to cross up the ichimoku bearish cloud. Once in the month of February 2020 the price action crossed up this cloud but during re-testing the cloud resistance as a support it was filled and drop down again. Once the priceline of Bitcoin cash will be able to cross up the ichi moku cloud successfully then the Bitcoin cash can turn bullish on the long-term for the next 2 or 3 years.
Conclusion:
If the price action will be not able to break out the next resistance levels on the daily time period chart. then we can witness further downside rally. But on the long-term the Bitcoin cash has formed is very big bullish patterns therefore on the long-term it is bullish.
Note: This idea is education purpose only and not intended to be investment advise, please seek a duly licensed professional and do you own research before any investment.

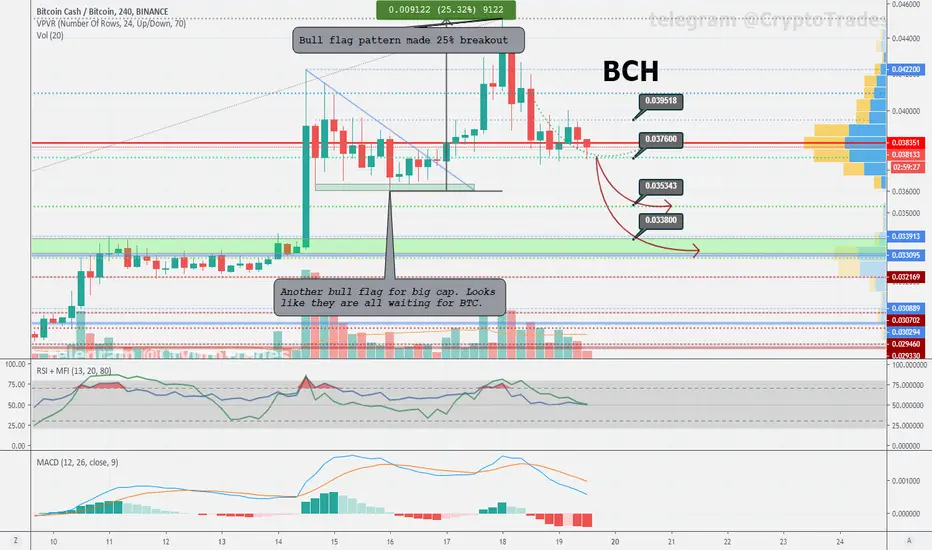
Bitcoin Cash: Descending Channel Consolidation 4H (Apr.23)X FORCE GLOBAL ANALYSIS:
In this analysis, we take a look at the technicals demonstrated in the chart of Bitcoin Cash (BCHABC)
Bullish Evidence
- Previously, we have seen parabolic breakouts for Bitcoin Cash after consolidation phases
- It could be said that we are currently consolidating within a downwards parallel trend
- This could turn out to be a textbook bullflag pattern
- We are still above the 0.236 Fibonacci Support
- The Relative Strength Index (RSI) shows higher lows
Bearish Evidence
- We are in a downtrend, creating techincal lower highs and lower lows
- We have broken down from the 0.5 Fibonacci resistance, the 0.382 Fibonacci resistance, and now possibly the 0.236 Fibonacci resistance
- The RSI also shows lower highs
- The Moving Average Convergence Divergence (MACD) demonstrates mixed signals and a lack of momentum to drive a bullish breakout
What We Believe
We believe that Bitcoin Cash will continue its bullish rally only given that it breaks through and closes above the descending parallel channel trend line resistance.
Trade Safe.

BCH - OVERBOUGHTBitcoin Cash (BCH) broke out of $250 on April 6, which caused our purchase proposed in an in advance analysis. Today, the bulls scaled the fee above the 50-day SMA ($266) but are struggling to maintain on to the intraday gains.
This indicates that the bears are lively at higher levels. If the BCH/USD pair dips back beneath the 20-day EMA ($236), a drop to $two hundred is possible. Below this level, the pair will flip negative. Therefore, the traders can hold the stop loss on the lengthy positions at $197.
Conversely, if the pair surges above $281, a rally to $350 is likely. Therefore, the buyers can path the forestall loss to $220 after BCH sustains above $281 for four hours.

Bitcoin Cash Is Forming Bullish BAT For Upto 24% Profit SoonFormation of harmonic bullish BAT pattern:
The Bitcoin Cash with Bitcoin pair is forming a harmonic bullish BAT pattern and soon it will be entered in potential reversal zone to give chance to earn more gains.
Let’s dig the pattern deeper to see how perfect it has been formed.
After initial leg (X to A) the A to B leg is retraced between 0.382 to 0.50 Fibonacci and then B to C leg is projected between 0.328 to 0.886 Fib of A to B Fibonacci projection area now the last leg (C to D) should be retraced between 0.786 to 0.886 Fibonacci level.
Buying And Sell Targets:
The buying and sell targets according to harmonic BAT pattern and its Fibonacci sequence should be:
Buy between: 0.0296 to 0.0286
Sell between: 0.0320 to 0.0356
So this short term 12 hour chart based idea has capacity to produce upto 24% profit.
Stop Loss:
The potential reversal zone area that is up to 0.028646 sats can be used as stop loss in case of complete candle stick opens and closes below this level.
Note: This idea is education purpose only and not intended to be investment advise, please seek a duly licensed professional and do you own research before any investment.

BCH | After Being Rejected By $501 Getting Ready For Next MoveBounced Back From Key Level Resistance $501:
Hi friends welcome to the new update on Bitcoincash. Guys if you remember I posted an article on 2nd Feb 2020 where I told you that the BCH is going to hit its key level resistance at $501 at that time the price of Bitcoin cash was $378 and then it moved up to $497.53 that was very close to resistance level as I predicted in my previous post. And as I have been telling you that this is the key level resistance for the Bitcoin cash as the Bitcoin cash is not able to break out this resistance level since November 2018 once this resistance level will be broken out then Bitcoin cash can start more stronger rally towards achievement of the highest price in the history of Bitcoin cash for which many traders are waiting.
But unfortunately this time again the priceline of Bitcoincash is pushed down by the resistance of $501 in very powerful manner that this time price action even broke down the previous support of $355 and after breaking down this support the Bitcoincash moved back to the next support at $304 again.
At this support level the price action started consolidation and now it is likely to move up again towards the resistance level of $355. Here we also have 100 simple moving average support just beneath the 304 dollar support.
Simple Moving Averages Are In Good Order:
If we see the simple moving averages with the time period of 25, 50, 100, and 200 then sofar they are in good order the 25 simple moving average is above all other moving averages then just below 25 moving average we have 50 moving average after that we have 100 moving average and 200 SMA is just below all these moving averages. Sofar no moving average has formed any death cross with other moving averages. At this time we can see the 25 moving average is showing the tendency to move down to form a death cross with 50 moving average. But this death cross cannot produce the pressure that can lead to breakdown the support.
If we place the Fibonacci retracement to from the recent lowest price of $170 up to recent high of $497.53 then we can examine that the price action is retraced up to the golden ratio of Fibonacci level that is 0.618 Fibonacci then it is likely to up from here.The 100 simple moving average is also playing is very important role here as it is just below this golden ratio of 0.618 Fibonacci level to provide a strong support to priceline of Bitcoin cash.
Oscillators And Indicators Are Turning Bullish:
If we see some other oscillators and indicators then we can observe that on daily chart all oscillators and indicators are also turning bullish. For example the price action is getting bounced from the lower bands of bollinger bands and Reletive strength inex (RSI) has already visited the oversold zone and turned bullish now. If we see the stochastic then it can be clearly seen that the stochastic has given bull cross from the oversold zone and moving average convergence divergence indicator (MACD) was strong bearish but now it has also given weak bearish signal and that is also another bullish sign.
We Need The Priceline To Cross Up The Exponential Moving Averages To Back In Rally:
On 2 day chart above exponential moving averages with the time period of 10 and 20 we can see that price action was moving above these EMAs from January 7th up to 18th Feb 2020. But now the priceline has crossed down these eponential moving averages and both EMAs have formed bear cross now it is really very important for the Bitcoin cash to cross up these moving averages again in order back in bullish rally.
A Bullish Harmonic Pattern Is Always Helpful To Move The Priceline Back To Bullish Trend:
Here a very strong bullish continuation signal is appeared and that is the formation of bullish Cypher pattern let's dig this pattern deeper and see how perfect this pattern is formed. Initial leg was started from 25 December 2019 up to 17th of January 2020 then B leg is retraced between 0.382 to 0.618 Fibonacci. Then priceline started B to C leg and projected up to 1.414 Fibonacci projection of A to B leg. Then C leg is retraced between 0.618 0.786 Fibonacci. And this is the Fibonacci projection of X to C leg here formation of bullish cypher pattern is completed and the priceline is moving up. Guys this pattern can be great help for price action of Bitcoin cash to break out $355 resistance.
Ichimoku Cloud Turned More Bullish:
In my previous article we have seen that the ichimoku cloud was turned bullish up to 4 days chart. But now it has turned bullish up to 1 week chart. After crossing up the cloud now the candlesticks are retesting the bearish cloud as support. The lagging span is above the price action and did not cross down the priceline but once it will cross down the priceline then we can see e a bearish trend.
Here I have placed the chop zone indicator and we can see that the chop zone is turned weak bullish before that is was strong bullish from 13th of January upto 24th of February but this week it has turned weak bullish. We need to observe this indicators for next couple of days if it will be turned bullish again then candle sticks with lagging span and conversion and base lines cross up the cloud and then we can see the ichimoku even more bullish.
But if this chop zone will be turned bearish from here then the BCH can face bearish trend.

BCHBTC Has Formed Bullish Shark | Upto 20% Bullish MoveBitcoin cash is the world largest digital asset ranked at 4th position as per coinmarketcap data.
This digital asset is one of my favorite crytpocurrencies that gives us trading opportunities on daily basis.
From December 28th to 18th February 2020 this cryptocurrency this cryptocurrency was being traded above the exponential moving average 21 but at this time this coin is being traded below the EMA 21 but likely to cross up this exponential moving average soon we have a second green candlestick with heiken Ashi setup having spikes beyond 21 exponential moving average.
The Formation Of Shark:
This time on 12 hour chart the Bitcoin cash with Bitcoin pair has formed a bullish shark pattern and entered in the potential reversal zone of this pattern.
Let's dig this pattern deeper to examine how perfect this bullish Shark harmonic pattern is formed.
The initial leg was started on 31st of January and completed on 7th of February 2020 then the price action has been retraced between 0.382 to 0.618 Fibonacci levels and that is as required for a perfect bullish Shark pattern’s A to B leg and after the completion of A to B leg the priceline is projected between 1.13 up to 1.618 Fibonacci projection of A to B leg and completed the B to C leg of this bullish Shark pattern. Then finally the C to D leg is retraced between 0.886 to 1.13 Fibonacci level and at this time the price action is floating in the potential reversal zone of this bullish pattern and ready to move up at any time.
The Targets:
The buying and sell targets according to harmonic BAT pattern should be:
Buy between: 0.040225 to 0.038417 sats
Sell between: 0.042242 to 0.046270 sats
Stop Loss:
The potential reversal zone of this pattern can be used as stop loss in case of complete price action closes below this level.
This is short term trading idea not a long term idea; I will be keep posting more trading ideas as soon as I will find more.

BCHUSD Possible Short Term TopPossible top point, don't try and pick tops and bottoms when entering exited a trade, exit when happy with profit, enter when price is 'cheap' for you.

Bitcoin Cash A Journey From $77 to $501In my previous post we finally witnessed that the Bitcoin Cash had broken out the resistance of the pennant and produced more than 43% profit in 1st rally:
In previous article the exponential moving average 10 had formed bull cross with exponential moving average 20 up to 3 day chart but now this bull cross is reflected upto week chart which is really a very strong bullish indication and we are seeing this bull cross 1st time since after May 2019:
Previously the ichimoku cloud was turned bullish upto 1 day chart but now it has turned bullish upto 4 day chart and this time lagging span has crossed up the bullish cloud with bull cross formation between conversion line and base line, and candle sticks likely to cross up the cloud very soon.
Previously the MACD upto 1 week chart was weak bearish and stochastic had given bull cross but now upto 3 weeks chart the MACD has turned strong bullish and Stochastic has given bull cross 1st time since after 19 Mar 2019.
In Oct 2019 I posted an idea on tradingview where I predicted that the Bitcoin Cash has formed Gartley pattern and it can move upto 133% from the potential reversal zone of this gartley pattern now you can see the price action has taken powerful bullish divergence and so far it has produced more than 110% profit.
But if the candle sticks will be closed above 133% level which is the 0.786 Foibonacci projection of A to D leg of this Gartley pattern then we can witness more powerful bull rally which can lead to break out from the key level resistance at $501.
In may 2019 the simple moving averages 200SMA, 100SMA, 50SMA and 25SMA on day chart formed a complete opened alligator mouth which leaded the price action from 76 dollar to 517 dollars.
Now the these simple moving averages are likely to form same alligator's mouth very soon.
Now lets move to previous post again as we have already seen that we have 3 resistance levels one above another.
1st Resistance at: $304.48
2nd Resistance at: $355.43
3rd and Key level Resistance at: $501
Now lets have a look at price action move from $170 up til now since I am posting the predictions of Bitcoin Cash. 1st the price action broke the 1st resistance at $304.48 and then moved down and retested this resistance as support now in next rally the price action has broke out the 2nd resistance level at $355.43 and now the candle sticks are consolidating and likely to make a same move of price correction again and soon the priceline will retest the previous resistance of $355.43 as support and in case of successful retest the price action will take the bullish divergence and may hit the 3rd and key level resistance at $501 and this one will be approximately 40% bullish move and we will be up by 194% from $170, and if the $501 resistance will be broken out then we can see a massive powerful bull rally.
Sofar my stop loss is still $304.48 that is the 1st resistance and now working as a very strong support specially after successful retest.
Regards,
Atif Akbar (moon333)

Scam coin fallingBitcoin Cash retracing to 353 or lower to 335. Both strong support zones and Fibonacci retracement levels, so good to buy there and go long.
Currently at 376 support which is 0.618 Fibonacci. If price will manage to stay above that will be very bullish. At least BCH may bounce to 410 - there it will form potential right shoulder of H&S pattern, and finally dump =)
BCH (Y20.P1.E11).Macro.SummaryHi All,
Rumors\News:
> Looking at the news media, it seems many people are baffled\perplexed as they have no answer to the recent ALT markets performance;
> Some think its the whales playing games;
> My thoughts, be careful as I did that in the last year bull trend and I got caught with some coins that stopped performing and in actual fact started to go down.
So if your going to do it, its better to not go greedy, have a target and get out;
Thoughts and observations:
** On the daily chart **
> Candlesticks > Main candle closed at the main resistance with a relative big wick and a Evening star\Bearish Harami. BEARISH sentiment. It would be interesting to see how the next few days candles close.
> RSI curving > We had a slight BEARISH Divergence. Also hitting over 80% at its peak.
> MA\EMA > I have the Daily 377 SMA acting as resistance, just like BTC and the 200 MA as support
> and we broke out of the downward channel which the top can be tested as well. Since I'm bullish, I think the next test will be the daily 200 MA, likely, if the price drops further.
> MACD looking strong bullish with a possible tint of curve downwards coming.
> 4 HRLY chart, support broken
> DAILY Chart trend
Top trend line established as per chart and possibly the 377 MA could be the upper line trend for some time. Why? the bottom tend line might be tested first.
Assuming the bottom is in, we have the bottom trend line which helps define the potential price range for the coming weeks\months.
> Summary
Price to drop to major support for the next rally. The 1st target has confluence with the 200 daily MA and potentially the second is a per chart, green bar.
DAILY Charts
4 HRLY chart
Support broken

BCHUSD likely to hit the key level resistance at $501In my previous post I depicted that After taking a powerful bullish divergence in Dec 2018 the price action made upto 608% big move after that the priceline of Bitcoin Cash was going through the price correction period since Jun 2019 Upto Dec 2019 and the most lowest point has hit the 0.786 Fibonacci projection from lowest to highest point, and in the meanwhile the price action had formed a pennant and we were waiting for the bullish divergence which could lead the price action of BCH to breakout the pennant’s resistance.
www.tradingview.com
Now finally we can see that the Bitcoin cash has broken out the resistance of the pennant. So far it this bullish move has produced more than 43% profit but the game is not over coz the indicators and oscillators are still turning bullish.
In previous article we were waiting for exponential moving 10 to form a bull cross with EMA 20 on day chart but now the bull cross is reflected upto 3 day chart and both moving averages has crossed down the priceline and lifting the price action up.
Previously the ichimoku cloud was turned bullish upto 4hr short term chart but now it has turned bullish upto day chart and lagging span has crossed up candles and cloud both and candle sticks has crossed up the cloud with strong bullish rally which is a very strong bullish sign for the future as well.
And before we had bull cross from stochastic on day chart and MACD was turned strong bullish now we have stochastic bull cross upto week chart and moving average convergence divergence is turned weak bearish from strong bearish and turning bullish upto week chart.
On 2 day chart the price action had formed bullish Shark as below:
And now after taking the powerful bullish divergence the price action has hit the Fibonacci projection area of C to D leg and entered in sell zone of mid term trading setup a to watch it you can play the above idea.
Now we have a resistance at $304.48 once the price action will able to cross up the 0.786 Fibonacci projection of C to D leg the definitely the price action will hit at this resistance and if the pricline will be able to breakout this resistance the it will move to hit the next resistance level at $355.43 and this move can be rapid after this resistance we have key level resistance of Bitcoin Cash which is at $501which is not broken since Nov 2018 once it will be broken then a new bull rally will be started.
Moreover the Gartley pattern on week chart is also on the play to give more bullish power to price action as we are in the potential reversal zone of this big bullish Gartley pattern.
Soon I will post more updates with the further developments in the price action of BCH.
Moreover I have shared tradingview link below where you can find my all trading ideas on different assets and I have also shared Binance exchanges link with some other useful links coz Binance has largest volume of every cryptocurrency with minimum trading constraints.
Regards,
Atif Akbar (moon333)

BCHUSD Has Completed The Bullish Setup For Upto 163% GainsThe price correction and formation of pennant:
After taking a powerful bullish divergence in Dec 2018 the price action made upto 608% big move after that the price action is going through the price correction period since Jun 2019 Upto Dec 2019.
Now the price action is hitting 0.786 Fibonacci projection of lowest point of Dec 2018 to highest point of Jun 2019.
With the price correction the price action has also formed a pennant with four touches at the support of the pennant, this time the priceline has hit the spike beyond the lowest band of Bollinger bands and hit the support of the pennant and like to have a bounce form this point.
The moving averages:
If we see the moving averages then on day chart the exponential moving average 10 is likely to form a golden cross with exponential moving average 20 like it formed in Oct 2019, at this time the EMA 10 is crossing down the price action to lift it up then it might form a golden cross with EMA 20.
It will be 1st golden cross of above said exponential moving averages since after death cross which was formed on 17 Nov 2019 but this time the price action has already hit the support of pennant therefore this time we can have more powerful bullish divergence than the previous move Oct 2019.
The true cloud reversal:
On 4hr after 12 Nov 2019 the ichimoku cloud is proper reversed to bullish 1st time after 12 Nov 2019 when it was turned bearish during this time period the cloud was reversed to bullish on 3 Dec but that was clearly false reversal coz at that time the lagging span was failed to cross up the priceline and conversion line was also not able to proper cross up the base line but this time we can see very clear the lagging span has proper crossed up the candle sticks and conversion line has also crossed up the base line in very obvious manner and the cloud is also turned bullish therefore this time the cloud reversal is likely to be very true.
Oscillators:
The Relative strength index (RSI) was oversold and now it has turned strong bullish on the other hand if we see the stochastic RSI then it was also oversold and now turned strong bullish by giving bull cross from oversold zone and the moving average convergence divergence (MACD) has also given strong bullish signals by giving bull cross.
The harmonic move and Volume profile:
The price action of Bitcoin Cash has also formed a Gartley pattern which was started since Dec 2018.
After initial leg (X to A) the A to B leg is retraced almost upto 0.618 Fibonacci (there is slight difference of 0.027 Fibonacci but all legs are driven perfectly as required for bullish Gartley therefore I have ignored this slight difference and considering it upto 0.618 Fibonacci levels), then B to C leg is projected between 0.382 to 0.886 Fibonacci projection of A to B leg and finally the C to D leg is retraced between 0.618 to 0.786 Fibonacci level and here the Gartley is completed and from this are the potential reversal zone starts.
Now the price action is expected to take bullish divergence between 0.382 to 0.786 Fibonacci projection of A to D leg as it has already projected and again entered in potential reversal zone but the price line may take another bullish divergence to hit the sell zone as if we see the Volume profile of complete pattern then it is still showing very less interest of traders below this potential reversal zone of Gartley pattern.
So according to this pattern we can set our targets as below:
Buy between: 243.03 to 168.34
Sell between: 301.81 to 443.66
So this time the Bitcoin Cash's move has potential to give upto 163% gains, however our stop loss point would be the base of this potential reversal zone in case of complete candle sticks closes below this support level.
Regards,
Atif Akbar (moon333)

BCH Bull Trend Is ComingAfter a long bearish market, we can now clearly see a bullish divergence has been formed by all 3 oscillators. I suppose the price is going to significantly gain within the next 30 days, although you should do your own research as to how much the price will retrace.
Remember, the Bull Trend Is Coming.

Bitcoin cash perfect touchesPracticing sketching fractals. Perfect touches along the down trend line, looking to find a bottom.


BITCOIN CASH - Technical Analysis - 37.4%-518% Profit ExpectedBITCOIN CASH - BCHABCUSD - Technical Analysis - 37.4%-518% Profit Expected
Big Move Coming Up ... 5x Gains Expected.
Based on AB=CD pattern , Time Ratio & Gann Analysis, It's a potential long position with great returns :)
In a lower time-frame (4hrs) this long position has also been confirmed.
Target Profit Range - 158 - 448
(37.4%-518% Profit Expected)
TP - 1 - 158
TP - 2 - 211
TP - 3 - 265
TP - 4 - 325
TP - 5 - 385
TP - 6 - 448
Buying Zone! Long Position
Early Entry Trigger Point - $100-$115
Ideal Entry Trigger Point - $65 - $80
Adjust your Stop Loss according to your lot size,
account equity, strategy & money management.
***If you want to get in this trade from this point 214 you can still make 23.83% profit till TP3 is reached, however, there is a very high probability that price may continue to move down towards my ideal entry point., It is recommended to enter with a smaller lot size if you want to go long right away & manage your stop loss accordingly.
Good Luck.!
Disclaimer - This is not financial advice. This is my personal view and analysis of this chart.
If you follow this idea please plan your trade according to your lot size and account equity.
Don't forget to like, comment & follow , If you agree with my analysis :)

**Bitcoin Cash: Long in the Long-Term**Hi, Traders ! Monfex is at your service !
Bitcoin Cash posts higher gains as it continues to spread adaption and development globally.
* Bitcoin Cash (BCH) adoption, development, and participation continue to expand as more and more positive BCH-related announcements grows up.
* In addition to that, there is currently over 18 million BCH coins in circulation and only three million coins left to mine.
* Technically, BCH has found the strongest Support near the round $200 level and now shows very promising signs of recovery.
* Overall, we expect a robust growth of BCH to at least $270 as the price has settled down and the new bullish cycle is likely to start off.
* RSI & MACD support the bullish idea with RSI showing flat divergence at the Support level, while MACD continues expanding into the positive territory.
Active trade signal
Buy up to $230 now.
Buy to average out @ $210 in case of a further decline.
1st Target: $270.
Stop-loss: $199.
Watch for our Updates to get real-time superior signals!
GOOD LUCK AND LOTS OF PROFITS !!
Disclaimer
This report is for information purposes only and should not be considered a solicitation to buy or sell any cryptocurrency or cryptocurrency product. Monfex accepts no responsibility for any consequences resulting from the use of this material. Any person acting on this trade idea does so entirely at their own risk.

BCH (Prj.2019.P02.E01).MACRO.Level.H&SAs per Peter Brandt's tweet, and this chart, we see a Head and Shoulders formation. The target is $127.
My thoughts:
> One would expect at least 1 other level of consolidation on the way down before hitting the final target, as per the chart
> The 2x HULL moving average along with the Daily RSI chart, gives us an overview with the price movement and corresponding key indicators as to what's next
a) The reversal at the top was noted along with the cross over of the 2x Hull MA.
b) Anything below the 52.21 RSI on the Daily is viewed as a bearish trend and hence if the 2x Hull lines cross over along with the RSI crossing the 52% RSI, will give some sort of extra confirmation to go long
c) Fib. Fan along with noted support and resistance lines will also help identify when to go long.
d) Expecting a bounce around $172 price level for a short
Closeup view on the daily

BCHUSD formed Gartley | Upto 133% expectedPriceline of Bitcoin Cash / Bitcoin cryptocurrency has formed a bullish Gartley pattern and entered in potential reversal zone.
This PRZ area should be used as stop loss in case of complete candle stick closes below this zone.
Price action is getting bounced from bollinger bands support.
Volume profile is showing less interest of traders at PRZ level but MACD is strong bearish and Stochastic is oversold and in bear cross so for secure trade we can wait for MACD to turn weak bearish or for stochastic to give bull cross then buy from the potential reversal zone.
I have used Fibonacci sequence to set the targets:
Buy between: 261.41 to 192.04
Sell between: 317.16 to 448.29
Regards,
Atif Akbar (moon333)

BCHABCBTC forming bullish Shark | A good long opportunity aheadThe priceline of Bitcoin Cash / Bitcoin cryptocurrency is forming harmonic bullish Shark pattern and soon it will be entered in potential reversal zone to hit the sell targets soon insha Allah.
This PRZ area should be used as stop loss point in case of complete candle stick closes below this zone.
Volume profile is showing less interest of traders here, but Stochastic is oversold and did not give bull cross and MACD is strong bearish so for secure trade we can wait for MACD to turn weak bearish or for stochastic to give bull cross then buy.
I have used Fibonacci sequence to set the targets:
Buy between: 0.026831 to 0.026414
Sell between: 0.027202 to 0.028036
Regards,
Atif Akbar (moon333)

Bitcoin Cash Analysis: Bears Have Come to Crash The Party!Conclusion for today's Bitcoin Cash analysis: A close below ~264.21 implies lower prices in Bitcoin Cash.
Bitcoin cash analysis for today is carried out using a log scale on the Daily timeframe. Chart inspection and analysis primarily focuses on the uptrend in Bitcoin cash since price reached a bottom of 73.50 on December 15, 2018. A bullish trendline is plotted to highlight bullish momentum that followed the December price low, as well as the 200 moving average and 50 moving average to present the trading bias favored in this Bitcoin Cash analysis.
Price reached a peak of 483.77 on June 25, 2019, followed by a sell off and consolidation. The 50 Day moving average successfully crossed below the 200 moving average, implying a bearish bias in Bitcoin Cash.
Also adding to the bearish analysis is a break below the bullish trendline that has lasted over 8 months. 264.21 is marked as a key price level to watch in Bitcoin cash as a close below would add to the two previous evidences for more downside.
A close above ~335.12 would be required to relief Bitcoin Cash for further pressure to the downside.
