Bitcoincashforecast

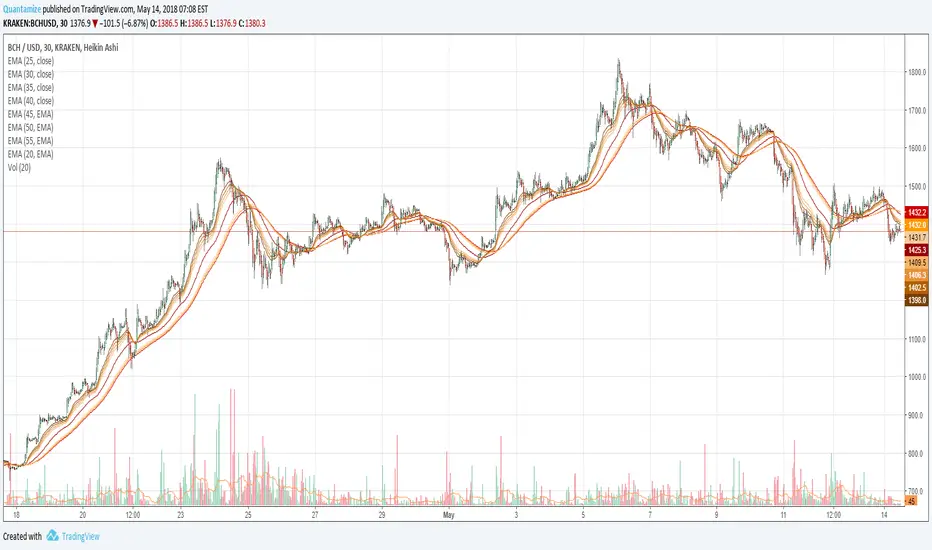
Bitcoin Cash needs to break supply zone to get going! Bitcoin Cash seems to be having trouble at this supply zone and EMAs are starting to roll over. If we don't get a bounce back above soon, we could see lower prices in the range of $465.
Check chart for annotations!
Thanks guys

Bitcoin Cash hype dying down! Bitcoin Cash has broken below the trendline and is now finding it as resistance sitting on important support. A breakdown from this level could see us revisit the $500 level quickly with the overall target set near $460 on a Bitcoin collapse back down to $6200.
MACD continues to trend lower while RSI broke below support but is heading back up to restest the breakout, which could end up being the ideal spot where price could head back lower and RSI return to the bottom for the range.
A possible short trade would be to wait for the demand zone to break then take a short position on a retest and fail to break back above the S/R flip zone. Stops would be set above the retest of the trendline SFP and targets are outlined on the chart.
Thanks guys

BCH-Rock-n-Roll-Wave Analysis-Extending 5thBITFINEX:BCHUSD is ready to rock-n-roll.
This is a trade for the extending 5th wave. The main trading method that I apply is Elliot Wave Theory with some indicators for confirmation.
I did extensive analysis in the related idea BITFINEX:BCHUSD -BREAKOUT-EXTENDING 5TH).
Review:
We have completed Waves 1, 2, 3, and 4 (ending).
Wave 3 Extended over 700% of Wave 1. After Wave 3, a rare expanding diagonal triangle formed which according to Elliot suggest that Wave 5 will extend as well. This could be a rare Wave where there are two extended impulse waves. Don't forget that we already completed higher degree waves 1 & 2 (Cycle Waves). Also, it is impossible to know exactly where the terminal point of a extending wave will end. But, we will try our best to figure that out because there is just as much money to be made in corrections.
Let's review the charts:
We have a Micro-Wave ready to fly...
Key target: 1.618 ($562)
Anticipated Terminal 5th Wave Target: $760-$725
Turn up the music!
Will update.
-AB

BCH - Could the run be over? Bitcoin Cash has been sitting on top of this very strong support level for over a week now and could potentially still break up higher into the supply zone above but we are seeing some bearish divergence developing. Price is currently just slightly above the 50%FIB level and needs to start moving upwards towards the top of the trendline to continue this uptrend.
MACD is still nose-diving towards the center line while the Histo is hinting at higher lows while RSI has developed bearish divergence with price, which unless we can get a higher low forming within the next few hours with a price move up could spell further downside for BCH. The short and long targets have been outlined and could take a few attempts to achieve them but they are the main support/resistance levels that we can look for if the price does break out on either side.
Bitcoin price will most likely dictate any movements at the moment so keeping a close eye there is very important.
Thanks guys!

BCH - Support must HOLD! BCH has returned to the S/R flip breakout area to retest and has so bounced right above it on the 50%FIB level. We need to see a dip into this zone hold for any hope of move upside momentum but those odds might be getting slimmer by the hour.
RSI seems to have topped out, hitting resistance and turning over at the moment while MACD hit its top and is about to crossover bearish. This is also confirmed by the histo about to turn negative again, therefore waiting for this next test is crucial. This trade setup was not executed and has been canceled as we wait and see what the next few hours bring.
Thanks guys!

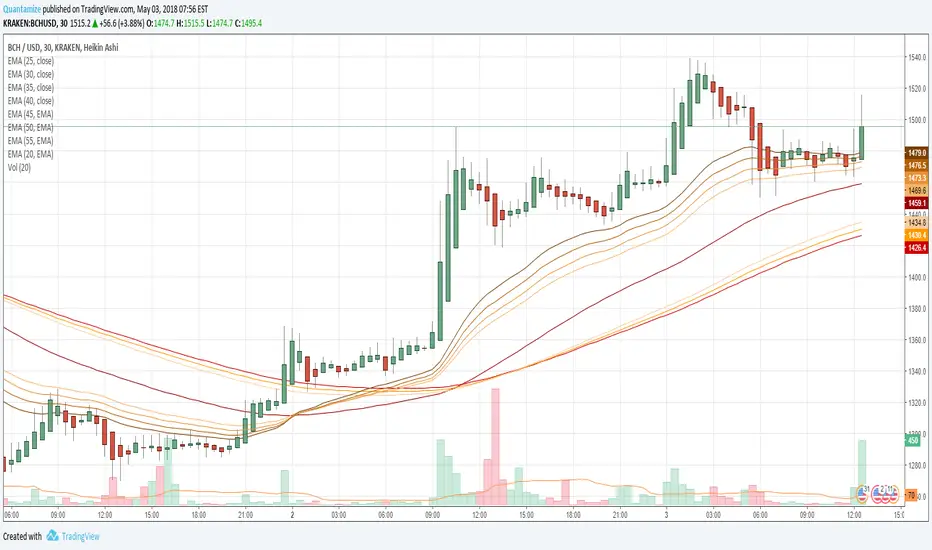
BCH - Time to cool off or do we have another leg up?BCH has been on fire since yesterday and we are currently right up against resistance trying to break above. We have found support around the 61.8%FIB level and are trying to break higher but Bitcoin is having trouble breaking out itself.
RSI seems to be topping off here and moving sideways while MACD is starting to push up into resistance but might have some juice left for another leg up. A safer play would be to wait for a retest of the breakout level around $530 and see it hold to play a long scalp position, however Bitcoin will dictate as always the price action of the entire market so any weakness in BTC should be taken seriously when trading altcoins.
Thanks guys!

BCH - On the move in STYLE!! BCH has been on FIRE today with a strong move off its demand zone around $435 yesterday with substantial volume relative to past few weeks. It has currently moved to its 50%FIB level and currently finding resistance there creating an SFP at the moment. We could very well see a pullback as the RSI is hitting resistance at the top demarcation line and might need to cool off a little before giving it another go.
Bitcoin needs to break out of its current level to allow altcoins to continue this move higher so any pullback with BTC strength could provide a nice long trade.
Thanks guys!


BCH - $500 too strong....for nowBCH broke the trendline with decent volume yesterday, moving with the rest of the market but has yet again found it hard to break that $500 psychological barrier on its second attempt. I think it will take a leg higher in BTC for it to muster the strength pierce that supply area before moving quickly to $530 as RSI seems to be turning over right now, which mirrors our outlook on a pullback right now.
BTC is the driver, even though some are saying XRP is driving the market at the moment. Don't get confused, Bitcoin will dictate where we go next and everything is looking very hot right now so be smart and patient! You're better off waiting for a pullback where the S/R flip occurred near the demand zone than doing anything here.
Thanks guys!

BCH / USD#BitcoinCash
I think the latest support will be strong and the likelihood of maintaining it is great
So what do you think?

Bitcoin Cash bullish bias: 1 hour timeframe wave analysisThe 1 hour timeframe of Bitcoin Cash (BCHUSD) is labeled in this analysis with price swing from June 28, 2018 to July 18, 2018 identified as a regular flat (3 wave) Elliott wave structure. This is currently followed by further correction as labeled on the chart, which implies a higher price for Bitcoin Cash (BCHUSD).
Correction that originated from July 18, 2018 downwards is expected to find support within the region of the horizontal blue lines indicated on the chart (i.e. 749.30 and 700.0). These are the 100% and 138.2% retracement of wave a by wave c respectively.
The arrow indicated on the chart shows the trajectory for price if Bitcoin Cash finds support in the region mentioned above.
Target for the trade is placed between ~984.60 and 1009.70 at which point Bitcoin Cash is expected to encounter resistance.
Point of invalidation (POI) of this analysis is a price close below ~669.60 at which point the assumed wave c would have retraced 161.8% of wave a.

Bitcoin Cash, will it live up to its father? (A Re-examination)Okay, So I have had so choppy really bad analysis, and sometimes I do not give an idea the time in analysis that it deserves, and since I botched my analysis first of Bitcoin Cash I decided to take a step away, and re-examine it later and check out what I discovered! Bitcoin Cash might be on the verge of an absolute explosion in price.
My Analysis:
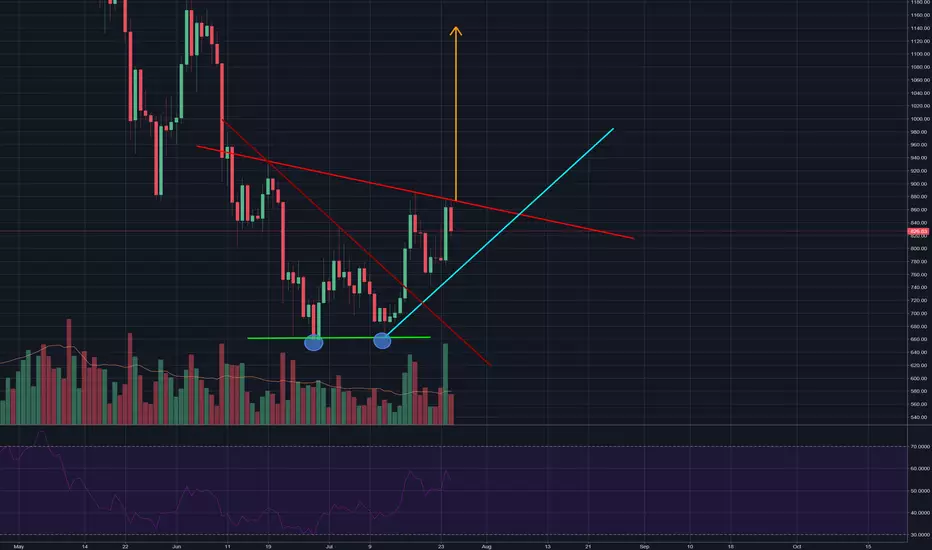
During my first analysis, I saw an inverse head and shoulder, it's neckline is the darker reds, while, it appears to me that there could be another inverse head and shoulder! However, this one looks much better and it is so beautiful and big and volatile, it also took more time to develop than Bitcoin's. So there are two possible inverse head and shoulders: the first one has a neckline that is a dark red, and this one had crossed its neckline already on higher volume, it's neckline has an incredibly bearish slope, and its right shoulder was really low, almost touching the point of the head. Now, this got me thinking, what if we consider this a double bottom, similar to that of Bitcoin's inverse head and shoulder! And look at that, in the bright red's I drew another neckline that is more horizontal which is closer to that of a standard head and shoulders! This Brighter Red is the current resistance of the movements now. The price objective of this inverted head and shoulder is roughly 1150. The volume is not as helpful in this case, because it supports the idea of both of them being an inverse head and shoulder so it will be up to the reader to decide which one is more valid.
There is one problem to this theory, Bitcoin is currently acquiring more and more dominance which means that it might not be able to cross the neckline/resistance (depending on whether you believe it is an inverse head and shoulder) in the high 800's.
..
Key Points:
1.) Two possible Inverse head and shoulders that are both valid.
2.) If the head is considered a double bottom (the green support line with two darker blue circle), and the lighter red is seen as the neckline for an inverse head and shoulder, then, the neckline must be crossed on huge volume and the price objective would be close to 1150 (In orange) or risk sideways movement or a drop lower.
3.) If the head and shoulder is noted by the darker red neckline, it must cross the red resistance line and believe that it could form an ascending triangle which can be seen in the blue tentative trendline (However, the ascending triangle does not make up the entire blue trendline because the volume does not match, instead the ascending triangle would be much smaller and you can identify this by finding the candle stick with the highest volume. Its price objective closer to that of the dark red inverse head and shoulder which is 940), a crossing of this trendline would put it at risk of sideways movement or a drop lower.
My Botched Bitcoin Cash Analysis:
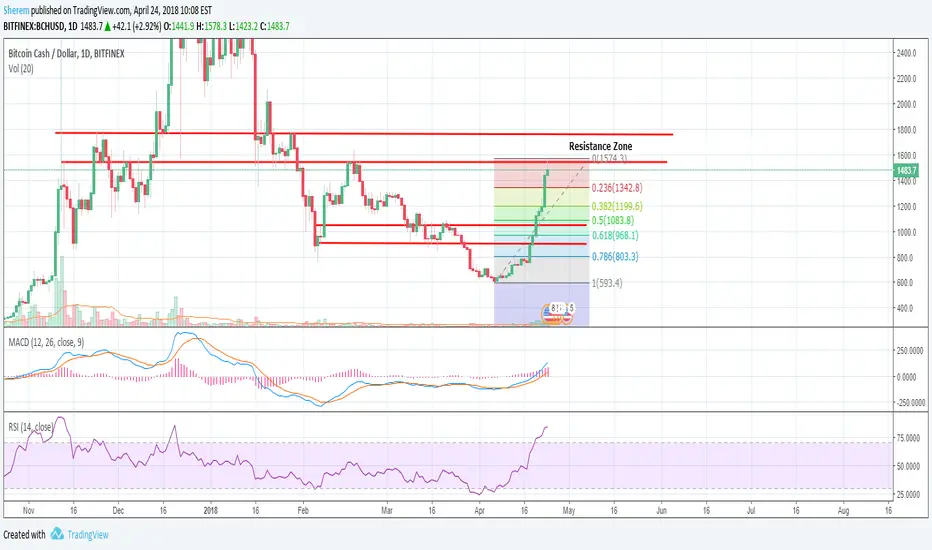
BCH hitting a double bottom?!Let's get right to what's going on, in bullet format!
1. BCH has hit this double bottom area and bounced off of it.
2. MACD has crossed up on the daily
3. RSI broken out of this downward trendline.
4. It hit the previous resistance point/ema and moved off of it and is consolidating
It appears we are going to get a move up, but how far we go is the question? BTC appears to be heading towards it's massive trendline. IF BCH does the same, we could get a MAJOR move up, or it just goes up to this 900-1k area before reverting back down. We'll have to see how this move up goes!
Happy Trading!
-Sherem

Major bull run coming or End of Crypto (please read the descriptBCH is following one unique pattern of 6 weeks Down and up,
This one is final one before a major bull run, its because if it goes a little up and follows the 6 weeks down theory it would go below unexpected prices which is very very un un likeley.
so guys stock up before we take off to all time highs again,i would say Staring from July - Mid july,

BCHUSD - Is this fractal playing out?Looks like a mini fractal is playing out.
If you look at a smaller timeframe 1hr, 4hr, it looks like BCH is looking for a bullish continuation on an equilibrium pattern. I'm guessing this will take us to about 1500, at which point we the rest of the fractal will play out and take us back to the blue line.
Let me know your thoughts!
Short term long. Medium term short. Long term, remaining bullish!

BCHUSD - Are we looking at fractals?Looks like a mini fractal is playing out.
If you look at a smaller timeframe 1hr, 4hr, it looks like BCH is looking for a bullish continuation on an equilibrium pattern. I'm guessing this will take us to about 1500, at which point we the rest of the fractal will play out and take us back to the blue line.
Let me know your thoughts!

BITCOIN CASH (#BTC): Ichi TK-CrossIn mid term, this coin offers target around 0.200 and higher.
Short term targets mentioned in TA.
BTC has a significant impact on the BCH if BTC goes down, so BCH will follow it.
Also this analysis will not be valid.
I hope you enjoy my charts, please writte your comments, hit that like button or follow me. Thank you!

Bitcoin Cash [BCC] looking to continue to the short sideBCC Still Continues To Seem Bearish.
1) Moving Averages are about to cross Bullish and price action is underneath the MA trend lines.
2) Formed a Head & Shoulders pattern and the pattern confirmed. Expected Target for this is $684.
3) A long term trend line was drawn from the start of Nov 2017 until today. This trend line lies right above the Short Target from the H&S. Price could bounce off of this (approximately $789 ) as support or either bounce from the H&S target. I listed the difference from Target 1 and Target 2 which is about a 12.5% difference in price.
4) We are currently forming a downward channel if zoomed in to our current price region.
What do you think?
Add me on Twitter and let me know! @KennyDegu

Bitcoin Cash Machine Learning Crypto SignalThe rolling three-day signal for Bitcoin Cash (BCH) is "Don't Own". This is day two of the three-day signal. The signal will be updated again Saturday. For further details or discussion, feel free to leave any questions or check out signature/profile.
Bitcoin Cash Machine Learning 3-Day Crypto SignalThe rolling three-day signal for Bitcoin Cash (BCH) is "Buy". This is day two of the three-day signal. The signal will be updated and shared again on Sunday. For further details or discussion, feel free to leave any questions or check out signature/profile.
Bitcoin Cash Machine Learning 3-Day Crypto SignalThe rolling three-day signal for Bitcoin Cash (BTC) is "Buy". This is day two of the three-day signal. The signal will be updated and shared again on Thursday. For further details or discussion, feel free to leave any questions or check out signature/profile.

BCH's massive move, time to keep it on your radar!You can hate on Bitcoin Cash all you want, but Bitcoin Cash has outperformed all of the other cryptos by far. it took just 2 WEEKS for it to DOUBLE. 2 BLOODY WEEKS! What is really tricky about this is identifying a trading opportunity, which right now I don't see any. I do think it's a good time to take some profit. You could risk shorting it as the charts indicate we are in oversold territory by a couple factors:
1. RSI in oversold territory
2. Hitting a resistance zone.
BUT, a lot of people are just arbitrarily converting there BTC into BCH which has driven it up a TON and has kept MACD looking really good. Which is why I am not going to risk shorting it. I want to throw this out there to make sure people keep it on your radar as it made a lot of people a lot of money, and it's worth notating. We'll want to watch what happens if it pulls back and what it does at this $1,000 support zone/fib zone we have here.
Happy Trading,
-Sherem