BCHUSD - RSI bearish divergence formingA bearish divergence between BCHUSD price and RSI indicator is formng in proximity of level 23.60% fibonacci of last major bearish structure.
Doji is forming too. signs of trend reversal.
possible targets are in the 1150-1000$ zone.
Bitcoincashforecast

BitcoinCash target 2160 when it breaks 1260 (Fib 0.786%)I invest in Crypto currencies and I trade CFD's. When you want to invest in crypto, I advise you to buy 'real coins' because on long term that will give you far more profit than speculate the chart with CFD's. I have bought Bitcoin, Bitcoin Cash, Ethereum, XRP-Ripple, ReddCoin, FeatherCoin, Adcoin (ACC), Bunny Token and looking for others every day! Bunny Token gave me good profit so far! I bought these in Pre-sale. I expect this is going to become huge!
Do you have some good tips for crypto coins? let me know!
-------------------------------------------------------------------------------------------------------------------------------------------
My strategy
My main strategy is called 'cycle-trading'. After years of learning and practicing after I bought a teaching-package from a visionair, I found a way of how to trade successful with CFD's on the stock-market. Every stock is following an certain cycle which repeats itself. So, movements are often appearing in the same percentage, aswel long as short. This cycles appear at all levels; when you analyse the chart at 1 month, 1 week, 1 day, 1 hour. (others I don't use). This is the case, because all in life is build by the fibonacci sequence. When you analyse the chart, you'll also see the stock market is behaving itself as the fibonacci sequence.
How do I decide to open a position or not? First I analyse:
- Sentiment on the market
- Own created indicators
- Moving-averages and Bollinger-Bands
Trading means investing. Sometimes you lose more than you win in the beginning of a period!
Don't forget to follow me, so you get updated when I post new analysis. Also read my account and the 'status updates' to be informed.
Thank you for following and Succes with trading !
Richard from Rich.Exclusive.Trading

$BitcoinCash Fractal AnalysisHello, my dear friends!
The entire Crypto Market is experiencing the deepest form of despair I have ever seen! It is in these times where the best entries are formed.
Now, before we get too depressed let's take a look at the daily chart of Bitcoin Cash.
After analyzing the previous market cycle of Bitcoin Cash, I found a beautiful fractal that seems to be repeating.
When BCH was added to the market, we saw a great rally followed by the ABC retrace I have drawn on my chart.
After the rally, price slowly trended on the downside until finding support after a near 90% retrace.
Now, if we take a look at the current market cycle of Bitcoin Cash we see the same fractal pattern playing out.
Prices rallied from late October to mid November, before a very sharp sell off of 80% from ATH.
What followed next was the ABC retrace that we are still currently riding out to the bottom.
Taking a look at the MACD, we can clearly see momentum is oscillating in a symmetrical triangle pattern. This pattern can go Bullish or Bearish however,
I believe that the probabilities are in the Bulls favor.
On the Daily RSI we have a clear oversold signal which tells us that the sellers are slowly dying out.
For those looking for an entry, now is a great time to be accumulating cheap BCH.
Thank you all for tuning into this weeks fractal analysis of Bitcoin Cash!
Will History Repeat Itself? I sure hope so!
Remember to love thy neighbor as thyself, and remain positive throughout the deep despair of the Cryptocurrency Market.
Great things are coming, it's been prophesied. ;)

BitcoinCash probably will touch 405. Than long to 1200.Crypto currencies I don't trade as CFD's. Too much risk, mainly because they expire very soon every time. When you want to invest in crypto, I advise you to buy 'real coins' and not to speculate the chart with CFD's. I have bought XRP-Ripple, Bitcoin, Bitcoin Cash, Ethereum, ReddCoin, FeatherCoin, Adcoin (ACC), Bunny Token and looking for NEO now! But wait NEO to buy, because price looks to go to 30.00 first.
-------------------------------------------------------------------------------------------------------------------------------------------
What about my ' Cycle phenomenon' ? read here:
My main strategy is called 'cycle-trading'. After years of learning and practicing after I bought a teaching-package from a visionair, I found a way of how to trade successful with CFD's on the stock-market. Every stock is following an certain cycle which repeats itself. So, movements are often appearing in the same percentage, aswel long as short. This cycles appear at all levels; when you analyse the chart at 1 month, 1 week, 1 day, 1 hour. (others I don't use). This is the case, because all in life is build by the fibonacci sequence. When you analyse the chart, you'll also see the stock market is behaving itself as the fibonacci sequence. But, still the most difficult part and what it's all about, is where does a long or a short start? and which point is telling you that the cycle is started, so that you know it will probably go to the next fibonacci resistance? .... therefore I have developed some own indicators!
The exact positions of where to open, to close and the stop loss position and take profit position is very important to be successful with trading!
My strategy is to never trade on volatile markets. You will lose your money when you do! Trade on technical-chart analysis! not on news and volatility!
One of my other strategies is that trades are only interesting and ‘safe’ to open when: you can possibly lose 1/3rd of the possible profit. So; when you set the indicators after analysing resistances, and you can lose 100 but win 300, it is worth the try!
How do I decide to open a position or not? First I analyse:
- sentiment on the market > are people in buy mode or short mode
- I have some own created indicators, some I show in my charts. Therefor I use the fibonacci sequence. My indicators tell to open a position or not and in combination with other own created indicators I decide where to place the stop loss and take profit positions.
- and this own indicators tell me when probably a new long position starts or a new short > these are the positions where I place my orders! or open directly.
- and again other own created indicators tell me how far long or short it probably goes. The take profit and stop loss positions are other positions than the resistances in the market!
- the moving-averages and bollinger-bands are very important indicators also. They are helping a lot! by making decisions.
And that is Why I win more than I lose in the end. Patience is everything, we’ll wait for the right moment! But don't forget; trading means investing. Sometimes you lose more than you win in the beginning of a period!
Most of the times the sentiment changes on Monday! please consider that when you start a position on Monday. Tuesday, Wednesday and Thursday are on steady markets normally calm trading days. Than, my strategies work at their best!
Don't forget to follow me, so you get updated when I post new analysis. Also read my account and the 'status updates' to be informed.
Thank you for following and Succes with trading !
Richard from Rich.Exclusive.Trading

BitCoinCash at danger zone When it breaks resistance huge short Crypto currencies I don't trade as CFD's. Too much risk, mainly because they expire very soon every time. When you want to invest in crypto, I advise you to buy 'real coins' and not to speculate the chart with CFD's. I have bought XRP-Ripple, Bitcoin, Bitcoin Cash, Ethereum, ReddCoin, FeatherCoin, Adcoin (ACC), Bunny Token and looking for NEO now !
-------------------------------------------------------------------------------------------------------------------------------------------
What about my ' Cycle phenomenon' ? read here:
My main strategy is called 'cycle-trading'. After years of learning and practicing after I bought a teaching-package from a visionair, I found a way of how to trade successful with CFD's on the stock-market. Every stock is following an certain cycle which repeats itself. So, movements are often appearing in the same percentage, aswel long as short. This cycles appear at all levels; when you analyse the chart at 1 month, 1 week, 1 day, 1 hour. (others I don't use). This is the case, because all in life is build by the fibonacci sequence. When you analyse the chart, you'll also see the stock market is behaving itself as the fibonacci sequence. But, still the most difficult part and what it's all about, is where does a long or a short start? and which point is telling you that the cycle is started, so that you know it will probably go to the next fibonacci resistance? .... therefore I have developed some own indicators!
The exact positions of where to open, to close and the stop loss position and take profit position is very important to be successful with trading!
My strategy is to never trade on volatile markets. You will lose your money when you do! Trade on technical-chart analysis! not on news and volatility!
One of my other strategies is that trades are only interesting and ‘safe’ to open when: you can possibly lose 1/3rd of the possible profit. So; when you set the indicators after analysing resistances, and you can lose 100 but win 300, it is worth the try!
How do I decide to open a position or not? First I analyse:
- sentiment on the market > are people in buy mode or short mode
- I have some own created indicators, some I show in my charts. Therefor I use the fibonacci sequence. My indicators tell to open a position or not and in combination with other own created indicators I decide where to place the stop loss and take profit positions.
- and this own indicators tell me when probably a new long position starts or a new short > these are the positions where I place my orders! or open directly.
- and again other own created indicators tell me how far long or short it probably goes. The take profit and stop loss positions are other positions than the resistances in the market!
- the moving-averages and bollinger-bands are very important indicators also. They are helping a lot! by making decisions.
And that is Why I win more than I lose in the end. Patience is everything, we’ll wait for the right moment! But don't forget; trading means investing. Sometimes you lose more than you win in the beginning of a period!
Most of the times the sentiment changes on Monday! please consider that when you start a position on Monday. Tuesday, Wednesday and Thursday are on steady markets normally calm trading days. Than, my strategies work at their best!
Don't forget to follow me, so you get updated when I post new ones. Also read my account and the 'status updates' to be informed.
Thank you for following and Succes with trading !
Richard from Rich.Exclusive.Trading

#BCHUSD Descending Broadening Wedge - Bullish Trend ReversalI don't normally TA BCHUSD, but when I do...
So I decided to look at BCH today because I never follow it and I mistakenly read BTCUSD price as BCHUSD and immediately wondered how BCH caught up with BTC. Thankfully I was wrong. But looking at the daily chart, it's completely obvious that BCHUSD is in a Descending Broadening Wedge, which is a Bullish signal for Trend Reversal.
Refer to this website for statistics and buy/sell targets. How you interpret the signals is completely up to you.
thepatternsite.com
My thought is we're either near a breakout, or we may fall again for the third touch at the bottom, before rising for a breakout. Either way, it seems like a good long position if you're going to hold for a few months.

BCH PLEASE10sma crosses above the 20sma
bullish macd
bullish rsi
higher highs higher lows
100sma positive
*DISCLAIMER*:
I am not a financial advisor nor am I giving financial advice.
I am sharing my biased opinion based on speculation.
You should not take my opinion as financial advice.
You should always do your research before making any investment.
You should also understand the risks of investing. This is all speculative based investing.

BitcoinCash at heavy resistance now Long to 1350 or short to 405BitcoinCash at heavy resistance now Long to 1350 or short to 405. Looks like a good moment to BUY!!
Crypto currencies I don't trade as CFD's. Too much risk, mainly because they expire very soon every time. When you want to invest in crypto, I advise you to buy 'real coins' and not to speculate the chart with CFD's. I have bought XRP-Ripple, Bitcoin, Bitcoin Cash and Ethereum!
-------------------------------------------------------------------------------------------------------------------------------------------
My main strategy is called 'cycle-trading'. After years of learning and practicing after I bought a teaching-package from a visionair, I found a way of how to trade successful with CFD's on the stock-market. Every stock is following an certain cycle which repeats itself. So, movements are often appearing in the same percentage, aswel long as short. This cycles appear at all levels; when you analyse the chart at 1 month, 1 week, 1 day, 1 hour. (others I don't use). This is the case, because all in life is build by the fibonacci sequence. When you analyse the chart, you'll also see the stock market is behaving itself as the fibonacci sequence. But, still the most difficult part and what it's all about, is where does a long or a short start? and which point is telling you that the cycle is started, so that you know it will probably go to the next fibonacci resistance? .... therefore I have developed some own indicators!
The exact positions of where to open, to close and the stop loss position and take profit position is very important to be successful with trading!
My strategy is to never trade on volatile markets. You will lose your money when you do! Trade on technical-chart analysis! not on news and volatility!
One of my other strategies is that trades are only interesting and ‘safe’ to open when: you can possibly lose 1/3rd of the possible profit. So; when you set the indicators after analysing resistances, and you can lose 100 but win 300, it is worth the try!
How do I decide to open a position or not? First I analyse:
- sentiment on the market > are people in buy mode or short mode
- I have some own created indicators, some I show in my charts. Therefor I use the fibonacci sequence. My indicators tell to open a position or not and in combination with other own created indicators I decide where to place the stop loss and take profit positions.
- and this own indicators tell me when probably a new long position starts or a new short > these are the positions where I place my orders! or open directly.
- and again other own created indicators tell me how far long or short it probably goes. The take profit and stop loss positions are other positions than the resistances in the market!
- the moving-averages and bollinger-bands are very important indicators also. They are helping a lot! by making decisions.
And that is Why I win more than I lose in the end. Patience is everything, we’ll wait for the right moment! But don't forget; trading means investing. Sometimes you lose more than you win in the beginning of a period!
Most of the times the sentiment changes on Monday! please consider that when you start a position on Monday. Tuesday, Wednesday and Thursday are on steady markets normally calm trading days. Than, my strategies work at their best!
Like my analyses? don't forget to follow me, so you get updated when I post new ones. Also read my account and the 'status updates' to be informed.
Thank you for following and Succes with trading !
Richard from Rich.Exclusive.Trading

A opportunity to buy in BCHUSD. Don't miss it.Technical analysis:
. Price is below WEMA21, if price rises more, this line can act as dynamic resistance against more gains.
. Relative strength index (RSI) is 39.
Trading suggestion:
. We have already opened Buy trades, based on Trend Hunter Strategy, trade setup is drawn on the chart and shows entry and targets.
Take Profits:
TP1= @ 1120.15
TP2= @ 1292.20
TP3= @ 1589.10
TP4= @ 2026.20
TP5= @ 2811.15
TP6= @ 4088.05
TP7= Free

BITCOIN CASH (BCH) 2x Bottom Before Pattern Change? (LOW RISK)This is a low risk trade because we were able to correctly predict in prior weeks it's general heading direction, which give this coin more future predictability.
This is a great long term hold with over 4x potential. Short term does look bearish, but we expect quick pattern change when bounce happens.
Followers will be updated on this trade.
Do not invest what you can't afford to lose. We are not your financial advisors.

BitcoinCash perfect follows Fibonacci Building horizontal line?BitcoinCash is perfectly following the Fibonacci sequence. I see patterns which looks like the chart is building an horizontal line now?
Will this be a steady point? Fluctuations will continue between 950 and 1670. Every time when the resistances get broken, there is a change the price will go more long above 1670 or more short below 950, and following fibonacci sequence prices will be touched. Interesting! I am very curious what will happen coming months/years.
Crypto currencies I don't trade as CFD's. Too much risk, mainly because they expire very soon every time. When you want to invest in crypto, I advise you to buy 'real coins' and not to speculate the chart with CFD's. I have bought XRP-Ripple, Bitcoin, Bitcoin Cash and Ethernum!
-------------------------------------------------------------------------------------------------------------------------------------------
My main strategy is called 'cycle-trading'. After years of learning and practicing after I bought a teaching-package from a visionair, I found a way of how to trade successful with CFD's on the stock-market. Every stock is following an certain cycle which repeats itself. So, movements are often appearing in the same percentage, aswel long as short. This cycles appear at all levels; when you analyse the chart at 1 month, 1 week, 1 day, 1 hour. (others I don't use). This is the case, because all in life is build by the fibonacci sequence. When you analyse the chart, you'll also see the stock market is behaving itself as the fibonacci sequence. But, still the most difficult part and what it's all about, is where does a long or a short start? and which point is telling you that the cycle is started, so that you know it will probably go to the next fibonacci resistance? .... therefore I have developed some own indicators!
The exact positions of where to open, to close and the stop loss position and take profit position is very important to be successful with trading!
My strategy is to never trade on volatile markets. You will lose your money when you do! Trade on technical-chart analysis! not on news and volatility!
One of my other strategies is that trades are only interesting and ‘safe’ to open when: you can possibly lose 1/3rd of the possible profit. So; when you set the indicators after analysing resistances, and you can lose 100 but win 300, it is worth the try!
How do I decide to open a position or not? First I analyse:
- sentiment on the market > are people in buy mode or short mode
- I have some own created indicators, some I show in my charts. Therefor I use the fibonacci sequence. My indicators tell to open a position or not and in combination with other own created indicators I decide where to place the stop loss and take profit positions.
- and this own indicators tell me when probably a new long position starts or a new short > these are the positions where I place my orders! or open directly.
- and again other own created indicators tell me how far long or short it probably goes. The take profit and stop loss positions are other positions than the resistances in the market!
- the moving-averages and bollinger-bands are very important indicators also. They are helping a lot! by making decisions.
And that is Why I win more than I lose in the end. Patience is everything, we’ll wait for the right moment! But don't forget; trading means investing. Sometimes you lose more than you win in the beginning of a period!
Most of the times the sentiment changes on Monday! please consider that when you start a position on Monday. Tuesday, Wednesday and Thursday are on steady markets normally calm trading days. Than, my strategies work at their best!
Like my analyses? don't forget to follow me, so you get updated when I post new ones. Also read my account and the 'status updates' to be informed.
Thank you for following and Succes with trading !
Richard from Rich.Exclusive.Trading

Quantamize Machine Learning Crypto Signal Update Bitcoin Cash Quantamize proprietary Machine Learning algorithms have generated a 3-day "Don't Own" signal for Bitcoin Cash as of 3/9.
We will be updating and producing more signals today and posting performance as well - stay tuned!
Quantamize's machine learning algorithms produce signals on over 25+ cryptocurrencies with accuracy rates above 60%.
Any updates to this 3-Day forecast will be shared, as signals are re-run daily.
We will be rolling out this product for 25+ cryptocurrencies as well as 4+ crypto portfolios in the coming weeks. Our website is in the signature below or check out our profile (or simply Google 1.44% 1.37% 1.37% us). We are collecting emails to update users when we release our suite of cryptocurrency products - - sign up to receive an alert when the cryptocurrency products are released.

BCH vs USD - Bitcoin Cash on the road to recoveryThe Bitcoin Cash market has slowly been recovering alongside BTC, lets take a look at the chart to get an idea of where we stand vs the Dollar.
We can see that the candles are making higher lows on the 4 hr candle chart.
This is a good place for the higher risk trader to get in on the action, stacking buy orders down into the $1260 support zone for quick gains on the way to $1300. Please note this is not advisable for the new trader, markets can change quickly.
The safer entry would be when markets consolidate above $1300 – $1360, providing we have good trading volume, this will be a good confirmation for the new bullish trend.
On the flip side should $1260 fail, we will most likely retest previous support at $1200 – $1000
Short term support is around $1200 and we have solid resistance above $1360, lets be patient while the bulls and the bears battle out.
Feel free to discuss this trade idea with me on Discord. Safe trades.

Quantamize Machine Learning Bitcoin Cash 3-Day Forecast SignalQuantamize proprietary machine learning algorithms have generated a 3-day "Do Not Own" signal for Bitcoin Cash
Quantamize's machine learning algorithms produce signals on over 25+ cryptocurrencies with accuracy rates well above 60%.
Any updates to this 3-Day forecast will be shared, as signals are re-run daily.
We will be rolling out this product for 25+ cryptocurrencies as well as 4+ crypto portfolios, which can be seen our website in the signature below or by checking out our profile.

Bitcoincash/bitcoin -time for a huge candle?There is divergence, but at the same time instinct says the downtrend breakout has happened from the triangle..
I guess since the hammer formation is happening, at 0.786 level, i guess, further down side is covered, and an uptrend to 0.618 levels can be monitored...
Disclaimer.. not trading, just watching the situation unfold....

BCH/USD Leaning towards the bearish sidePosition: Leaning Bearish.
I am going to trade BCH because it made for a great trade last time it got clobbered. While I didn't trade it last time, I will look to scoop up smaller amounts on the way down in a martingale fashion. If you scooped up shares down to 800, you made a great ROI on the way back up, even if you got out at the 1200-1300 area.
Bear indicators:
1. MACD averages crossing down, but... still in positive territory.
2. RSI is in oversold territory and it's topped while showing signs od divergence
3. Hit it's massive trendline that has proved resilient.
For all of this to be confirmed, we need a break of that $1300 support level. It could very well break up, but we will at least go sideways for a little while.
Happy Trading
-Sherem

#BCC BCC BITCOIN CASH CUT AND DRY SHORT UNLESS BREAK BULLFLAGI THINK THIS IS OBVIOUS BEAST TO WATCH.... TO FINISH BIGGEST TREND ON BOARD IT HITS E.... HOWEVER COULD PICK UP STEAM IF BITCOIN BREAKS..... WATCH CAREFULLY OVER NEXT COUPLE DAYS IF IT CLEARS FLAG BUY.... OR BUY IN BUY ARE E & C

BCH stubborn bullsSay whatever you want about bitcoin cash, i'm seeing an ascending triangle on the BCHBTC pair and we know there are many stubborn people backing up BCH so they will probably give it a shot with their deep pockets...


BCC USD BEST BUY AREAif the price of 770 is passed, BCC USD will continue down to the 610- 415 , I can only recommend buying at low price of 610,550, 415
This road map is just a prediction. I do not guarantee 100% right. I always use this way to get maximum profit. buy at low prices and sell at high prices. with reference RSI Oscillator (Weekly) in oversold or overbought Level area.
Do not entry all your capital, Please divide into 3 positions. 20%, 30%, and 50% .
Caution: Trading involves the possibility of financial loss. Only trade with money that you are prepared to lose.
# Be humble and patient. Do not fight the markets
Thank you.

Bitcoin Cash - BCH - The silence before the storm?Bitcoin Cash - BCHUSD
We can see that Bitcoin Cash has been struggling to regain its bullish momentum, however we find ourselves in a tight trading range between 1500 – 1700.
In this kind of scenario we would expect to see some action within the next few days.
Looking at BCHUSD, a breakout to the topside could take the prices up to the 2000 zone, where we would expect some resistance.
Should prices fall to the bottom we could see a selloff and prices could drop as low as 1200 or even lower.
Short term support is at $1400 – $1500 and resistance is at $1600 – $1700.
We will consider going long should prices drop into the $1400 zone, buy order could be stacked down to $1000 in case of a selloff.
We will consider going long on a breakout trade should prices consolidate above $1700.
Feel free to discuss this trade with me at the best Crypto Trader hangout .

Excellent Long-Term Hunting Opportunity in BCHUSD, Don't miss itTrading suggestion:
Price is in the support zone (1688.65 to 1334.70), traders can set orders based on Daily-Trading-Opportunities (Price Action) and expect to reach short-term targets.
Beginning of entry zone (1688.65)
Ending of entry zone (1334.70)
Take Profit:
TP1= @2097.35
TP2= @2311.35
TP3= @2746.50
TP4= @2947.50
TP5= @3167.25
TP6= @4088.05
TP7= @Free
Technical analysis:
.Price is below WEMA21, if price rises more, this line can act as dynamic resistance against more gains.
. Relative strength index ( RSI ) is 40.
.Current short-term is range bound, but resumption of uptrend is expected.

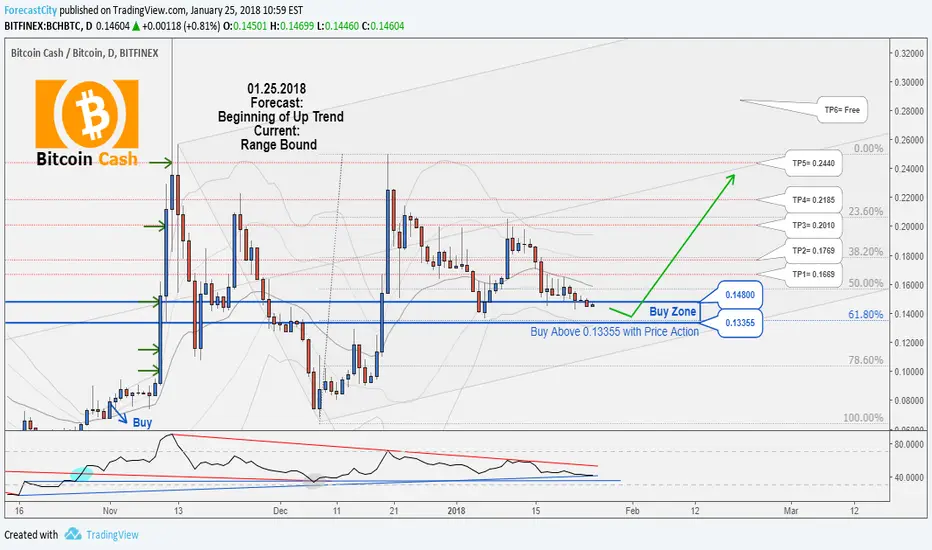
Excellent Long-Term Hunting Opportunity in BCHBTC, Don't miss itTrading suggestion:
Price is in the support zone (0.1480 to 0.1336), traders can set orders based on Daily-Trading-Opportunities (Price Action) and expect to reach short-term targets.
.Beginning of entry zone (0.1480)
.Ending of entry zone (0.1336)
Take Profits:
TP1= @0.1669
TP2= @0.1769
TP3= @0.2010
TP4= @0.2185
TP5= @0.2440
TP6= @Free
Technical analysis:
.Price is below WEMA21, if price rises more, this line can act as dynamic resistance against more gains.
. Relative strength index ( RSI ) is 43.
.Current short-term is range bound, but beginning of uptrend is expected.