Potential Bitcoin Dominance ShiftAfter more than a year of an upward trend in CRYPTOCAP:BTC.D , There is a chance for a gradual ascent toward the upper boundary of the ascending channel
with the potential significant correction at the beginning of the new year for Bitcoin We might witness a breakthrough above the upper boundary of the channel towards the 0.618 Fibonacci level or the upper boundary of the 77-month narrowing channel.
Feel free to share your insights in the comments section.
Bitcoindominance

BITCOIN DOMINANCE to drop back under 50% #BTC.DNice head and shoulder's on the dominance chart
Maxi's are not your friend
Saylor was calling for 80% dominance just a very short while ago.
And yet here we are heading back below 50
Wouldn't be surprised to see massive money rotate into #ETH on the news of the ETF approval.
Merry Christmas and Happy Holidays.

📊 BTC.D Ranging Scenario, Potential Reversal, and Key Support!An analysis of Bitcoin Dominance highlights a ranging scenario, potential reversal, and a key support level, providing insights for market participants.
Key Observations:
Current Bitcoin Dominance: Bitcoin Dominance is noted at 53.25%.
Ranging Scenario: The analysis suggests a potential ranging scenario for Bitcoin Dominance.
Potential Reversal: There's a consideration of the potential for a reversal in the dominance trend.
Key Support Level: If Bitcoin Dominance breaks through 53%, the next support identified is the weekly ascending support line.
BTC.D probabilityhi everybody
dominance in daily time frame is still ranging in that yellow static channel I drew before . after a fake break out from static channel it just hit the green bullish channel top and bounce down.
I have indicated everything that happens before in my previous ideas you can check them all.
now it's struggling with static channel ( yellow ) midline.
if candles could handle to break it down: the next target would be the bottom of the green channel
if candles could break fork midline to up: the next target could be about the top of the green channel or next level ( green line ) of the fork.
time will show us every thing
the important thing is whether it goes up or down almost all the altcoins will affect in extra times . so be careful and save some of your profits
be happy

Alt season predictionsBTC.D is the dominance that bitcoins market cap is over all crypto market cap.
It can be confusing, as BTC.D will increase when Bitcoin runs and the rest of the crypto market stays the same, As well as when there is fear and doubt in the market - people will run to safety - which will make people sell alt coins and buy bitcoin - making BTC.D increase even while Bitcoin is losing BTC value.
On the other side however,
When bitcoin increases in value - people take profits from bitcoin - either into a stable coin or to place into alt coins.
It is at this magical stage of the market, where alt coins do their massive returns.
Historical analysis
The red lines are the point on the RSI where the RSI has moved below the MA and been rejected. As people who read my posts know that this is my favorite signal in trading.
The March 21 Bull Market (the left red line) Took Eth from $1432 to $4852 in the 2021 altseason.
Note at this point, Bitcoin was trading at $57k when this started
The next red line is July 2022.
BTC.D lost the support, while confirming a bearish trend on the RSI.
This lead to a 100% return on Eth
Current analysis
BTC is on a rampage, there is an ETF about to be announced, and the halving is around the corner.
The time has come for believers in bitcoin to realize that the risk of NOT owning bitcoin far outweighs the risk of owning bitcoin.
This can be seen by the up only mentality, with minimal paybacks.
This could see a likely top for BTC.d at around 58.1% as tgus was a big pivot point in the past.
Currently, the candle wick week shows that there has been a hard rejection above the 50% level of the channel (the blue dotted line), making a lower high on the chart.
Possibly, we could see alt coins start their rally now - however the RSI MA is currently curved up - showing bullish momentum on BTC.D.
If we close this candle however, there will be strong bearish divergence and this could really start the alt coin ralley.
My official call for alt season are:
A break and close below the yellow trendline +
The RSI confirming the downward move on the MA (possible Feb-March)

What will be the Bitcoin Dominance?First of all, pay attention to the time frame, The time frame is 12H
It looks like this rising wave (big D) is a diametric with the remaining g wave.
Expect to go up to two red lines to complete the g wave. When this wave is completed, we may see deep drops in Bitcoin Dominance.
Because a large degree pattern may be completed and then we enter the large bearish branch of the E wave.
We have to see if we will have an X wave behind this diametric. If there is no wave X, the Bitcoin Dominance drop will be very deep!

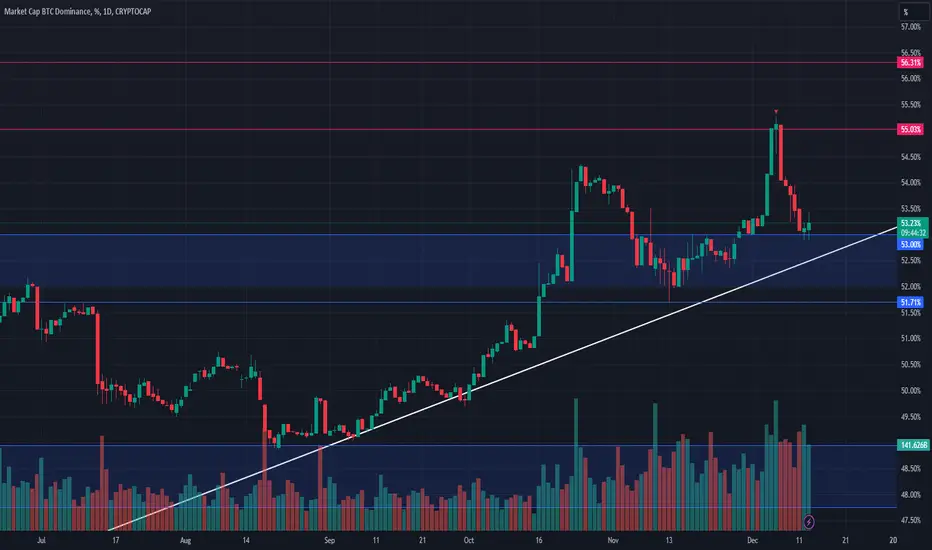
Bitcoin Dominance to Double-Top?Traders,
Previously, you'll remember I noted where I thought we arrive on the BTC.D chart. What I did not expect is a break back above 53% resistance. Now, with Bitcoin breaking all kinds of levels, prices, and expectations, market focus is zoned in at Bitcoin. At some point though, I do expect that focus to shift back into the altcoin space and more altcoin pumping should ensue. So, I am wondering whether BTC.D double-tops here before collapsing? I certainly know that this remains the highest probability at the moment and it is also why I am so heavily vested in altcoin trades currently.
Stewdamus

BTC is building for an up move then likely correct
As said in last week newsletter, BTC is developing in scenario 2 as expected. At this moment, an up move is expected soon
For me, ETH and BNB are a high probability trades with break out seem to be likely (too bad mkt recovered in 24h after CZ news)
I’ll buy in December according to my DCA plan (25% before ETF news / 25% after ETH / 25% before halving / 25% after halving).
BTC.D will face a resistance after potential retest upper bound (i.e. BTC up move), this will give a window to get into ETH,BNB, Alts to play catch up and rebalance back into BTC if needed

Altcoin Surge Ahead: Bitcoin Dominance Trend Analysis🔅The Bitcoin Dominance chart is presenting signals of a potential trend reversal or, at the very least, a substantial pullback. The repeated failure to breach the supply zone on two consecutive occasions highlights the resilience of altcoins against Bitcoin.
🔅The current hold within the supply zone indicates a pivotal moment where the long-anticipated altcoin season might begin or continue its ascent. This juncture could offer compelling buying opportunities for various altcoins, both in the short and long term.
🔅Further updates and insights on these potential opportunities will be shared in our VIP channel.

Global holdings of digital gold AKA BitcoinThey said it was only used for money laundering... How did they know that?
They now say it is like nothing else. What does this chart say to you? What will this chart say to you after the global financial systems
Germany is talking about using Bitcoin as legal tender NOW. Imagine if 1/3 of their population picked up 0.1 Bitcoin... That would be 2.7 million BTC...
My American government is not stepping forward yet(BUT they hold many, most people don't know this). Will they launder theirs through Coinbase???
Almost 20% of the blood dollar spent with lobbyists last year was on the topic of cryptocurrencies.
El Salvador is picking one up every day and they are bringing prosperity to their economy.
Multiple smart people think that we have multiple nations mining bitcoin while trying to hide it while others are turning their equipment on and using effin volcanos.
Don't forget to take the orange pill. Love you Max and Stacy! The show on RT kept me thinking of more in my 20's. You've changed my life and mind in!
Companies, countries & their populations of Bitcoin holdings. You know they are DCA buyers and will scoop up any flash sales. The price is being suppressed.
worldpopulationreview.com
buybitcoinworldwide.com
www.chainalysis.com
www.forbes.com

Dominance & Bitcoin to Move Up if 52% HoldsBitcoin and Bitcoin Dominance may be about to move up should the 52% dominance level be successfully held.
Expecting a sharp move up to 55-57% for dominance and 40-43.5k for Bitcoin, and alts to lose value vs. Bitcoin:
Should the 52% level be lost, we may re-test 50 or 48% dominance levels instead.
Bitcoin needs to cleanly break through the 36.5-40k area to get out of the danger zone:

XRP Bull trap, ALTS PullbackHi Traders, Investors and Speculators of Charts📈📉
A bull trap is "false" signal that shows a bearish trend (such as the lower highs in XRP) has reversed and is now heading upwards, when in fact, it will continue to decline. Often a large wick towards the upside is observed, shaking out traders favoring the obvious move (shorting).
It's important to note that for the first time, the TOTAL3 chart is about to close a red candle ALONG with Bitcoin Dominance:
This indicates that the entire crypto environment is being drained of liquidity, and corrections will follow.
Again, I wish there were more options... I'm choosing "short" to label my outlook even though I would not trade with leverage on XRP. The bulltrap and the TOTAL3 chart indicates we're heading lower, and so my bias for the short term is testing next immediate support zones.
If you found this content helpful, please remember to hit like and subscribe and never miss a moment in the markets.
_______________________
📢Follow us here on TradingView for daily updates📢
👍Hit like & Follow 👍
We thank you for your support !
CryptoCheck
BINANCE:XRPUSDT CRYPTOCAP:BTC.D CRYPTOCAP:TOTAL3

Bitcoin Dominance Cheat SheetHi Traders, Investors and Speculators of Charts📈📉
Bitcoin dominance and the rotations between BTC and altcoins can be confusing. Enjoy this easy-to-understand guide to BTC.D , and why it is important to watch alongside with the bitcoin chart.
👇👇👇
BTC dominance is calculated by dividing the market cap of BTC by the total market cap of all cryptocurrencies. If the TOTAL market cap is 1.5 trillion and the market cap of alts increases, then BTC dominance will go down unless the market cap of BTC also increases.
But to really understand the rotation of money between BTC and alts, you'll need a clear understanding of how how market caps all fit together.
Imagine a pie where each slice represents a different cryptocurrency. The pie here indicates the total cryptocurrency market cap of both Bitcoin and altcoins, which can increase or decrease at any given time. In other words the TOTAL chart.
- If BTC market cap increases but altcoin market cap shrinks (relative), the pie stays the same size.
- If BTC market cap increase and altcoin market cap increases, the pie size increase and so forth.
If BTC dominance is at 40%, it means that the BTC slice of the pie chart is 40% of the total size of the pie. The remaining 60% of the pie is made up of all other cryptocurrencies (altcoins).
A pie chart from March 2023:
Now, imagine a new bullish cycle starts across the crypto markets. This causes the market capitalization of both altcoins and Bitcoin to increase. If the market capitalization of BTC also increases, but at a slower rate than the market capitalization of altcoins, then BTC dominance will remain stable even though BTC Price increases AND altcoins prices increase. This is because the BTC slice of the pie is still 40% of the total size of the pie, even though the pie has grown larger.
In other words, the pie has gotten bigger, but the size of the BTC slice has remained the same relative to the rest of the pie.
Here is another way to think about it:
Total market cap: $1.5 trillion
BTC market cap: $900 billion
Alt market cap: $600 billion
BTC dominance: 60%
Now, let's say that the alt market cap increases by $200 billion and the BTC market cap increases by $100 billion. The total market cap would now be $1.8 trillion and the BTC market cap would be $1 trillion. BTC dominance would still be 60%, even though the price of BTC increased because the overall pie has gotten bigger.
Here is an example of how the BTC dominance falls, but BTC price increases:
Total market cap: $1.5 trillion
BTC market cap: $900 billion
Alt market cap: $600 billion
BTC dominance: 60%
Now, let's say that the alt market cap increases by $200 billion, but the BTC market cap only increases by $100 billion. The total market cap would now be $1.8 trillion and the alt market cap would be $800 billion. BTC dominance would now be 50%, even though the price of BTC has increased.
As a summary:
UP: BTC d ominance is increasing, meaning that BTC is outperforming altcoins.
STABLE: BTC d ominance is remaining relatively unchanged. This could indicate price movement on either Bitcoin or Alts .
DOWN: BTC d ominance is decreasing, meaning that altcoins are outperforming BTC .
We see an increase of market capitalization on the TOTAL chart:
_______________________
📢Follow us here on TradingView for daily updates📢
👍Hit like & Follow 👍
We thank you for your support !
CryptoCheck
CRYPTOCAP:BTC.D CRYPTOCAP:TOTAL

BTD.D & USDT.D -----> What's Happening?As I said before, I will say again that the market will always give you another chance to buy and there seem to be signs for this second chance.
Possible scenario for me:
Pullback to the broken levels of dominance by Tether and Bitcoin in the coming days and try to collect liquidity from the market and stop hunting small traders like me!
Then the return of dominance and the price of Bitcoin to the upward trend of the past .
and activating stop losses of positions in the opposite direction and possible shorts again!
What do you Guys Think about Btc.d and Usdt.d?

Does This Give Alts a Chance to Shine?Dominance is performing nearly perfectly with only a few surprises along the way. I wasn't quite sure dominance wanted to test the underside of that channel you see in red. That channel started in November of last year. We broke to the downside in August of this year and never really retested. Well, here we are today. We have retested the underside of the channel and can now expect BTC.D to continue its drop. The big question is will alts drop with Bitcoin as they have mostly been accustomed to doing in this bear market or will this finally be a time in which we can witness some divergence? The chart is showing the latter as a strong possibility however, be careful with your picks. Small cap/high risk alts should for the most part, not enter the equation here yet. The divergence will probably most notably be witness in larger cap alts like Ethereum and XRP. Maybe a few mid-cap alts as well.
This is not fin advice.
Stewdamus.

Market Update - October 13
US consumer price index (CPI) remains sticky: CPI data released on Thursday did not show a further cooling in inflation in the US economy, further muddying the Fed’s decision making on the future interest rate path.
Federal Reserve unable to reach a firm decision on interest rate hikes: Minutes from the Fed’s last meeting show wavering opinions on interest rate hikes against the backdrop of uncertainty in the US economy.
Ongoing conflict between Israel and Hamas dampens investor confidence: The price of both bitcoin and ether has been in decline since attacks erupted between Hamas and Israel on Saturday. Bitcoin has dropped below FWB:27K USD and ether has lagged, falling to 0.057 on the ETHBTC pair.
Sam Bankman-Fried’s trial continues as Caroline Ellison takes the stand: The former CEO of Alameda Research pleaded guilty to fraud and testified that SBF directed her to create false balance sheets to hide the company’s debt to FTX.
India is paving the way for crypto adoption, despite 30% capital gains tax: The Central Board of Direct Taxes collected over $12m in taxes, and a newly released report ranks India as number one for grassroots crypto adoption.
🫱 Read more here

Bitcoin Dominance targetsCRYPTOCAP:BTC.D
Possible Targets and explanation idea
➡️Marked 2 main targets for Bitcoin Dominance
➡️Based on Take Profit indicator on weekly we can see test of "Take profit" line
➡️Marked green box zone where you can step by step sell and fix profit in altcoins
Hope you enjoyed the content I created, You can support with your likes and comments this idea so more people can watch!
✅Disclaimer: Please be aware of the risks involved in trading. This idea was made for educational purposes only not for financial Investment Purposes.
---
• Look at my ideas about interesting altcoins in the related section down below ↓
• For more ideas please hit "Like" and "Follow"!

Still #Bitcoin season #BTC.D to push onto 50% plus#BTC taking the lead
as in past #crypto recoveries
Measured move to tag previous resistance.
#ALTS will lag but still give smaller gains.

Bitcoin Dominance AnalysisBitcoin dominance serves as a crucial indicator, offering insights into the broader altcoin market. Today, we observe a clear breakout from a cup and handle pattern, indicating a potential shift in market dynamics.
Key Resistance Levels Ahead: [/b
Resistance 1: 50.70%
Resistance 2: 50.91%
I anticipate pullbacks and increased activity in the altcoin market as a result. Keep an eye on potential opportunities! 🪙 🔍

Here is Why Bitcoin Dominance Suggests Small AltseasonBitcoin dominance is currently displaying an intriguing pattern that could have significant implications for the altcoin market. It's following an ascending channel and has entered a consolidation phase around the 50.0% level. What's particularly noteworthy is the formation of a pattern that resembles a head and shoulders.
Here's what this means:
Consolidation at 50.0% Level: Bitcoin's dominance is hovering at the 50.0% level, signifying a balance between Bitcoin and altcoins in the market.
Head and Shoulders-Like Pattern: The emergence of a pattern resembling a head and shoulders in Bitcoin dominance is a key observation. This pattern typically suggests a potential decline in Bitcoin's dominance.
Possible Drop: Given the shape of this pattern, there's a possibility that Bitcoin's dominance could experience a small drop, perhaps towards 49.5%. Such a shift can have significant implications for altcoins.
Altcoin Opportunities: As Bitcoin appears to be making upward moves, a slight dip in Bitcoin's dominance could pave the way for altcoins to shine. Altcoins often perform well when Bitcoin's dominance wanes, and they might even experience substantial gains.
Check out Altseason Cycle Cheat Sheet >>
In summary, Bitcoin's dominance teetering around the 50.0% level and the formation of a head and shoulders-like pattern signal a potential shift in market dynamics. This period of flux opens doors for diverse altcoins to showcase their potential. Smart strategies, vigilant monitoring, and prudent risk management will be key in maximizing gains and minimizing risks during this phase of the crypto market. Stay tuned, stay informed, happy trading!

How to Altseason Cycle || Cheat Sheet || Bitcoin DominanceMonitoring Bitcoin dominance (BTC-DOM) is a valuable tool for crypto traders. It provides insights into the relationship between Bitcoin (BTC-USD) and altcoins (ALT-USD), helping you make bette decisions about your altcoins and tokens.
Spotting Altcoin Seasons:
Altcoin seasons are periods of heightened interest in different cryptocurrencies and tokens, often causing their total market cap to surpass that of Bitcoin.
Understanding BTC-DOM's movements can help you anticipate how the market might react:
1. BTC-DOM Goes UP:
When BTC-DOM rises and BTC-USD also climbs, it often indicates a bullish phase for Bitcoin. During this time, ALT-USD may stay relative stable and face sideways.
If BTC-USD experiences a decline while BTC-DOM is on the upswing, ALT-USD might witness a significant dump.
When BTC-USD moves sideways and BTC-DOM follows suit, ALT-USD tends to maintain a stable course.
2. BTC-DOM Goes SIDEWAYS:
If BTC-DOM remains relatively stable and BTC-USD sees an uptrend, ALT-USD often mirrors this upward movement.
Conversely, if BTC-USD takes a dip while BTC-DOM remains flat, ALT-USD tends to follow suit with a decline.
When both BTC-USD and BTC-DOM exhibit sideways patterns, ALT-USD typically remains in a state of relative stability.
3. BTC-DOM Goes DOWN:
A decrease in BTC-DOM coupled with a rising BTC-USD often leads to a pumps for ALT-USD.
When BTC-USD experiences a decrease while BTC-DOM falls, ALT-USD may stabilize or enter a sideways phase.
If BTC-USD moves sideways while BTC-DOM declines, ALT-USD often witnesses an upward movement.
Remember that while these trends offer valuable insights, the crypto market is highly volatile. Low cap altcoins can behave unexpectedly even when Bitcoin dominance suggests a particular trend. Therefore, use Bitcoin dominance as one of many tools in your investment strategy, and always conduct thorough research before making decisions.

BTC.DIn the future, with the growth of Bitcoin dominance, we will witness further declines in altcoins; we are still in a BEAR MARKET.

BITCOIN DOMINANCE(BTC.D) will go down.
* 1D
The long-term upward trend line has been broken.
Therefore, the possibility of further declines seems high.
First of all, the important point is whether the 48.80% range, which is an important support line, is broken.
If this section is broken, it is likely to continue to fall.
Based on this, Alts bull market is coming.
