Mini-ALT Season coming? BTC Dominance at resistance...Could see $BTC.D overextending past resistance which might provide opportunity to confirm a bear div on the daily. However, if it's rejected here could mean some relief for alts in the near term with a bear div to later develop off the bounce from ~63.8 support, and down to ~58.2. $BTC
Bitcoindominance

Bitcoin Dominance - 2nd Re-test @ Bottom of Parallel ChannelAgain, we're re-testing the bottom of the parallel channel we broke out of back in July.
For alts to make good gains, we need to stay below the two trendlines drawn (bottom line is drawn from line chart, top trendline is from candlesticks).
To reiterate what was said on the chart from Nov 12, the same scenario is re-occuring and may or may not lead to another mini-alt run (or even the big one, but I'm not sure BTC is done yet).
I'm expecting a drop in dominance from here, providing some short term pumps to alts, but the opposite could still occur. For this to play out, make sure we stay below the two trendlines. If we break above and stay there, returning to our channel, this could be bad for alts vs. their BTC value.
Nov 12 (see link to related idea below):
-Back in July, we broke down out of the channel shown here. After a mini-alt-season, we've returned to re-test the bottom of the channel.
-There is a chance here that our re-test fails, and if so, we can expect alts to start moving again soon.
-If we re-enter and stay in the channel, this is bad for alts.

bitcoin dominance possible cup and handle This could potently signal a big move to the upside if BTC can brake the rim of this formation.

Bitcoin DominanceHello!
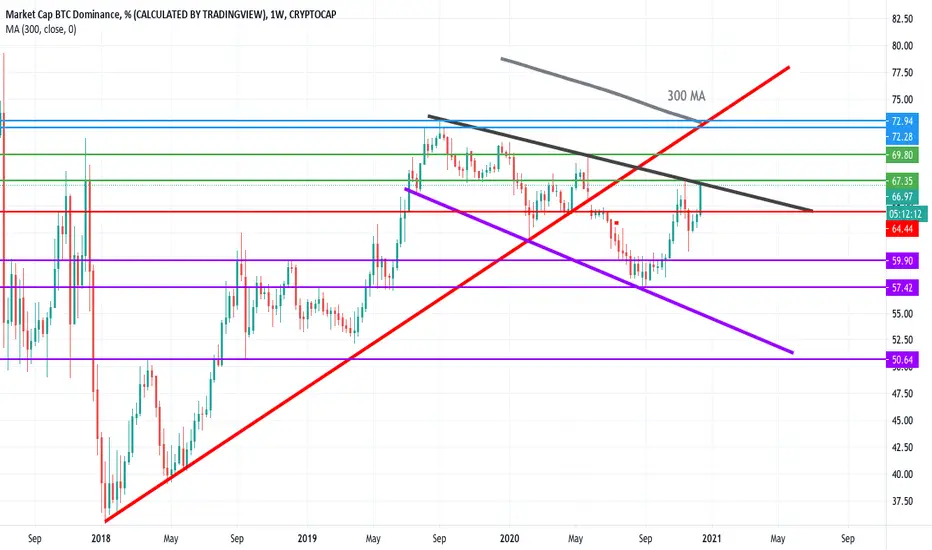
I did make an update from this same resistance line and EMA 200 before and it did work as an resistance. I believe I did say in that that usually the 5th or sixth time breaks the resistance. This is not of course an certainty but what I have seen it often works like this. Anyways the rule goes that the more times support or resistance is hit the weaker it usually gets.
Chart is on weekly timeframe so it should be quite strong resistance and there is also 200 Ema which both has been tested 4 times.
I do think we might actually break these Dominance levels but we shall see if we stay on top of it before Christmas or New Year.
It does look like there is alot of buying power and BTC is still in strong bull and has done some crazy moves before.
This is not financial advice.
If you do take trades use stop loss or you will get your ass burned.
First mistake beginner traders do is take too big risk.
Peaceful Christmas for everyone!
- Jebu
If you find this helpful you can support me with ETH
0xe952157B141E809b6377E61DBE8Dd85EDF7fc0e2

bitcoin dominance is over Monday the altseason will startThe market dominance of bitcoin TOUCHED THE MAXIMUM and will shrink this weekend.
Means bitcoin buyers are finished accumulation and now the price will stay at 24000 pet Bitcoin or at most jumping very volatily between 30000 and 22000 when investments in form of bitcoins will flow into alternative crypto coins with similar if not more expressive FOMO Rally like in December 2017.
Alternative coin Rally will start this weekend and hold most possibly a month.
Most cheapest altcoins with at least 1million Market capitalisation and 100k Daily Trading volume will rocket up to 10x and may be 100x.
Short Bitcoin buy Altcoins - this is your chance, that happens only once in two years
2016
2018
and now
2020


Bitcoin viewAnother boom is already started. In previous run-up after break out it goes more than 222% (closing basis) in 91 days. This time if we consider half of percentage of previous run-up that is 111% appox and considering 91 days (closing basis) . So possible minimum target is 22905.
Disclaimer:- your capital at risk. Consult before investing your financial advisor.

2020 Dominance Channel BTC.D #btcdominance #bitcoin $BTC #cryptoHere we see our Btc Dominance chart . As you can see we have been in the same regression channel for all of 2020 . That pink and blue box on the chart is a regression channel indicator. We are also about to hit a TD Sequential 9 in green ( that's those numbers you see on top of the candles . ) When we hit a number 9 in green on November 20th we then saw steep downward dumping happen and I expect the same will happen again . If this channel seems like it will be continuing into 2021 then we could see an altseason on the way when Bitcoin Dominance starts to go down .Also notice that rsi is about to wick up to that red line - again there should be a turnaround there soon too.

Bitcoin dominance ascending wedgeBearish ascending wedge on BTC.D. This formation may lead to fresh highs for alt coins. Also included a diagram of a bearish ascending wedge for anyone learning chart patterns.


ALTCOINS: Why should you invest in Altcoins now?Hello my friends!
Why should I invest in Altcoins at all? That only makes sense if Altcoins performs better than BTC. The chart shows the inverted BTC dominance. At 50%, the market capitalization of BTC is balanced against all Altcoins. Currently, BTC is at a level of 64%. This means that 64% of the total market falls to BTC, the remaining 36% is divided between all other coins.
Of course, you can land a special hit with one or the other Altcoin, but that's more like gambling. Therefore we should take a look at the market for Altcoins in general: Can Altcoins become more important? YES! The current target is around 52-54% BTC dominance. The lowest point was at 73% (highest BTC dominance).
We cannot judge the time before Mid of 2017. At this point the most Altcoins have been created.
Currently, it looks that the trend line will hold. This means that the time for Altcoins has generally come again. This also means that the whole market is still bullish.
Therefore, an investment split between BTC and Altcoins would make sense. Which Altcoins are interesting for an investment? Here I have a clear opinion: the top coins are good. I would not recommend exotic ones. Okay, with exotics you can make 100% and more in a week or a day, but that's gambling imo. Of course you can invest in a coin, if it is a real specialty and you understand the technology behind it. But I would be careful.
And another thing: I always recommend to analyze Altocoins against BTC, because BTC is the leading currency in the crypto market.
--
Let's see what happens.
Happy trading. :-)
--

#Bitcoin Dominance Mid-Term Analysis using VPVR IndicatorHello there ladies and gentlemen , BulloTaurus here with some Educational Bitcoin Dominance Chart Analysis.
For the past months we had an amazing bull run so far! Bitcoin broke all previous resistances like there were none of them!
We still didn't saw a massive volume spike on exchanges, mostly because this time we have Institutional Investors join the game that have their own private offers to buy bitcoin what doesn't always show on graphs.
Thanks to VPVR ( Volume Profile Visible Range) indicator that is available only in Premium Plan from TradingView, i can show you something very important again.
We can see that at 67% we have a huge demand zone, this is illustrated perfectly thanks to VPVR.
VPVR displays trading activity over a specified period and plots a histogram on the chart which reveals dominant and significant price levels based on volume and in essence gives a clear indication of Supply or demand at a certain price rather than volume in a certain period.
Traders that use this indicator try to use it as a support or resistance confirmation.
Based on previous HVN (±64%) we might have a dip up to 60% in the next following weeks. HVN = High Volume Nodes or HVN are represented as peaks of volume on VPVR indicator, they usually mean that there was a lot of demand in the market at a specific price. These Nodes form when price spends a great amount of time at a certain price level, usually as a consolidation.
If the price leaves the HVN, like we have right now on CRYPTOCAP:BTC.D chart, we might see the drop that i explained earlier, basically like losing the resistance.
Conclusion
Volume Profile Visible Range is used frequently by professional traders, CRYPTOCAP:BTC.D might not be the best example of how this indicator might work to show all its potential. Personally i expect a dip in Bitcoin Dominance Chart, holiday season might also contribute to this short-mid term down movement.
Trade wisely and don't forget risk management and setting your stop-loss.
I will keep updating this Educational Material with fresh examples and show its full potential.
Peace.

Crypto Market is on the edge of a big moveIf it were that easy, there would be less fun! Buyers have been attempting to push the price above $20,000 for about ten days now.
Despite the clear wealth of supply of coins at these levels, this will be a very interesting test of the bull's resilience. Since March, the buy-side has proven to be more patient and stubborn, almost always in control of the price action.
Three lines can determine how the short-term course of the prices of the entire market will evolve.
First, Bitcoin is finding hard to breach once and for all the all-time high level. Once it's cleared, the real FOMO will start. Until then uncertainty and strong shake-out are always behind the corner.
Ethereum is facing a strong resistance. A break-out above could ignite momentum for all Altcoins. Since late November the price is building a clear cup&handle structure but the market likes to fool traders with strong moves in the opposite direction.
The crucial third line to keep an eye on is the forming resistance that prevents an increase in Bitcoin's dominance. The ratio seems to be positively correlated to the Bitcoin's price, meaning that a mild drop of BTC would translate into Altcoins' overperformance. In case of stronger price moves, instead, the domince could increase quickly with not many near resistances.
The less dramatic scenario would be to see Bitcoin ranging for a while to allow Altcoins to have their glory day, waiting for King BTC to be back on stage.

Weekly BTC dominance continuing bear flag formationHello all,
First I want to say thank you for all your ideas and cannot express how much help they have been this year in learning the crypto space. This is my first post so feel free to share any different ideas or tips. I wanted to share some thoughts on what I see forming.
1. Dominance on the weekly is starting the formation of a textbook bear flag. When comparing historical bear flags to 2017, you can see this is just starting. I expect a couple more weeks of chop then a violent weekly red candle to kick start a very nice alt season.
2. MACD is dropping and in a couple more weeks should be red and KDJ is red and looks to continue.
3. Ichimoku cloud confirms this trend, i.e. Red and we've been under the cloud since the summer and the latest dominance rejection was at the bottom of the cloud.
4. Descending broadening wedge is forming which should lengthen the cycles.
5. BTC pair Alts have bottomed.
I don't have specific targets or times to give you. Nobody knows that. What I do know is the trend is forming for a very nice and prolonged alt season and the next couple of weeks should confirm. Buckle up, 2021 looks to be fun!

Some Thoughts on Bitcoin vs. Bitcoin DominanceBitcoin has been on a run! It's about to hit new all-time highs (or it already did). What was most surprising was how it crashed right before Thanksgiving only to spike and rip higher once again. Congrats to the resilience of this asset. Clearly people see the power and potential.
Now for this chart analysis I am looking at two charts side-by-side: Bitcoin Monthly chart and a Bitcoin Dominance chart. The Bitcoin monthly chart shows Bitcoin going all the way back to late 2011. This is the price of Bitcoin as shown with monthly candles or monthly bars. The Bitcoin dominance chart shows what percentage of Bitcoin makes up the entire crypto universe market cap. This is interesting because it effectively demonstrates if Bitcoin's market cap is going up faster than alts and other coins or vice versa. It can also show what market is stronger or weaker - Bitcoin or everyone else.
What I find most interesting is how alt coins have slowly taken market share from Bitcoin over the years. I personally think it is currently at a healthy ratio, although I could see Bitcoin losing some steam relative to altcoins. Here's an important note: Both assets can go up and succeed at the same time. The question is if one is outperforming the other.
This is where things get interesting. The ratio of Bitcoin's market cap to all other coins can continue to chop sideways and that's perfectly normal. Meaning, they're both moving at the same pace and keeping an equal share. In addition, I think it is in Bitcoin's best interest to have a healthy altcoin market. After all, they are all apart of the same universe of tradable assets. I don't think it's wise for just Bitcoin to rise and alt coins to lag. There needs to be a global bull market to confirm the entire crypto landscape, the rise of new projects, and the new standard being built to make the world better and create more efficient businesses, processes, and financial innovation. So actually, the real key, just might be in altcoins.
This is what I will be watching.
I will be eyeing Bitcoin's price, but more importantly I will be watching it next to its dominance. A healthy global market for all crypto assets is best. Let's see what happens and thanks for reading.

ETH/USD - correction wave - market updateHello, Traders!
After the rapid growth, the market went into a correction.
The price drop interrupted the buyer's liquidity buffer in the range of $480-520.
On the weekly chart, we clearly see a bullish correction of the entire upward movement from September. The price has tested the lower bound of the trading range 488-626$.
To continue the ETH altcoin rally, it is necessary to form a support level and gain strength to exit the range 488-626 $ to the next level 828 $.
Bitcoin Dominance
We can see a bounce back to the 64.24 level on the chart of bitcoin dominance, which is a quite normal correction.
If the level 64.24 becomes a local resistance, it will give an impetus to the continuation of the decline in the Bitcoin domination to the level of 59.83 and the continuation of the growth of altcoins.
Watch out for the market and leave your feedback in the comments below!


Bitcoin dominance - Altcoin saturationSome ideas on bitcoin dominance, I believe it will be rejected 'bullishly' at the cluster that has formed within the orange rectangle
This is supported by the bullish MACD in sight
This contradicts my previous spiral idea of 30% target, this contradiction is purely flaunted based on the MACD observation

BTC.D pattern analysis (Rising & Descending broadening wedges)Hello everyone,
Today I´ve prepared for you Bitcoin dominance (BTC.D) analysis based on patterns.
The 1st one is:
BEARISH rising wedge
The rising wedge can be one of the most difficult chart patterns to accurately recognize and trade. While it is a consolidation formation, the loss of upside momentum on each successive high gives the pattern its bearish bias.
However, the series of higher highs and higher lows keeps the trend inherently bullish.
The final break of support indicates that the forces of supply have finally won out and lower prices are likely.
There are no 100% measuring techniques to estimate the decline – other aspects of technical analysis should be employed to forecast price targets but I tried to draw it for you for easier recognition in the left top corner.
The 2nd one is:
BULLISH descending broadening wedge after a peak
A descending broadening wedge is bullish chart pattern (said to be a reversal pattern). It is usually formed by two diverging bullish lines.
There are no 100% measuring techniques to estimate the decline – other aspects of technical analysis should be employed to forecast price targets but I tried to draw it for you for easier recognition in the right bottom corner.
The price objective is given by plotting the wedge’s maximum height onto the breaking point
A descending broadening wedge is confirmed/valid if it has good oscillation between the two upward lines . The upper line is the resistance line; the lower line is the support line.
Each of these lines must have been touched at least twice to validate the pattern.
NB: a line is said to be "valid" if the price line touches the support or resistance at least 3 times.
This implies that the descending broadening wedge pattern is considered valid if the price touches the support line at least 3 times and the resistance line twice (or the support line at least twice and the resistance line 3 times).
Statistics of the descending broadening wedge after a peak
- In 79% of cases, the exit is bullish.
- In 23% of cases, a descending broadening wedge occurs in a consolidation movement.
- In 81% of cases, the pattern's price objective is achieved when the resistance line is broken.
- In 40% of cases, the price makes a pullback in support on the descending broadening wedge’s resistance line.
I personally think that we had in previous days Bitcoin dominance fake out which seems to be turning into alt ralief/btc catch up run till the end of December/ January which could drag BTC.D down to approx. 53% again.
Rest is showin in the chart.
I previously called the top of it and expected the approx. path here
This is where we are now at So I´ve decided to make a update with new prediction call and that bringed us to current TA
Hope you like this technical analysis and I wouldn´t mind if you please leave a like & comment to me as a feedback is very importan for me.
Thanks !
ChaChain
-------------
Disclaimer:
I´m not registered or licensed in any jurisdiction whatsoever to provide investing advice or anything of an advisory or consultancy nature, and therefore I´m unqualified to give investment recommendations. Always do your own research and consult with a licensed investment professional before investing. This communication is never to be used as the basis of making investment decisions, and it is for entertainment purposes only.
KEYWORDS
bitcoindominance, btc.d, BTC.dominance, dominance, Market CAP BTC Dominance, %, trading, bitcoin , bitcointrading, profitable trading, profittrading, profit trading, secret, divergence, bull divergence, bear divergence, divergencetrading, divergence trading, trading strategy, how to trade bitcoin , bitcoin trades, bitcoin trading, make profit, take profit, trading strategy, trading technique, successful, successful trader, successful technique, successful strategy, successful secret, how to trade, trend analysis, technical analysis , indicators, rsi , relative strenght index, let it rain, successful life, easy strategy, easy trading, easy technique, make money, crypto investing, investing, crypto, cryptocurrency, cryptocurrencies, mentoring, money, chartart, beyond technical analysis

22/11/2020 #Bitcoin Dominance (BTC) forecast on the weekly22/11/2020 #Bitcoin Dominance (BTC) forecast on the weekly

Bitcoin dominance target madeOther than being in a downward megaphone ( see below) also the cart pattern seem to have completed its cup and handle formation target
