Bitcoin ($BTC): Daily Chart Technical AnalysisHello everyone!
Perhaps in near term, the bulls will still have the upper hand and could drive many retailers into margin call exposure, thus managing to close out their long positions, but after that, I expect a major corrective structure. The expected rally that we have been following in recent weeks (see chart below), may need at least a consolidation, leaving the door open for the Sellers (short-term). In many cases like this, the corrective structure develops two strong bearish legs and one corrective leg (ABC pattern), and many of levels shown on daily chart can also be found in the latest analyses. During the last few months I have noticed that macro-economic news, especially on the inflation side, have an important influence, perhaps because since bitcoin has existed we have never seen such a particular geo-political and macro-economic context (war and inflation in primis). What will I do this week? Well, thanks to the contribution of my supporters, I will go looking for continuation patterns or reversal patterns on minor time frame, but above all I will keep an eye open on Altcoin opportunities (not only on my channel, but also here on TradingView we are following some Interesting trades about altcoins).
THE RALLY ...
(Click and Play Cgart below)
💥Bitcoin : Support area approach in short term
WEEKLY ANALYSIS
(Click and Play Chart below)
INTARADAY ANALYSIS
(Click and Play Chart below)
Bitcoin ($BTC) Corrective structure in short term? We'll see...
...and you, do you have any different ideas? Let me know in the comments!
...trade with care! 💖
Cheers!
Bitcoinforecast

This isnt the bottom yet on BTCI dont care what moonboys will tell me, i dont believe its the bottom yet.
Maybe im wrong (i could be) but i think we are heading down soon again, maybe we visit 24-25k first, but the bigger picture is forming lots of bearish action.
Have a great day.

BTC/USD Daily Levels — February 1st, 2023Looking at the price of Bitcoin on the Daily TF, we can see that we just wicked out on the $24,233 level and are forming a buy side sweep.
We will see what happens on the close of the daily candle, but if we close underneath here, that means the buy side sweep is formed and we should be looking at lower levels as the high for the month / local top is formed.
The red line I have marked at $21,294 and also doubles as the bottom body of the LG candle, and that's where i'd be looking to offload shorts and start rebuying my long position. However, I will see how we look at that time, as we can still drop back down to the ~$19,000 level, marked on the chart as the top of the green accumulation box. This would form a higher low of the move formed at the start of the year and would properly rebalance this up swing.
A lot of people on Twitter are talking about running the yearly lows, and if we did, we'd create (obviously) a lower low and send the cryptocurrency market into goblin town. Now not that i'm against it, I don't think we'll drop that far, and if we do, it'll be a clean wick through the level just to retest it.
All in all, looking for the $19-21k targets to re-enter my long positions after absolutely milking this move upwards from $16k.
Take it easy traders, I wish you all the best! Cheers 🥂
As always please do your own research, I am not a financial advisor and this post is for educational purposes only

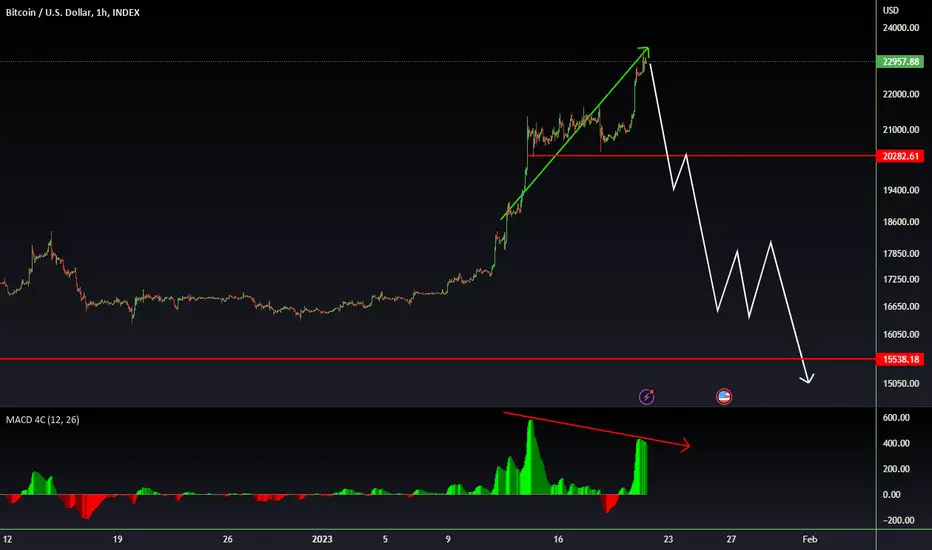
BTCUSD💥1H-TIMEFRAME ANALYSISBTCUSD💥1H-TIMEFRAME ANALYSIS
💗Hello ladies and gentlemen
This is my new idea for 💥BITCOIN
I hope my idea is clear
Support me by like and share thank you
Stay Safe💯💲💲💲
Good luck💰😍
BTC/USD Weekly Death Cross?Dear Investors and Traders,
Based on my chart, I saw weekly death cross at weekly timeframe. Am I wrong?
Perhaps I wanna wait until 15k or below to entry. I reckon you guys as well.
Critics and comments are super appreciated !
Good luck!
PS: Don’t trade blindly. Please do research at the1st place

#Bitcoin - thoughts out loud #2 Good afternoon, dear colleagues!
Dear colleagues, I sincerely thank you all for your attention and wish success to everyone!
And remember one thing:
"sometimes you win/sometimes you learn"

Bitcoin Analyze (Short Term, 15-minute Time Frame,01/25/2023)!!!Bitcoin moved as I expected in yesterday's post👇✅
Bitcoin seems to have found the end of wave Y in PRZ(Price Reversal Zone).
I expect Bitcoin to rally to the downtrend line.
If this line breaks upwards, we can more confidently talk about the end of the Y wave. Otherwise, Bitcoin is still in the main wave X.
Bitcoin Analyze ( BTCUSDT ), 15-minute time frame ⏰.
Do not forget to put Stop loss for your positions (For every position that you want to open).
Please follow your strategy, this is just my Idea, and I will be glad to see your ideas in this post.
Please do not forget the ✅' like '✅ button 🙏😊 & Share it with your friends; thanks, and Trade safe.

Bitcoin, The Fast and Furious!Bitcoin Idea and Analysis | BTCUSDT Analysis | BTCUSD
Bitcoin will rise rapidly in the next 24 hour!!
✅ ✅ Risk warning, disclaimer: the above is a personal market judgment and analysis based on published information and historical chart data on The trading view,
And only some of these analyzes are my actual real trades.
I hope Traders consider I am Not responsible for your trades and investment decision.

Bitcoin Idea |BTCUSDBitcoin - BTCUSD and BTCUSDT
✅ ✅ Risk warning, disclaimer: the above is a personal market judgment and analysis based on published information and historical chart data on The trading view,
And only some of these analyzes are my actual real trades.
I hope Traders consider I am Not responsible for your trades and investment decision.


The moment of truth is upon us, BTC's huge potentialThis week things are very simple and the stakes are very high. In every significant timeframe, you can see how BTC is at a pivotal point but none other than the 1-week time frame gives us a better view.
In this time frame alone you can see Bitcoin price having to overcome the 50MA (yellow wavy line), the 200MA (white wavy line), long-time support (thick straight white line), and midterm resistance (Thin straight white line). So what are we looking for? BTC has to jump up and close above all of these obstacles in a decisive way, anything less than that will signal weakness. Exactly what do I mean by decisive? BTC needs to have a very good week (long green candle) this or next at the very latest and close at 28k or 27k. As of right now 1 of the 4 obstacles has been conquered -- the midterm resistance, which is the weakest. Keep watching this timeframe. Hit and follow and I will post more.
There's so much to unpack in this timeframe alone:
The 200MA (white wavy line) has been for many years support to BTC but it was lost back in June 2022.
The 200MA (white wavy line) and 50MA (yellow line) are going to make a death cross unless BTC pulls up.
The thick white straight line was strong support and was lost back in September 2022, now it is strong resistance
This is as hard as it gets for BTC. If it goes over decisively and it starts to close above I will be convinced of a recovery.
This chart I call lines only, it has made me a lot of money due to its reliability. Candles can create a lot of noise and make a chart look too busy so I created a chart with simplicity and reliability. How does it work? When all color lines cross under the white line it's lights out and we are going down for a while and when all lines have crossed above the white line it's all good times. As you can see so far it looks like good times are ahead but I do not make a move on short-term trades unless all lines have crossed.
VERY IMPORTANT: Hitting the "Like" button is like a tip, please don't forget to do so after reading, this is your way of thanking me for my time and so I thank you for yours.

BTCUSDT Short!Dear guys, I am shorting from 23.6k
hopefully 22.8k is my target or even more
what about you guys?
Don' trade blindly!
Thanks!
Cheers!

Btc long ideaToday we are looking for a long opportunity in bitcoin.
The entry region is perfectly tapped wait for theorice to retest again to get in on the trade.
Kindly take precautions before entering the trade.
If you like my idea follow me.
Thanks .

We will see new bottom for BTC in November 2022In this monthly log chart, we can see halving dates, previous bottom values of BTC. If history repeat again, we might see a bottom for BTC on November first week in 2022.

BTC UPDATES
22700-24200 Expected price target hit.
Now im waiting the price to pullback or it will drop more, if price can hold 23200 level then we see 25k here, If not, bitcoin will fall to 21200.
Trade base on your own decissions.
COme and CHeck me out for more..

Bitcoin BTC analysisUpdate from my last bitcoin analysis. Short term bullish (net 3-6 months), long term, we'll see once we retest the red lines indicating resistance & then
fall back & hold the white diagonal line, signaling a trend continuation to the upside. If this happens, that's when I'll look to add to my crypto positions.
News does't matter to me. I'm a trader. All trades show up in the chart. Talk with no trades taking place = distraction.
Only cryptos I'm taking seriously:
Bitcoin - just to trade & make money
Ripple/xrp - if governments/businesses allow it as payment or the ledger gets used by large investors
Solana - only because its used heavily in gaming
XTZ - I was in it for the rate of return but they've dropped that from 6 to 3%, so I'm not adding as much
Cardona/AAVE - small positions just to see if the tech gets taken seriously (not betting big on these)

Bitcoin: range-bound for a while?My current view on Bitcoin to check later: still in limbo for a while?
As it looks, it could continue to trade range-bound between the very long-term red and green trendlines for a while.
It may end up sliding down along the dashed blue medium-term resistance line.

🟩First time bullish for BTCUSD, in a long time🟩 I've being bearish on BTCUSD for a long time. However recently the market structure shifted. Only one shift to the upside so we are not in a real uptrend yet, and it's possible to see further distribution. However until that PL holds, I'll be more bullish overall.

Bitcoin long term outlookFirst outlook on previous analysis turned out to be wrong, but the overall idea is very much valid: BTC is now hanging around supply area/886 retracement level and losing momentum, RSI showing heavy divergence.
I wouldnt't expect prices to go balistic in 2023 with recession coming and goverments doing all kinds of crazy stuff.
This could very well be the top of the "bull trap", "fake out" or however you wanna call it.
In case we break 25k, 30k would be pretty much guaranteed, but i still excpect a sub 10k Btc within the year.
Remember the market will always gear towards the maximum amount of loss for the max amount of people, I would argue that a sub 10k BTC would be almost a sure thing if we get to 30k as the top of the fake out, just cause it would be such a loss for most people.
Always working level by level and taking action based on what the market tells me and not my feelisngs.
I would only enetertain the possibility of the bottom having been 15k if we break above 30k, until then this is the plan.

BTC/USD Shift of trend ?Hello fellow traders,
The Stoch RSI cross on the monthly, as well as being oversold on the RSI.
Monthly charts speak volumes. the next bull cycle may be starting. go against the herd <3

LETS PUMP THIS BABY. BTC/USDT ANALYSIS THIS IS NOT A FINANCIAL ADVICE....this video is provided for educational, informational, and entertainment purposes only, without any express or implied warranty of any kind, including warranties of accuracy, completeness, or fitness for any particular purpose.
LET'S GATHER AT 25K AND TALK WHAT ARE THE NEXT POSSIBLE ZONE! TUNE IN!

BITCOIN price, SP500, FOMC-Fed Funds Rate. Today will be hot🔥In 9 hours (from the moment the idea is published), the FOMC meeting will announce the new Fed Funds rate
At the previous meeting on 12/14/2022, the rate was raised from 4.00% to 4.50%
And then, the forecast was more than 70% that on 02/01/2023 the rate would be raised by another +0.5%, and on 03/22/2023 +0.25%
However, over the past month, US economic indicators have shown positive dynamics , sometimes even better than expected.
CPI 12/01/2023 - 6.5%, and GDP with a forecast of 2.6%, - 26.01.23 = 2.9%.
Everything was as the Fed wanted and as the markets were "guided".
Most financial markets took this news very positively, including the cryptocurrency market.
Roughly speaking, the announcement of today's rate has already been "priced in" to current prices.
Moreover, 99.7% expect that due to improved macroeconomic indicators, the US will announce a rate hike of only +0.25% today, not 0.5% as predicted a month earlier.
And more than 82% believe that the rate will be raised by +0.25% to 5% in total on 03/22/2013.
To summarize:
- the announcement of a rate within the expected range of 4.50-4.75% will act as a driver for the continued growth of both the SP 500 and the crypto market. Of course, increased volatility is guaranteed, which may be used to try to knock "extra passengers" out of long positions with a squeeze down.
- The announcement of a rate of 5.00% or higher is guaranteed to bring down both the SP 500 and the crypto market. How long the fall down will last is "another question".
We have depicted these two possible scenarios as fractals.
Which one do you like better: blue or white? Vote in the comments
SP500 also has two possible scenarios:
_____________________
Did you like our analysis? Leave a comment, like, and follow to get more

Bullish on Bitcoin, Prove Me WrongThis is my favorite indicator for a macro lense. As you can see by the CM Super Guppy Indicator; and the VWAP something very interesting is happening that you cannot fade. First off you'll notice we are over the VWAP for the first time in months, but when layered over the Super Guppy Indicator you can see thats it's very hard to deny these moves in either direction. People will tell you to short this all the way up and it really makes you wonder. Also, 18500 was a serious level that was defended for 6 months and was only pushed slightly lower when the news of the FTX scandal hit. The very fact that within 6 weeks bulls we're able to reclaim this territory is not something to be faded. So yeah, until i am proven otherwise i am very bullish on Bitcoin
