Bitcoin bounced just as expected, & Possible scenarios.$BTC bounced off the support just as expected and reached my first TP (take profit) at $23,800.
$BTC rejected hard and dumped very fast after reached the first TP unfortunately though, which was honestly unexpected.
After this current rejection, I have charted possible bearish scenarios, as well as the bullish scenarios of course.
I am still going to hold my long, but I will be cautious and might hedge a short, we will see.
$BTC is in for volatile times, personally I would not use high leverage during the volatility.
FOLLOW ME for accurate FREE Crypto analysis/signals!
Bitcoinforecast

BTC - Omega Bull next 2-3 yearsBTC
Laid out the #BTC map for the next 2-3 years.
Break out of $15k-$25k accumulation range in 1H 2023.
Re-Accumulation range $25k-$50k up until May 2024 halving.
Mark-Up expansive growth throughout 2024-2025, ultimately topping out in 2025 at $100k-$250k.
#Bitcoin
- @CryptoCurb

💥 BTCUSD 4H-TIMEFRAME ANALYSIS💥 BTCUSD 4H-TIMEFRAME ANALYSIS
💗Hello ladies and gentlemen
This is my new idea for 💥BTCUSDT BTCBUSD
I hope my idea is clear
Support me by like and share thank you
Stay Safe💯💲💲💲
Good luck💰😍
BTC in same structure as 2017 blow off topThis may be insignificant to some of you, but I just wanted to share my observation.
As you can see I believe that BTC is in the same blow off top reversal from 2017, only thing it is on a much smaller timeframe. The current chart for BTC is the 5m, and the historical chart is the 3d. It is not completely accurate but I do see some uncanny similarities with this structure.
What do you think?

BTC/USDT BINANCE Strong magnet pull from previous large support areas in the past.
Would be nice to tp @ 30k , and maybe correct from there.
Is the a relief rally or mini bull run.
A lot of opinions from both bulls and bears.
I stay in the middle perspective and see how we can learn from both sides.
These are only my opinions and isn't financial advice.
DYOR!
Thanks Like , Comment, and Follow for more ideas.

DXY Falling - Crypto and Bitcoin Rally vs Crash DXY ZonesThe market market rally has been fueled by the dropping DXY, but it's now close to important support.
Will the DXY rally from here?
Are we being setup for a disappointing FOMC announcement that could crash the markets, and see the DXY shoot higher?
Or are we about to see a DXY breakdown here, and a 'Melt Up' situation in crypto -- before seeing another leg down in Q2 as the economy cools and the Recession really hits home?
Either scenario is possible.
Follow the DXY for clues.
Here are my Rally vs Crash zones based on the daily DXY.
Comments welcome below!

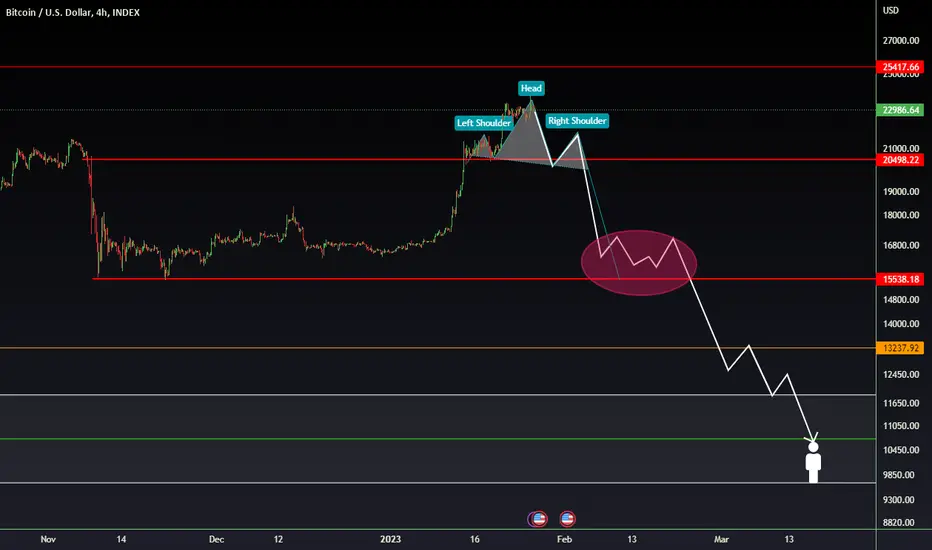
Bitcoin is on the edge of collapse!Hello, everyone!
Yes, this is just the bright heading, of course collapse on the Bitcoin will not be in February 2023. Now I anticipate just a correction to allow us to enter the long trade.
On the 4h BTCUSDT chart we can see a lot of bearish signals and if it will continue climbing it would be really weird. The most bearish factor is the double bearish divergence on the Relative Strength Index RSI. We could choose any oscillator and all of them are showing the same. Divergence is the sign of the completion of the wave 5 and BTC should show us the correction soon.
Another one important thing is the trendline support breakdown. I am not keen on trendlines, but this time it looks valid. Moreover the price was unable to reach the trendline resistance and bears took control before. The combination of these factors is enough for me to make the bearish forecast for the next week.
In general, I suppose bullish rally is not over and we have to see another one leg up above $25k before the true collapse. The potential buy zone is still $20500 , there we have to watch out carefully on long trade setups.
Best regards, Ivan
________________________________________________________________________________________________
If you like my trade ideas, please smash the boost button to stimulate me make more quality analytics!

BTC Wave B has begun!We are just waiting on confirmation of a break and close over the previous LH ($25,200) to confirm a sign of strength/Quasimodo. This will also further validate the near term protected bottom of 15.5k and present a once a year opportunity to buy the bottom/open short term longs at the retest of $17,600. Keep in mind, this short term bull run is only a 3-3-3 corrective Wave B and will face a major level of resistance around $35,900. We can only speculate for now.

Bitcoin- It's imperative for bulls to keep 21k intactSince the beginning of the year, Bitcoin has entered a strong recovery move, and although I'm not so optimistic and don't see a sustained rise for the next 6 months or so, for me, as a speculator, doesn't matter much if the price of BTC will be 100k or 10k in the next 6 months. All that matter is where BTC's price will be next week.
And all I know is that, at this moment, the old 21k resistance should act as support now.
As I said, the price is very well sustained at this moment and, as long as we are above 21k, bulls hold the upper hand.
That being said, buying dips could be a good strategy if we target 25k and set a stop loss under 21k

BITCOIN MANIPULATION ACTIVATED
More SHorts got liquidated here, always do the opposite.
Thanks to all who patiently waiting.
always wait manipulation
Trade base on your own decissions
COme and check me out for more Daily analysis.
Im expecting now price goes 20200 or below

Bitcoin Stock-To-FlowThe Bitcoin Stock-To-Flow Indicator has come under alot of attack recently for failing to adhere to the Bitcoin price as originally forecast and has been deemed as an unreliable indicator by many critics. However, what I'm showing you here is a new way to "see" the indicator which might change how everyone views it in the future.
Note how close price is at the point where the S-T-F indicator makes a 900% jump to the next level at the yellow circles. This marks an important point in the S-T-F cycle and the price is right at or even on this point when it makes this jump. The next level jump will occur around the April 1, 2024 date which puts Bitcoin at or near the 150K target range. The likelihood that bitcoin will go higher than this price before this date seems unlikely at this point.... But you never know, the upper Red band is at the 250K level and would mark an extreme top for this cycle.
The Long Term target is around Feb/March 2028 (scroll chart forward) which puts the Bitcoin price in the 1.5 Million range.

Short Term Bitcoin longThe chart for $BTC is showing me many bull flags.
From the chart shown above, you can see a local breakout, Moving Average support is holding $BTC, and that RSI has lowered.
I have done much more analysis to back my long belief, special indicators of mine indicating it will go up among other fundamental and technical analysis.
Keep in mind $BTC is volatile these days so I advise being very careful and vigilant!
STOP LOSS: $22,180
TP1: $23,400
TP2: $23,600
TP3: $23,800
TP3: :$24,000
You may wonder, "Why have you not shared all your TA and other analysis?"
Well simply because the Fundamental side of it is quite long, and honestly I do not like showing all my TA tricks publicly on TradingView.
I also unfortunately cannot tell you where to go to see all my tips and tricks because TradingView will label it as self advertising lol.

BTC 4 HOUR CHART SHORT Here is My Opinion on a short scenario for BTC On the 4-Hour CHart.
BTC Is having a really tough time breaking the 23000 $ LVL ANd COULD Potentially Go Back down to restest some lower LVLS
These might be the 22360 , 21500 , EVEN the 20200 - 19102$ LVLS .
Good Luck out there folks :)
LOVE LOVE


BTC Bitcoin: 1D Chart UpdateToday you can review the technical analysis idea on a 1D linear scale chart for Bitcoin (BTCUSD).
Bitcoin price has been pumping recently and there is potential for it to keep moving higher, but BTC price and RSI just made a lower low. If price keeps heading lower, it may come back down the channel shown in the chart. The area of support is in the $15K-$16K region. RSI may be cooling down as well.
If you enjoy my ideas, feel free to like it and drop in a comment. I love reading your comments below.
Disclosure: This is just my opinion and not any type of financial advice. I enjoy charting and discussing technical analysis. Don't trade based on my advice. Do your own research! #millionaireeconomics

Bitcoin short term Price PredictionHow it may play out soon...still bullish...we are at 23.6% retracement from March 22 high and its VWAP ... I think this area will be resistance for 3-4 weeks before we pop again.

BTCUSD - Parabolic Glitter IndicatorIndicator called 'Parabolic Glitter' is currently flashing green with BTCUSD recent move up
Each flash green in the past has led to a big run
Lets see how it goes

BTCUSD WEEKLY HOLALYSISAs of the moment WHALES does its job to induce and liquidate most of retail trader. Everything is engineered. I don't think Bitcoin will break 25k-26k zone at the moment so my over all bias still BEARISH, if so happen to break that zone it a clear change of character from downtrend to an uptrend, definitely change my bias too into BULLISH.

BTC to go to $25159 but how?Hey traders
Pretty impressive rally from the low teens to this level but where to now?
We imagine 3 possible scenarios and in order to work together on this we highly encourage you to comment your opinion or additions you might have.
Scenario one : White line - 5 wave move with the 4th move being at the last high - short term bearish
Scenario two : Orange line - 5 wave move with the 4th move being at the .66 fib - short term bearish
Scenario three: Wick down to take out stops and trigger some local liquidations then continue up without forming a 4th wave .
Which one do you think is the most probable?

BTC TRAP - What goes up, must go down!Greetings Investors, Traders and of course Beez!
Today CryptoQueens have prepared an analysis regarding BTC after its recent pump. So without much talk, let's get to it!
In particular if we watch closely the chart, we can observe that price has been moving inside the descending triangle in the Daily time frame for a long period of time. Eventually, price has either to breakout to the above or breakdown. The majority of times, it tends to breakout to the upside. Hence, after bulls, pushed the price above the descending resistance line, a huge inflows of buying power flew directly into the market pushing Bitcoin even further to the point of 23,390$ breaking the previous high of 22,850$.
Since then, price has been consolidating, between previous high which acted as support and new high. This especially, indicate us that bull are still present, and that they are preparing for the next leg up. Next Resistance - Bearish Orderblock is standing at 25,000$.
In the imminent case of breaking above, we can expect to see prices such as 28,000$, filling the FVG GAP or even test the area of 31,000$ where the next Bearish Orderblock is located.
Make no mistake though, after having a quick peek at the image attached to the chart, we can observe that large positions has been liquidated even at the level of 23,300$ and liquidity from above has already been grabbed at the highlighted levels in all exchanges.
At this point we can expect high levels of FOMO to flow into the market from retailers. Don't fall for it!
IMPORTANT: When price bursts to the upside without consolidation, its considered unhealthy, as it creates no resistance/supports on its way, therefore what goes up quickly, it has to go down swiftly eventually.
Moreover, bear in mind that, reversals tend to occur, when everything indicates the opposite!
After new high has been formed and price get rejected, we highly anticipate a new low to occur!
DISCLAIMER: This analysis is not intended to encourage any buying or selling activity of any particular securities. In addition, it should not be considered as ground for taking any trade action. Hence, your own diligence is highly recommended before entering any trade.
If you liked the idea, make sure to support with a like, follow and a comment!
Best Regards, CryptoQueens.

BITCOIN UPDATES SIGN OF NO LIQUIDITY?
Higher Timeframe break on 4hr, then markets makes obvious moves on downside, but leaving always order block on 15min timeframe.
Looks pretty good if you trade since this posted yesterday.
Thanks to all who follow this and trade it.
If you like my Ideas follow for more, Like or comment or suggest it.
Trade only base on your own decissions.
This setup is scalping 15min, im basing only on its order block behind.

BTC Pi Cycle Bullrun SignalHello friends
Today im going to show you a good reason for next Bullrun in Bitcoin.
Pi cycle includes 2 Moving Average:
One Long MA and One Short MA.
when we devide this 2 MA the result equals PI number (around 3.15)
The best Long MA is 471 DAY and the best Short MA is 150 DAY.
I illustrate them in BLX chart and yo see the last 2 times that Pi cycle Bottom works properly.
the first Bottom was on JAN 2015 and second Bottom was on JAN 2019 and NOW on JAN 2023 (as i show them with Red Circles in my chart)
the indicator signal a Potential Bottom for BTC.
If Short MA (RED) surpass Long MA(GREEN) we call it a PARABOLA and the Bottom confirmed.
If you think more about that you understand this cycle happened every 4 years actually on January.
2015 - 2019 and NOW 2023.
So i explained Technical and Time Cycle Analysis for this Strong Indicator.
Hope it predict Bottoms WELL.
Be Profitable
Thank You for reading my Idea
Share me your Opinion.
Do you think BTC make a bottom NOW?

Bitcoin – my next insane trade!Hello, everyone!
It’s time to forget about my failures which I made last couple of weeks and think about new trade ideas. Of course it’s extremely dangerous to buy Bitcoin right now becuase it shows us some sign of weakness.
We will use 4h time frame of BINANCE:BTCUSDT chart to count the waves inside the current cycle. The Awesome Oscillator is our main tool to understand the waves order. It’s maximum value corresponds to the wave 3 top. After that we saw the zero line crossover which is the sign that wave 4 has been finished. Now the BTCUSDT is printing the wave 5. I suppose it’s almost done. I expect the only one fake breakout to $23600 – $23800 price levels. Moreover the wave’s 5 target is located also next to this price value.
The overall uptrend is not finished, but I expect the correction where we can enter the BTC long trade. The target area for the potential dip is $20500 because the wave’s 4 end of lower degree is located here.
Best regards, Ivan
________________________________________________________________________________________________
If you like my trade ideas, please smash the boost button to stimulate me make more quality analytics!
