BTC UPDATES SHORT IDEAS
Looks pretty good on my previous idea!
im expecting bounce to 21060, for entries wait for AR to be break. thats how our entries.if price goes back to 20700 thats how we take entries.
Thanks who follow this idea. if you like it, just comment or suggest. I really appreciate your suggestion.
CHeck me out i posted daily analysis and journal.. Thanks to all followers. We keep growing, We always learn and most of all we take profits here!..
Bitcoinforecast

BTC SHORT IDEAS UPDATES
As I Predict, Price can make Upper thrust after Distribution,,
Our entries are below on Auto Reaction zone, that makes Last supply pattern, The drop baSe drop pattern.If the price still ranging, we dont trade. wait for price goes back to AR zone,
If AR zone broken thats how you wait and make a entries.
CHeck me out on my daily analysis. Trade base on your own decission.
Thank you and Lets grow. learn form others also, dont be a follower be a student thats my mentor always told me.
Always learn form others.

Next Move DXY (comparison BTC)In this comparison we see
BTC Yearly Performance 2022-2023 and
DXY Yearly Outlook 2023-2024
The Indicator is PIVOT POINTS STANDARD with DeMark, Woodie & Camarilla.
The Grid of all 3 Pivots for BTC in 2022 is the exact same for DXY for this year.
Will DXY dump this year? Is BITCOIN surpass its ATH?

BTC WYCKOFF SHORT IDEASExperience traders already know, Bitcoin is on accumulation process as of now, the market need more liquidity.
As my ideas being published I see here a Distribution methods, but its only lower Time frame, Good for scalpers.
As you can see massive volume release, it means we have more rooms to goes down.
If you like my ideas give alike or comment.
Check me out for more. Thank you

Bitcoin Attacking Static Daily high and Bulls Re-entering?The basis of this analysis is the price action of al brooks, and I just wanted to look at the market simply. So let's wait and see what happens

BTC - More upside before breaking down!Dear Traders and Investors, as all you know Crypto Queens Here.
First of all we hope you have a good and profitable week, and that you are resting well this weekend because we are anticipating some intense moves this upcoming week. Without further ado, let's get to it.
A fast Short-term update regarding our latest report on 1D - BTCUSDT Post. Everything is going based on plan. BTC tested 17.000$ level, and at the time of writing it is still consolidating above 16.900$, which is a good indicator. A rising Wedge has been formed which as we all know, it's often considered a bearish chart pattern that pinpoints imminent breakout to the downside. Having as an example, the previous one which reacted quickly and broke structure to the downside. Nonetheless, nobody knows, when where that reversal will occur. Therefore, as long as we stay inside the pattern and as the price gradually, moves higher, we are aiming to test the FVG (Fair Value Gap) Area at 17300$. At this point, there are 2 scenarios in play:
SCENARIO 1: Close FVG at 17300$ and effective immediately reject, at the point mentioned in the chart (Support), at 16800$.
SCENARIO 2: Close FVG at 17300$, consolidate between 17300$ - 17100$ and test the lowest point of the Daily Bearish OB at 17700$, which ultimately will be rejected and lead us all the way to our Daily Bullish Orderblock (Support Area), at 16800$.
SCENARIO 3: Check the "link to related idea" . You will find a Long Term view indicated on previous Post on 1D regarding 1st Quarter.
IMPORTANT: This is strictly a Technical Analysis and Fundamentals CAN affect our Analysis!
Keep in mind though, when everyone seems optimistic, be pessimistic, and visa versa.
Not a Financial Advise!
Trade with Caution!
Best Regards, CryptoQueens.

Bitcoin – bull market has just been started!Hello, everyone!
Bitcoin has just change my mind to bullish. Also he gave me the very important lesson. I feel upset and have to think what I need to do next. But I feel upset not because of loss, I have the great money management and it’s not critical. I believed in trading chaos and it gave me a lot of nice signals. Now I am going to reconsider which approach to use in trading.
Let’s take a look at the 1D time frame on WHITEBIT:BTCUSDT chart. Of course bull market has been started, but I am not going to hurry up to buy all in. I will remind you that I have 23% of deposit in crypto on spot. If I consider that my previous wave analysis is invalid I wanna suggest you the new one. We now have the waves 1, 2 and 3. Wave 3 is going to end next to the current price because it reached the original target 1.618 Fibonacci extension.
Where I am going to buy. Waves 4 usually reaches the 0.38-0.5 Fibonacci retracement levels. That’s why I am going to by BTC at $19053 . With the potential target above $22k .
Best regards, Ivan
________________________________________________________________________________________________
If you like my trade ideas, please smash the boost button to stimulate me make more quality analytics!

Failed swing high on Bitcoin: new lows in the marketPossible failed swing that tops around 22k, filles imbalance and then leads to new lows. More pain to come.

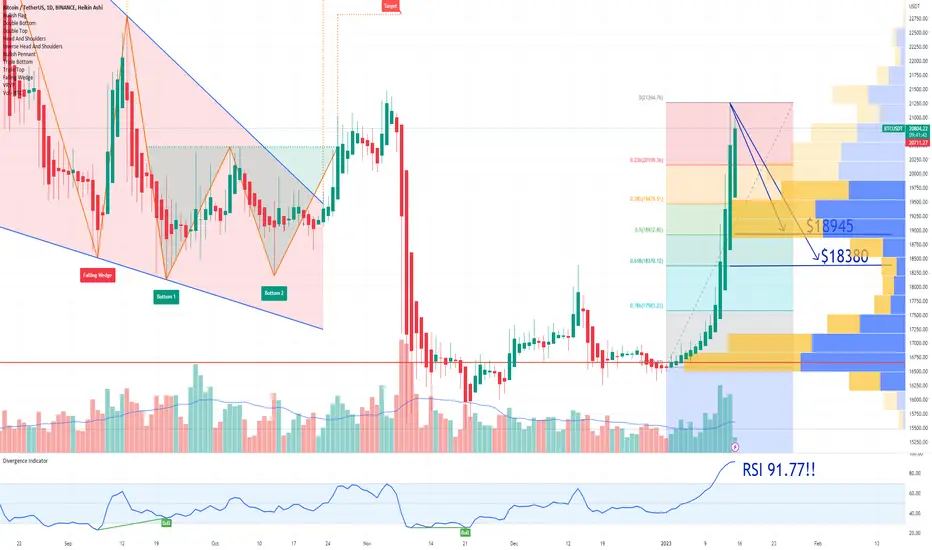
BTC Bitcoin Fibonacci Retracement Price TargetAfter the Santa Claus rally was better then expected:
Now we need to notice that the RSI is extremely extended at 91.77.
Fibonacci Retracement gives us two possible Price Targets for the retracement:
$18945 and $18380.
Looking forward to read your opinion about it.
BTCUSDTPERP DOING LAST WAVE? The C of Zigzag and end the winter?From the breaking down on earlier November, The price was in correction around 1 months and few days, Look like the price almost choose its direction, The small x wave of c in wave B of bigger Zigzag looking good, but wait the price breaking the channel and retest (May noy retest), Then enter short position, First target price will be around 12,460$, careful before entering.
BINANCE:BTCUSDTPERP

#BTC is up 30% in 14 Days. What's Next?Bitcoin is up 30% in the first 2 weeks of 2023.
This is a fantastic development in price.
Everyone who doubted my analysis is silent now.
When BTC wants to break No resistance can stop it.
Feels like May 2020.
Keep in mind Risk Management is necessary atm.
Stay in BTC, Scalp Alts. This is my plan.
The following Resistance levels to watch are $21300 and $22800 and $24300.
With a little correction, I am expecting these levels to be taken out in a few weeks or maybe days.
I have posted hundreds of updates on other social platforms indicating the best time to buy is around $16k.
I am still holding the BTC Long and I feel, The trend is changing no matter what they say.
Although the real Bull Market will begin in 2024, BTC can reach $30k from here.
Let me know what you think, and do hit the Boost Button to support my content!
Stay safe
#PEACE

Reasons to be bullish here for Bitcoin : The following are the Reasons why i am bullish on bitcoin.
1- Weekly RSI Breakout
2- Weekly bullish divergence
3- Longest bear market ever
4- Weekly buy signal in supertrend
5- Price above bullmarket support band
6- Breakout above key resistance zone
7- Bearish retail sentiment
8- RSI Trend breakout
Lets see how the market rewards us for the upcoming few months...

BTC ; WORSssst case scenario ; weird amazon destruction fractal BTC ; WORSssst case scenario ; weird amazon destruction fractal
pretty bloody self explanatory
thought id throw this up after seeing victor cobra touch on it in his vid. interestingly disgusting fractal. hopefully its wrong lol

Bitcoin- New leg up- probable, FOMO- not advisableBitcoin reversed around 30% from November's low with more than 20% made this year, and I already see a lot of people calling for a bottom.
Indeed, this is a strong reversal, but calling for a bottom is a little early and, in my opinion, the economy is not out of the woods, by far.
Nevertheless, in short term, I'm strongly bullish and I expect a new leg up.
Yesterday, Bitcoin had an intraday correction and this could be it and a break above 21 could again accelerate gains to 23k.
However, from a speculator's point of view, a buy here is not making sense from a risk perspective
In conclusion, dips under 20k should be considered good buying opportunities, with a stop loss under 18k and a take profit around 23k

$BTC BitcoinBTC Price Live Data
The live Bitcoin price today is $20,731.01 USD with a 24-hour trading volume of $29,721,602,588 USD. We update our BTC to USD price in real-time. Bitcoin is down 0.91% in the last 24 hours. The current CoinMarketCap ranking is #1, with a live market cap of $399,332,928,479 USD. It has a circulating supply of 19,262,593 BTC coins and a max. supply of 21,000,000 BTC coins.
What Is Bitcoin (BTC)?
Bitcoin is a decentralized cryptocurrency originally described in a 2008 whitepaper by a person, or group of people, using the alias Satoshi Nakamoto. It was launched soon after, in January 2009.
Bitcoin is a peer-to-peer online currency, meaning that all transactions happen directly between equal, independent network participants, without the need for any intermediary to permit or facilitate them. Bitcoin was created, according to Nakamoto’s own words, to allow “online payments to be sent directly from one party to another without going through a financial institution.”
Some concepts for a similar type of a decentralized electronic currency precede BTC, but Bitcoin holds the distinction of being the first-ever cryptocurrency to come into actual use.
Who Are the Founders of Bitcoin?
Bitcoin’s original inventor is known under a pseudonym, Satoshi Nakamoto. As of 2021, the true identity of the person — or organization — that is behind the alias remains unknown.
On October 31, 2008, Nakamoto published Bitcoin’s whitepaper, which described in detail how a peer-to-peer, online currency could be implemented. They proposed to use a decentralized ledger of transactions packaged in batches (called “blocks”) and secured by cryptographic algorithms — the whole system would later be dubbed “blockchain.”
Just two months later, on January 3, 2009, Nakamoto mined the first block on the Bitcoin network, known as the genesis block, thus launching the world’s first cryptocurrency. Bitcoin price was $0 when first introduced, and most Bitcoins were obtained via mining, which only required moderately powerful devices (e.g. PCs) and mining software. The first known Bitcoin commercial transaction occurred on May 22, 2010, when programmer Laszlo Hanyecz traded 10,000 Bitcoins for two pizzas. At Bitcoin price today in mid-September 2021, those pizzas would be worth an astonishing $478 million. This event is now known as “Bitcoin Pizza Day.” In July 2010, Bitcoin first started trading, with the Bitcoin price ranging from $0.0008 to $0.08 at that time.
However, while Nakamoto was the original inventor of Bitcoin, as well as the author of its very first implementation, he handed the network alert key and control of the code repository to Gavin Andresen, who later became lead developer at the Bitcoin Foundation. Over the years a large number of people have contributed to improving the cryptocurrency’s software by patching vulnerabilities and adding new features.
Bitcoin’s source code repository on GitHub lists more than 750 contributors, with some of the key ones being Wladimir J. van der Laan, Marco Falke, Pieter Wuille, Gavin Andresen, Jonas Schnelli and others.
What Makes Bitcoin Unique?
Bitcoin’s most unique advantage comes from the fact that it was the very first cryptocurrency to appear on the market.
It has managed to create a global community and give birth to an entirely new industry of millions of enthusiasts who create, invest in, trade and use Bitcoin and other cryptocurrencies in their everyday lives. The emergence of the first cryptocurrency has created a conceptual and technological basis that subsequently inspired the development of thousands of competing projects.
The entire cryptocurrency market — now worth more than $2 trillion — is based on the idea realized by Bitcoin: money that can be sent and received by anyone, anywhere in the world without reliance on trusted intermediaries, such as banks and financial services companies.
Thanks to its pioneering nature, BTC remains at the top of this energetic market after over a decade of existence. Even after Bitcoin has lost its undisputed dominance, it remains the largest cryptocurrency, with a market capitalization that surpassed the $1 trillion mark in 2021, after Bitcoin price hit an all-time high of $64,863.10 on April 14, 2021. This is owing in large part to growing institutional interest in Bitcoin, and the ubiquitousness of platforms that provide use-cases for BTC: wallets, exchanges, payment services, online games and more.

Bitcoin 2018 Bear Market v 2022 Bear MarketThere is a striking similarity between the 2018 and 2022 bear markets in Bitcoin as illustrated on this chart. This is the same thing I have been discussing for months now on Twitter and YouTube while so many other large influencer accounts were screaming that it HAD to go below $12K. While there is no guarantee that the low is in yet (there are no guarantees in trading except that you WILL lose money at times), there are a number of signals that it very well may be. This is just one of them.
Break out impulsively above the weekly pivot and there should be no looking back.

Bitcoin Analysis 14.01.2023Hello Traders,
welcome to this free and educational analysis.
I am going to explain where I think this asset is going to go over the next few days and weeks and where I would look for trading opportunities.
If you have any questions or suggestions which asset I should analyse tomorrow, please leave a comment below.
I will personally reply to every single comment!
If you enjoyed this analysis, I would definitely appreciate it, if you smash that like button and maybe consider following my channel.
Thank you for watching and I will see you tomorrow!
You can also check out my previous analysis of this asset:

$BTC Fractal Analysis Bearish for now, until we can see a major change in Bitcoins volume we wont see this fractal play out. If you believe this can happen, we need a major event to incentivize people to stock up on BTC and not cash/ commodities. Another dump from here can see a major change in hands from the weak to the strong. In the past 48 hours over 100 billion dollars has entered the Total crypto market, almost hitting 1 Trillion for the total crypto market cap. IF there is a dump from here, I can picture a lot of volume coming into the space to prop bitcoin back to a new ATH. wait and see.

Bitcoin - the newest local reviewHello Traders and Investors. I hope you are doing well.
Let's start with the fact that it was a really incredible week. Bitcoin grew from $17k to $21k. This is very cool, congratulations to all bulls with a profit. I am also partially on your side and am still keeping a trade on my own indicators.
Unfortunately, TradingView administration forbids sharing analysis of paid indicators for free, I really don't understand it, so the only place where I can do it is twit$er.
Okay, so let's move on to the analysis.
The first thing I want to highlight is $21,480, a very important level at the moment, which plays an incredibly significant role. If the price updates this high, it will mean the breaking of the descending structure and the beginning of a bullish trend. After that, the door to $28 - $32k will be open.
Will there be a pullback and where to buy?
No one will tell you the answer to this question, but you can identify a zone where you can buy bitcoin or open trades in case of correction.
At the moment, a very strong support zone is $19,200 - $18,400. In this zone, there is the largest traded volume, 0.5 - 0.68 Fibonacci levels, and indicators that I cannot show according to the rules.
All my 6 years of trading experience, knowledge, developments, and indicators I share them here in ideas for free. In return I will ask you just follow me, like this post and leave a nice comment, it will allow me to move faster and make more useful content! 💚💚💚

Financial Wave. BTCBitcoin continues to rise in wave 3, and therefore the levels of the possible end of this trend in our priority scenario have changed. Growth may end at $22,564. We allow a price rollback, but not lower than $18836. If the price of BTC falls below this level, our view will change.

#BTCUSD- OVERVIEW- EXPECTING THIS MOVE!-Due to recent economic events price have shown some bullish momentum and this momentum might continue until 22k and then drop from there.
what you all think?

The Bitcoin BottomThe chart above provides two bottom projections for the price of Bitcoin. These projections are based on what is called the cycle low multiple .
This is a screenshot of the Bitcoin Cycle Low Multiple chart
The cycle low multiple for Bitcoin is currently 2. This means that if prior cycle price action is predictive of future cycle price action, Bitcoin's current price (~$20k) is twice as high as it will be at the bottom of the current cycle (~$10k). Although historical price action does not guarantee future price action, history generally tends to repeat itself.
With that said, both projections suggest that Bitcoin's price will fall to around $10,000 at some point between late October and late November. Both projections also suggest that this will be the bottom and that price will undergo recovery at the end of 2022 and into the beginning of 2023.
In the future, I plan to write a longer post about my thoughts about Bitcoin, blockchain technology, non-fungible tokens (NFTs), decentralized finance (De-Fi), and decentralized autonomous organizations (DAOs), but I will share a few preliminary thoughts below.
After much research, it is my strong belief that Bitcoin is posing a systemic risk to the fiat monetary system. Although Bitcoin presents new obstacles as a currency and as a store of wealth, its ability to facilitate transactions and store wealth independent of central banks' monetary systems will eventually draw the ire of these institutions.
However, due to Bitcoin's decentralized nature, it will be virtually impossible for governments to stop. This will present a major challenge to the fiat monetary system. Be wary of Central Bank Digital Currency (CBDC) as this could become central banks' means to more effectively stop their citizens from converting fiat currency into Bitcoin.
What central banks fear most is when their citizens realize that, due to its perpetually increasing scarcity, Bitcoin preserves wealth over time, unlike any fiat currency. This attribute of Bitcoin combined with its completely decentralized nature makes it a monumental challenge to the fiat monetary system.
Finally, one important note: If you choose to accumulate Bitcoin, be sure to use a secure hardware wallet. Do not trust any exchange or company to maintain custody of your Bitcoin on your behalf.
Note: This is my first post done on a light background. I have learned that some people have eye strain when viewing charts with darker backgrounds. I would appreciate receiving comments below on whether people prefer a light or dark background on my charts, or if it does not matter.
This is not financial advice. As always, anything can happen. Cryptocurrency involves significant risk and investors can lose a significant amount or all of their money.

